A reader asks:
Any chance you could do a deep dive into leveraged index funds in a future post? I’ve seen some analysis that has suggested an “ideal” leverage ratio of 2-3x, other posts about the dangers of drift/holding on for too long, etc..
While I have previously discussed leverage and why I am generally against it, I’ve never actually analyzed leveraged index funds/ETFs, until now.
For the uninitiated, a leveraged index fund amplifies the daily return of a particular index through the use of debt. So if you bought a 3x leveraged S&P 500 index fund, your daily return would be magnified 3x. If the S&P 500 gains 1% in a day, you gain 3%. If it gains 2%, you gain 6%. What’s not to like? Well, if the index loses 1% in day, you would lose 3%, and so forth. The amplification of daily returns happens on both the positive and the negative side. Because of this structure, if the index were ever to lose 33% in a single day, your 3x leveraged holding would be completely wiped out.
While it’s easy to talk about these losses in a vacuum, they are much more terrifying in real life. For example, during the coronavirus crash in 2020, a 3x leveraged ETF of the S&P 500 declined by 77% in total (at its worst point) compared to only a 33% decline for the underlying index:
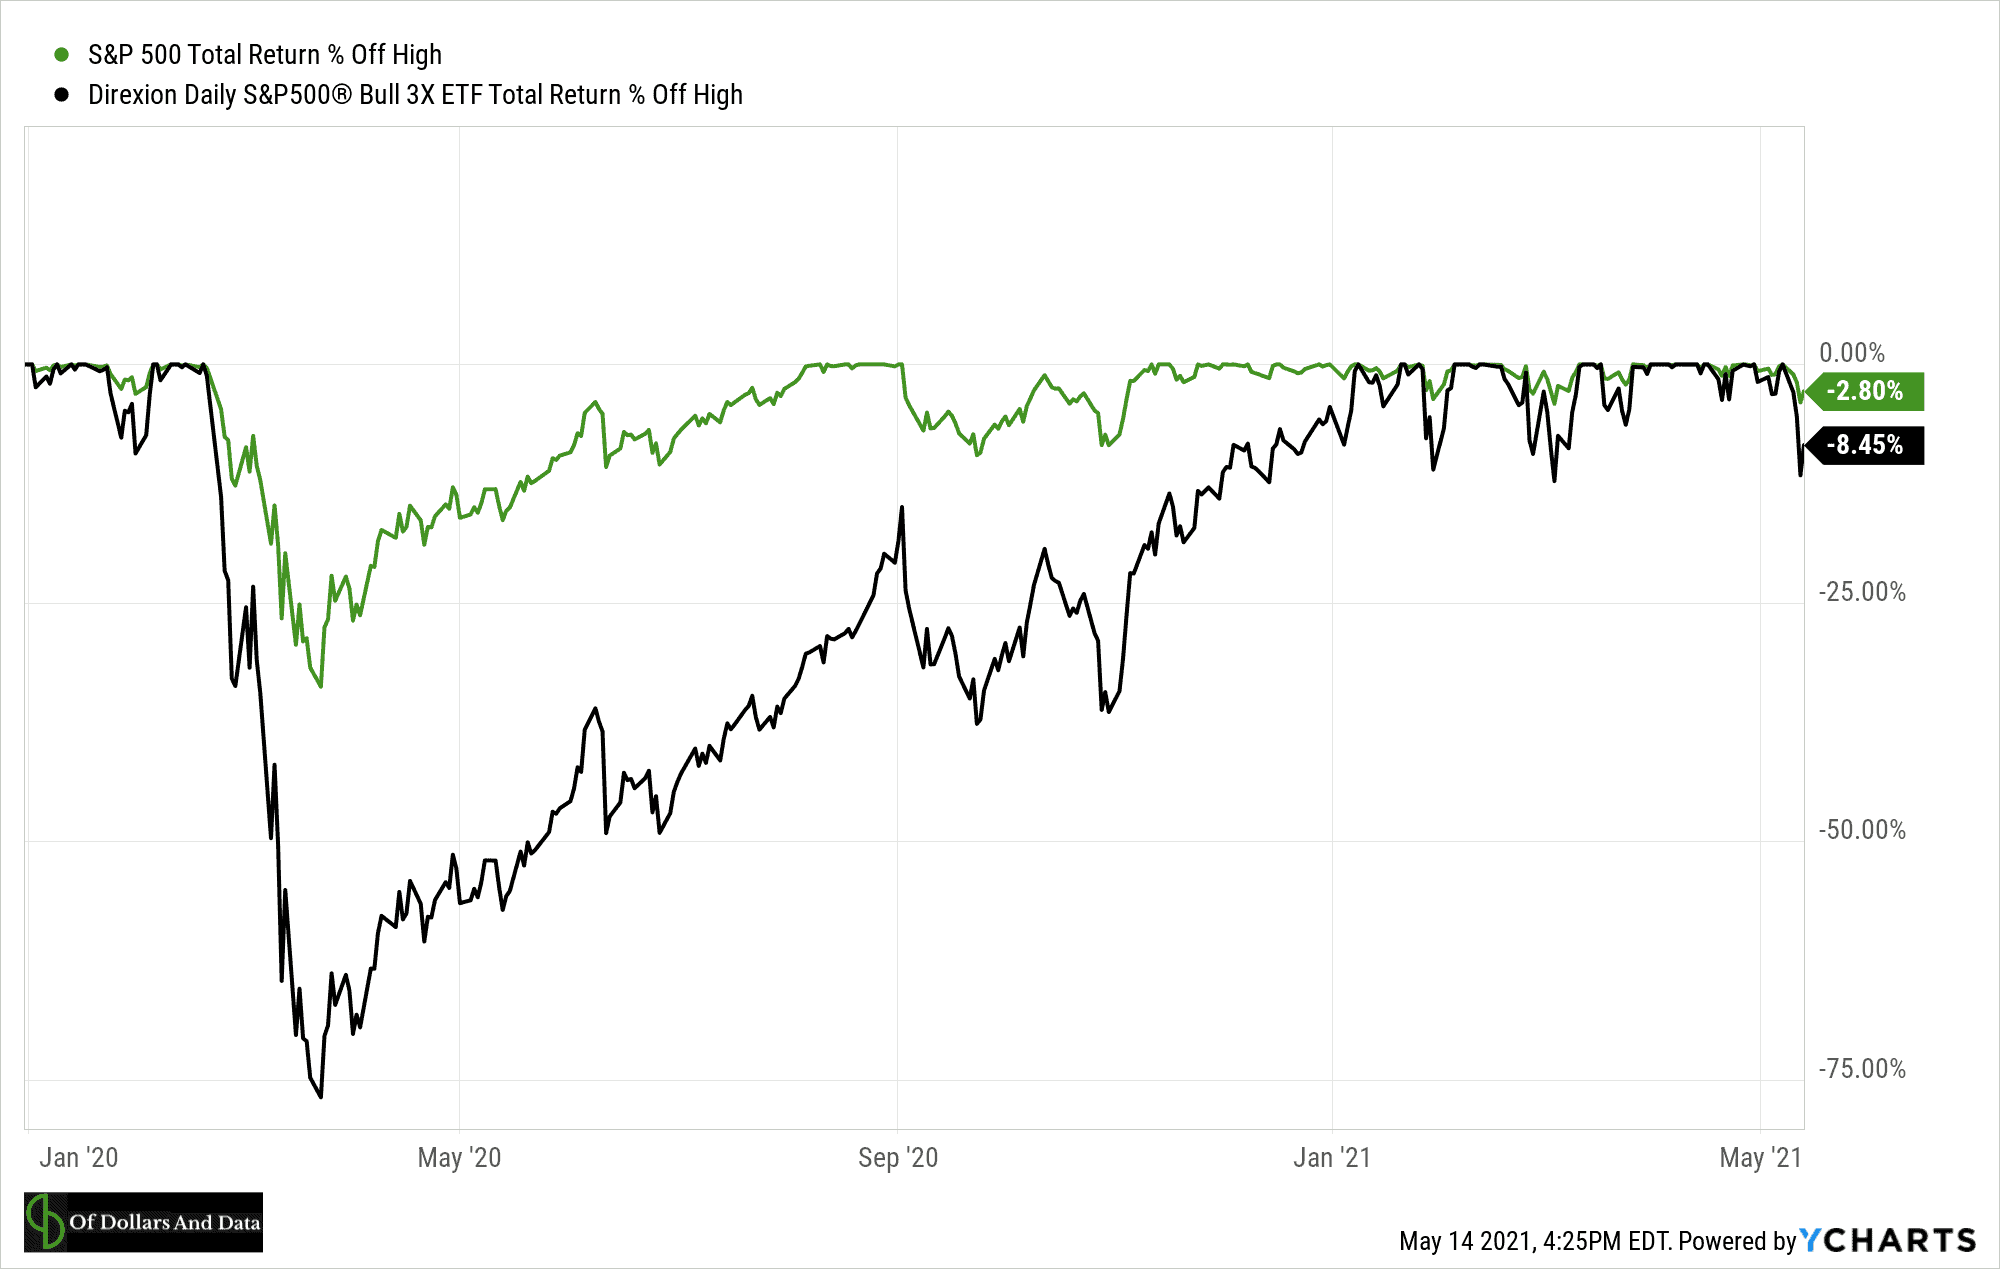
Despite these magnificent losses, the 3x leveraged index fund outperformed the S&P 500 over this time period because of the strong recovery that followed:
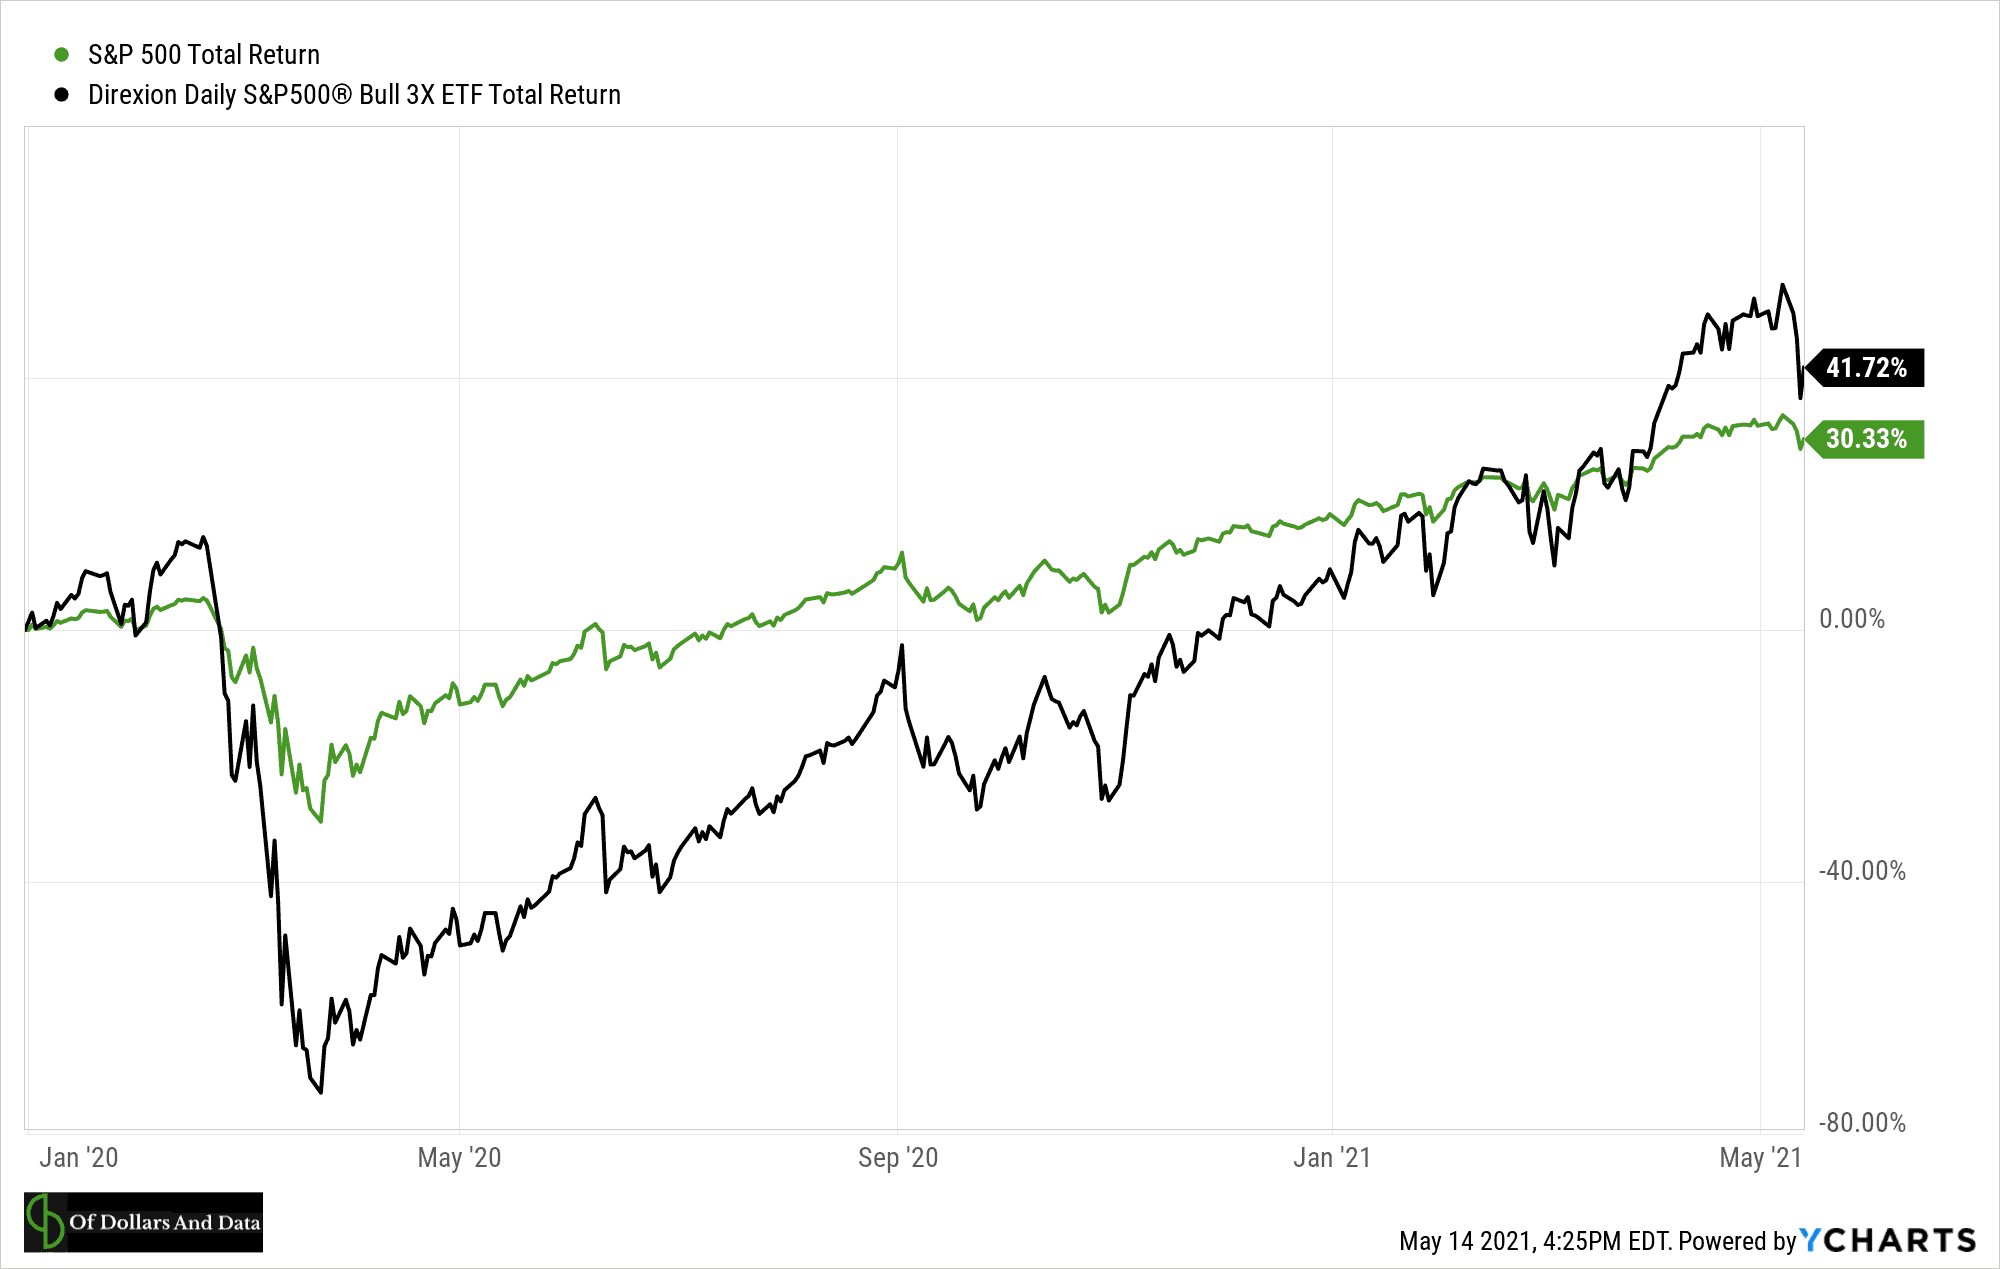
This simple example illustrates both the risk and the reward of investing in leveraged index funds/ETFs. While they can boost your returns when times are good, they can similarly demolish them when things go bad.
Assuming you can handle this level of volatility, are leveraged index funds still worth it?
The answer depends on your time horizon and how lucky you feel.
How Much Does a Leveraged Portfolio Outperform?
To test this I looked at the daily returns of the Dow Jones Industrial Average going back to 1915 and simulated how a 2x and 3x leveraged fund would have performed over rolling 10 year period. I did this by comparing the performance of the 2x and 3x leveraged funds (net of fund fees) to the performance of the underlying index.
If you were to do this for every rolling 10-year period and then plot the average annualized outperformance of the 2x and 3x leveraged funds, you would see the following:
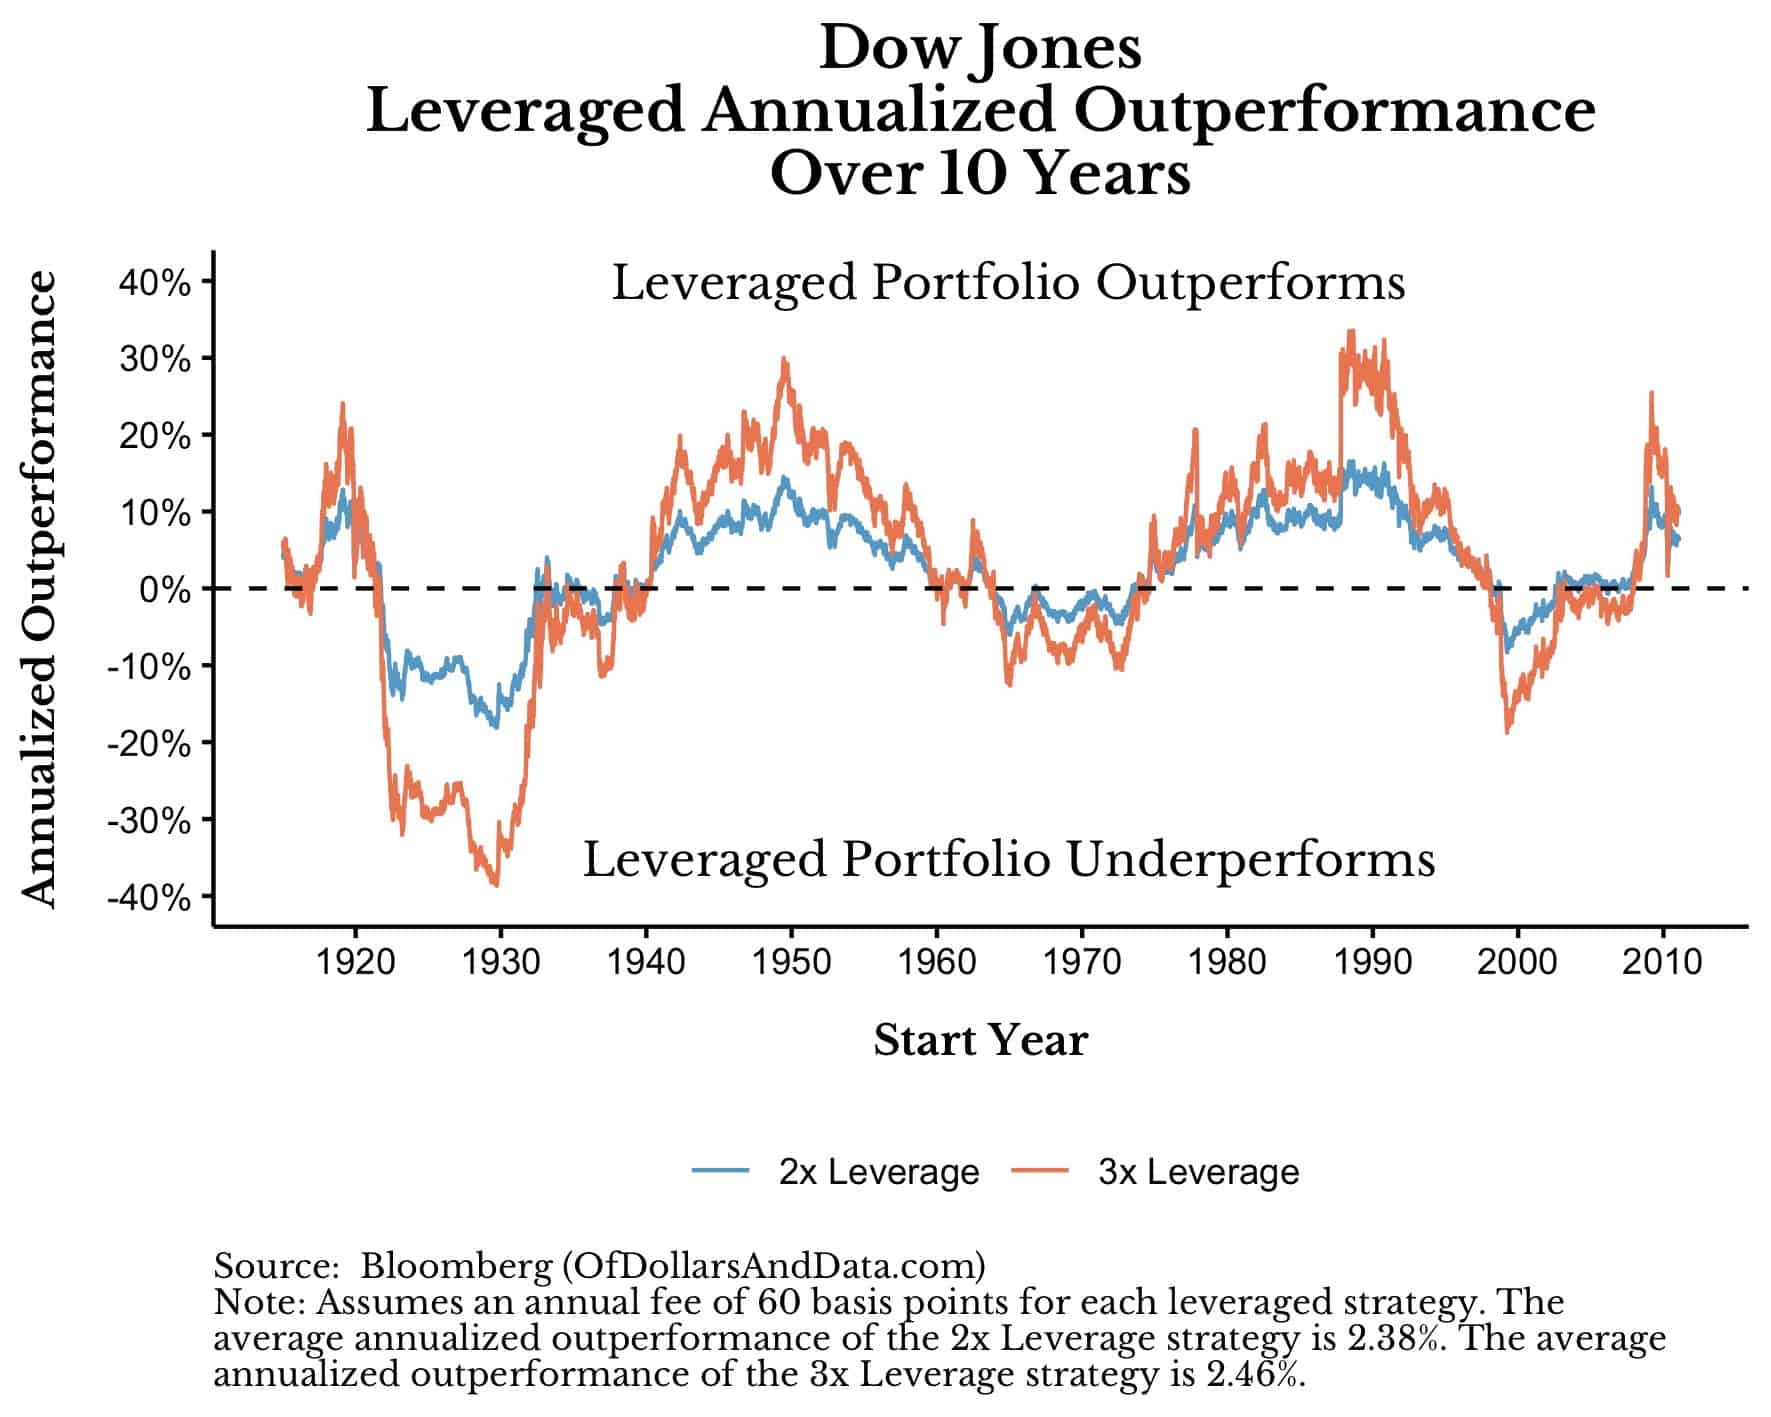
While it might be hard to tell from this image, both the 2x and 3x leveraged strategies outperform annually by about 2.4% on average over this time period. However, as you can see, there is a lot of variance around this level of outperformance.
For example, if you invested in a leveraged fund in the mid-1920s, the mid-1960s, or the late 1990s, you would have underperformed the index over the next decade, sometimes significantly so. Why is this the case? Because these three periods correspond with the worst bear markets in U.S. history (1930s, 1970s, and 2000s). Therefore, by investing in a leveraged fund during these time periods, you would have magnified the negative compounding that took place.
Given this information, the decision of whether to invest in a leveraged index fund comes down to: will I experience a bear market in the near future?
Of course, we cannot know the future so this question, ultimately, isn’t that useful. But, what if we invested over a longer time period? Would that help our overall performance?
What If We Invested in a Leveraged Fund for 20 Years (or more)?
By extending how long we invest into a leveraged fund, we can get more of the upside that U.S. stocks deliver. In theory, this should help us offset the periodic bear markets that destroy wealth. Unfortunately, if we repeat the analysis above over a 20-year time frame, we still see lots of variance in the long-term outcomes:
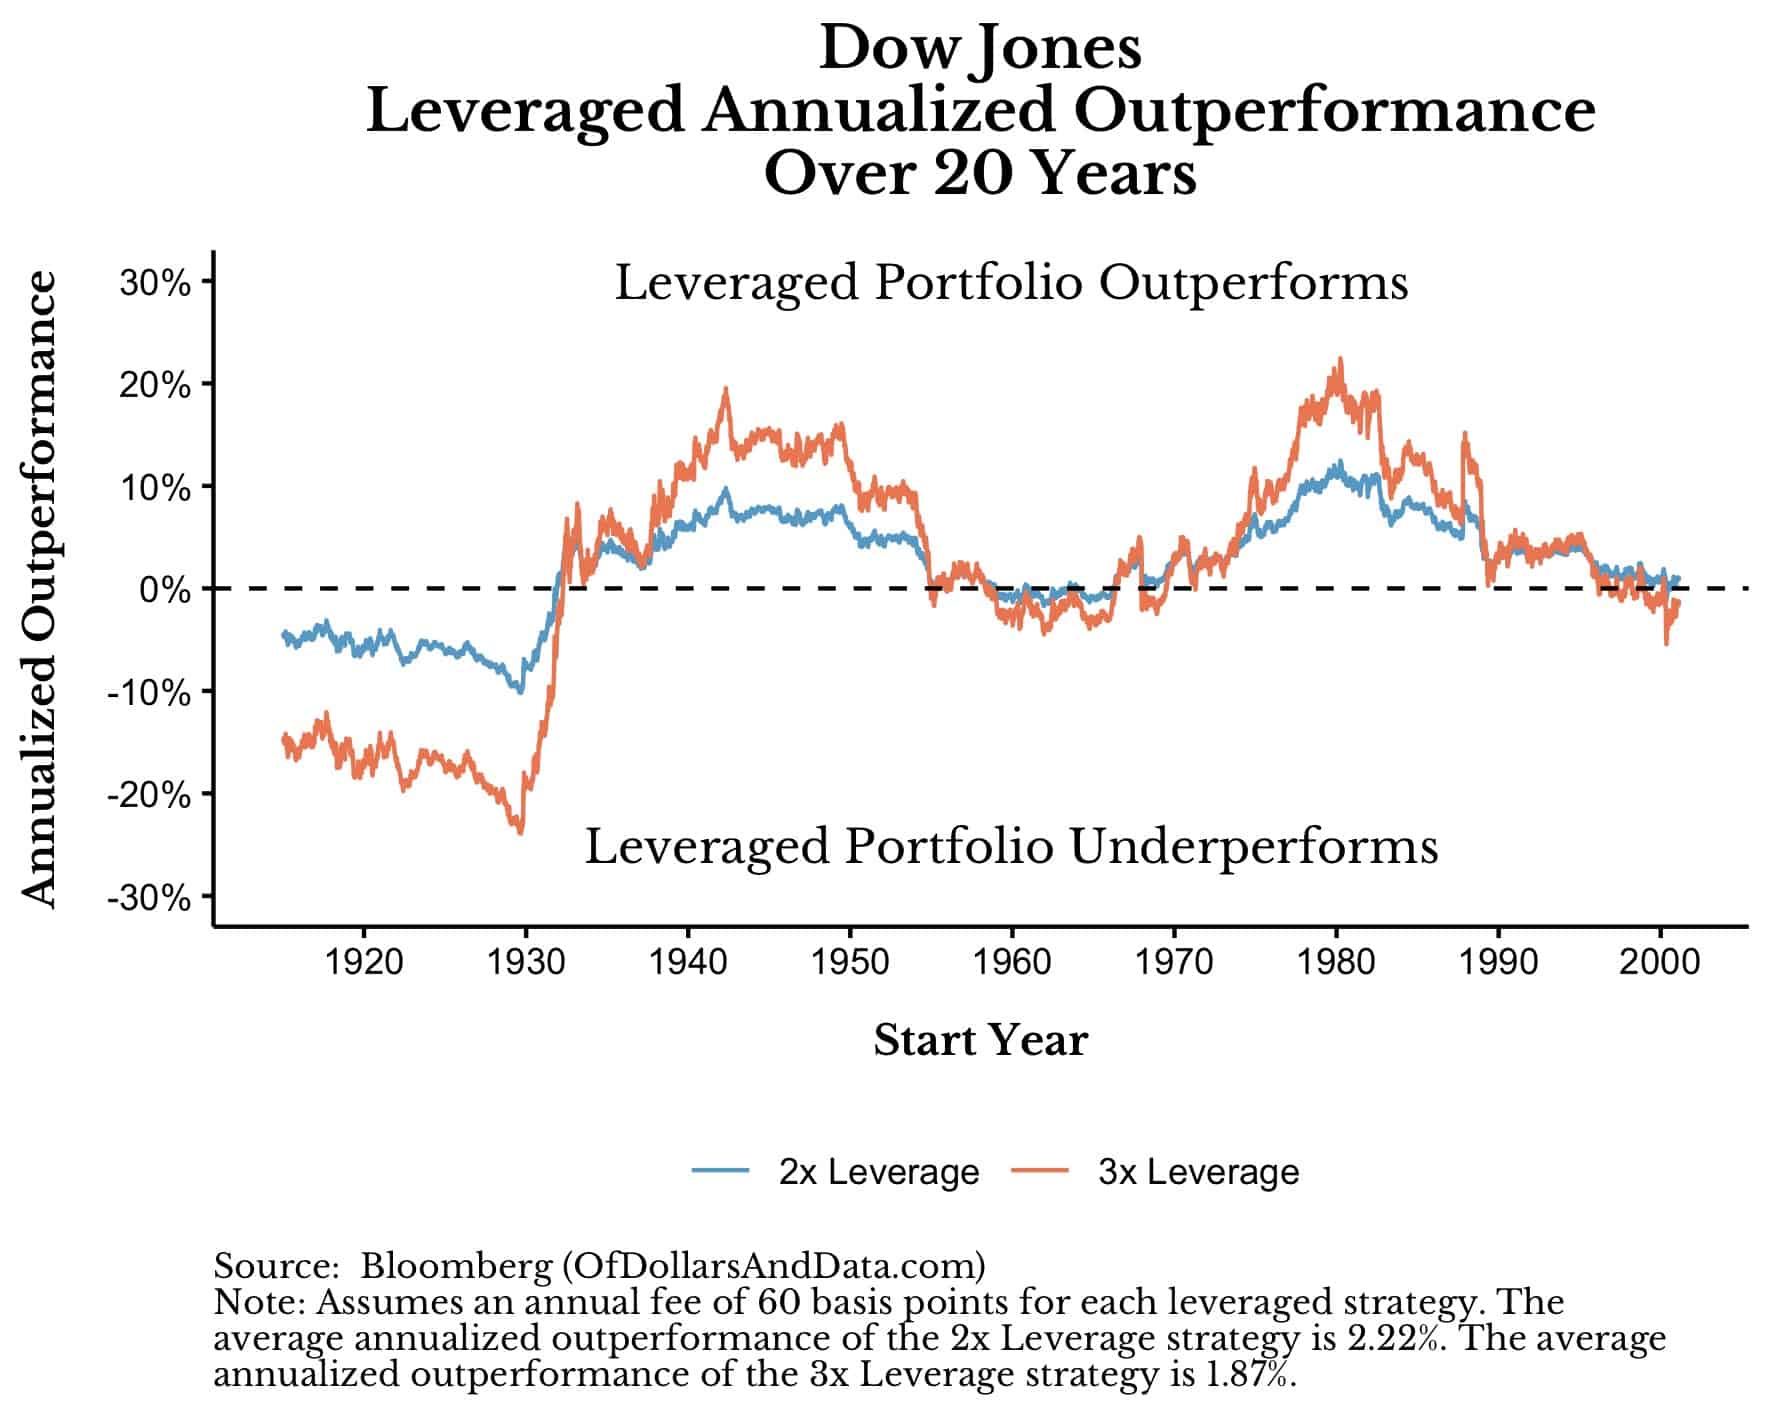
In this case, the average outperformance for both leveraged funds has dropped to about 2% (down from 2.4%) and there are still three periods of underperformance. These three periods correspond with the three U.S. bear markets mentioned earlier (1930s, 1970s, 2000s). So, even over 20 years there is no guarantee that investing in a leveraged fund will save you. But, what about over 30 years? Would that help?
Somewhat.
If we were to do extend this analysis to 30 years, then the numbers become a bit more favorable:
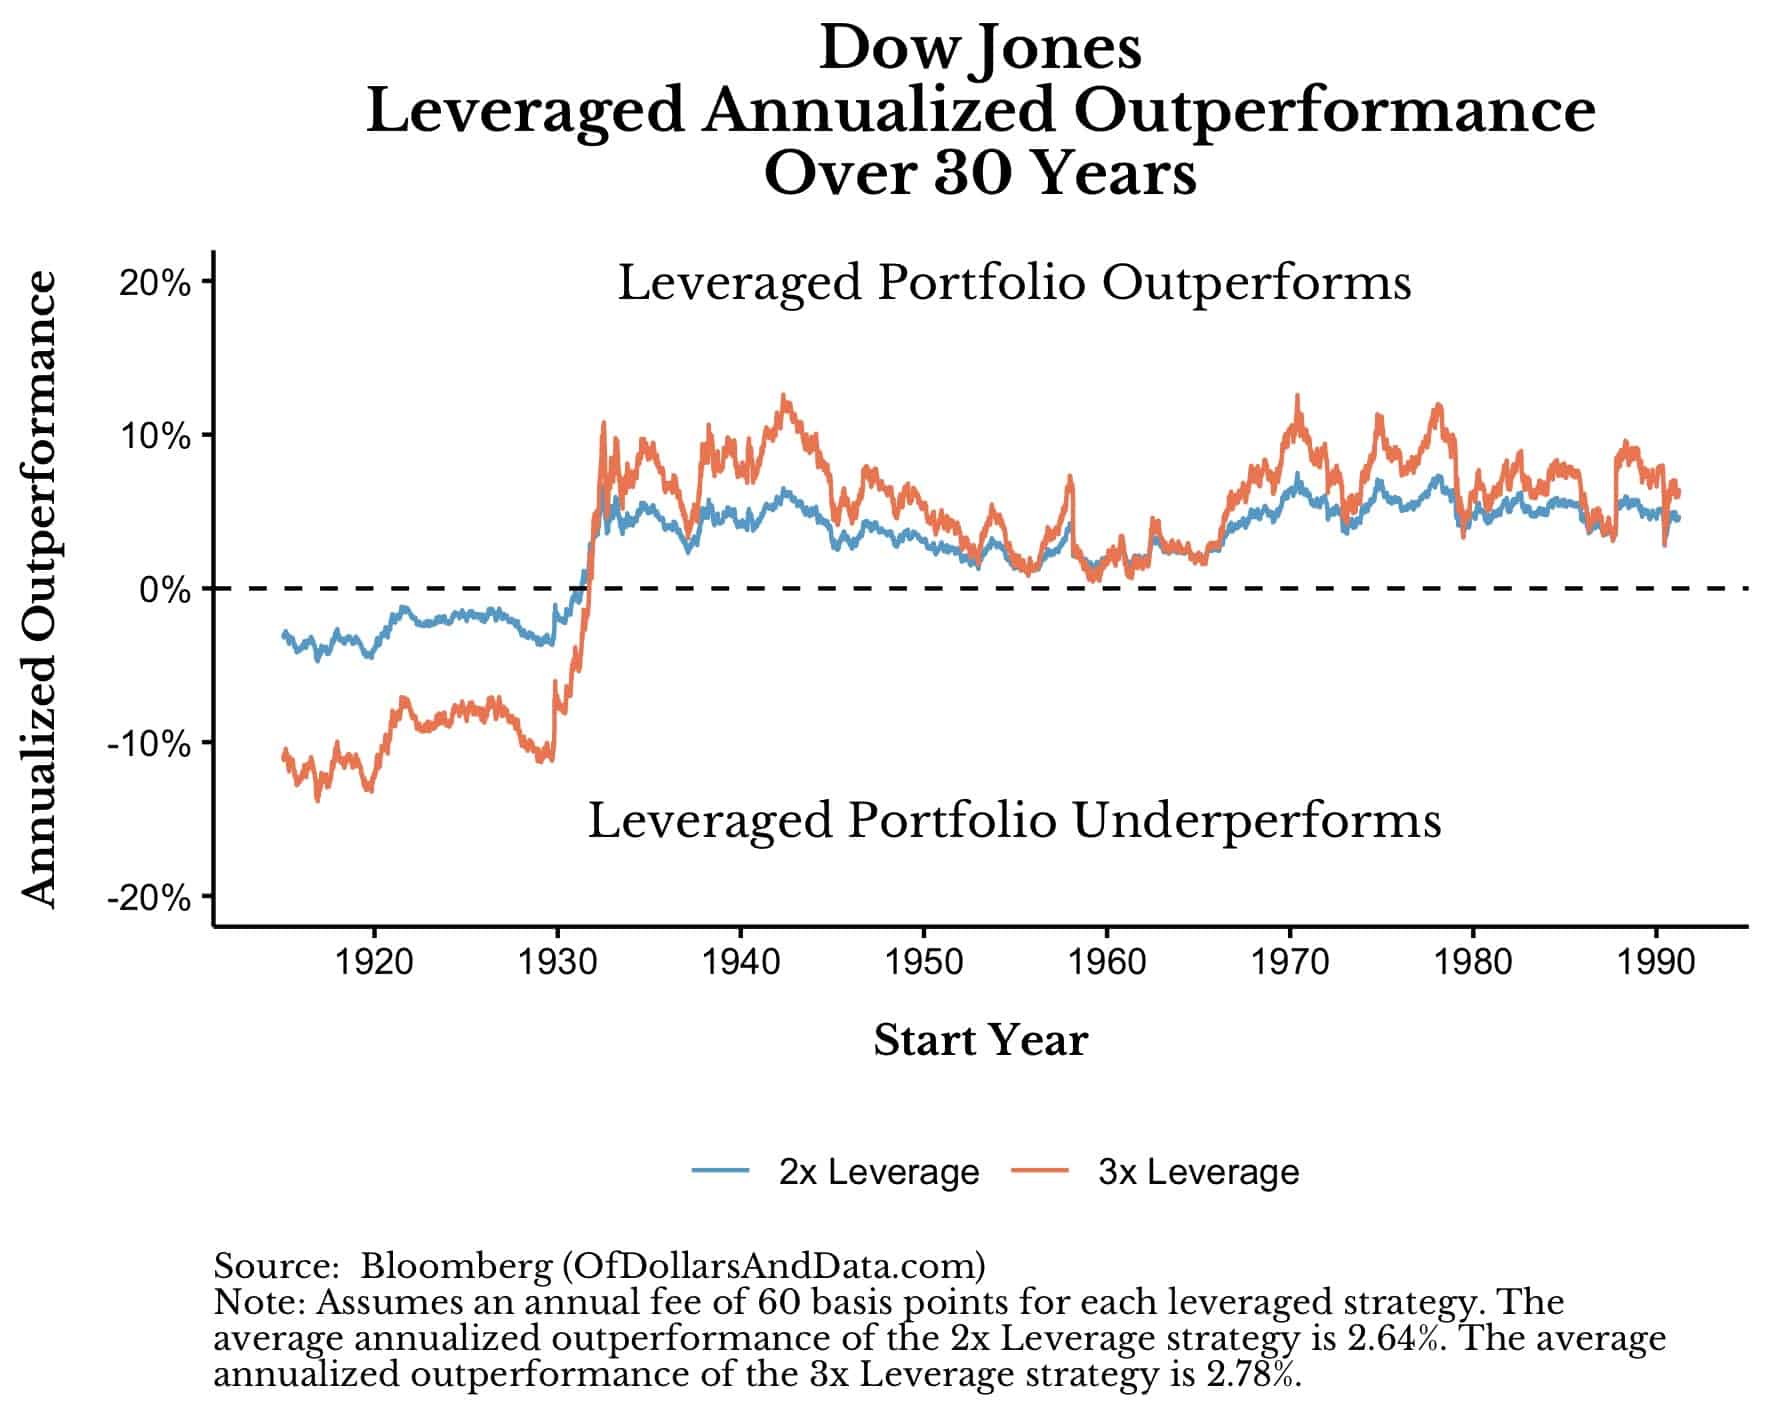
Now the average annual outperformance of the 2x and 3x leveraged strategies is 2.6% and 2.8%, respectively. While this might not seem like a lot, over 30 years it adds up. In fact, outperforming the index by 2.6% a year would give you over twice as much money after 30 years.
Once again, not all 30-year periods provide the same level of outperformance. As you can see in the plot above, most of the time you would have outperformed by 5%-10% a year over three decades. However, the elephant in the room is still there—the Great Depression. During the Great Depression you would have seen your wealth utterly destroyed, even if you held for a long time.
From these facts, we can arrive at some definitive conclusions about investing in leveraged index funds.
What’s a Leveraged Investor To Do?
Given the analysis above, there are three key takeaways for leveraged index fund/ETF investors:
- If you lose money in a leveraged index fund, you probably just need to hold on longer until you earn your money back.
- Point (1) doesn’t hold if you go through a Great Depression-like scenario. If markets decline too much, you will get destroyed and there is nothing you can do about it.
- The upside of investing in a 3x leveraged fund (compared to a 2x leveraged fund) doesn’t seem to be worth the downside.
In other words, investing in leveraged index funds only works if you don’t experience the extreme left tail of negative returns.
More importantly, my analysis hasn’t adjusted for changes in borrowing costs over time. As money becomes more expensive to borrow, your annual outperformance will decline significantly from what I have shown above.
In full, if you can invest for a long time while avoiding the absolute worst market declines, then you can thrive as a leveraged investor. If not, then you shouldn’t even bother. Of course, no one knows when the next Great Depression-like decline will occur. At the end of the day, you have to be lucky.
Thank you for reading!
If you liked this post, consider signing up for my newsletter.
This is post 242. Any code I have related to this post can be found here with the same numbering: https://github.com/nmaggiulli/of-dollars-and-data

