With the U.S. stock market hitting four new all-time highs last week, the question on many investors’ minds is, “Is now a good time to buy stocks?”
I understand the sentiment. Buying near all-time highs feels like a bad decision because you know you aren’t necessarily getting a bargain. Compare this to investing when markets are 20% off their highs. In that scenario, you will, at a minimum, earn 25% if the market eventually recovers its old highs.
Unfortunately, the difficulty in these decisions lies in not knowing the future. You could avoid buying near all-time highs and the market doesn’t have a major crash for a decade. On the other hand, you could buy when markets are 20% off their highs only to see them go 30% off their highs (or more) in the future.
But what does the data say about buying near all-time highs? Are they bullish or do they not matter at all?
Though I’ve written on this topic previously, I’ve decided to take another look at investing near all-time highs to determine whether it might actually make a difference in your investment strategy. Let’s dig in.
How Often Do Stock Markets Reach All-Time Highs?
Though stock markets around the globe tend to trend upward over long periods of time, even the best performing ones only hit all-time highs on rare occasions. For example, going back to 1915, the Dow Jones Industrial Average has only hit all-time highs on 1 in 20 (5%) of all trading days.
You can see this more clearly in the plot below which shows the index value (price only) of the Dow Jones Industrial Average going back to 1915, along with every time the index hit an all-time high (in red):
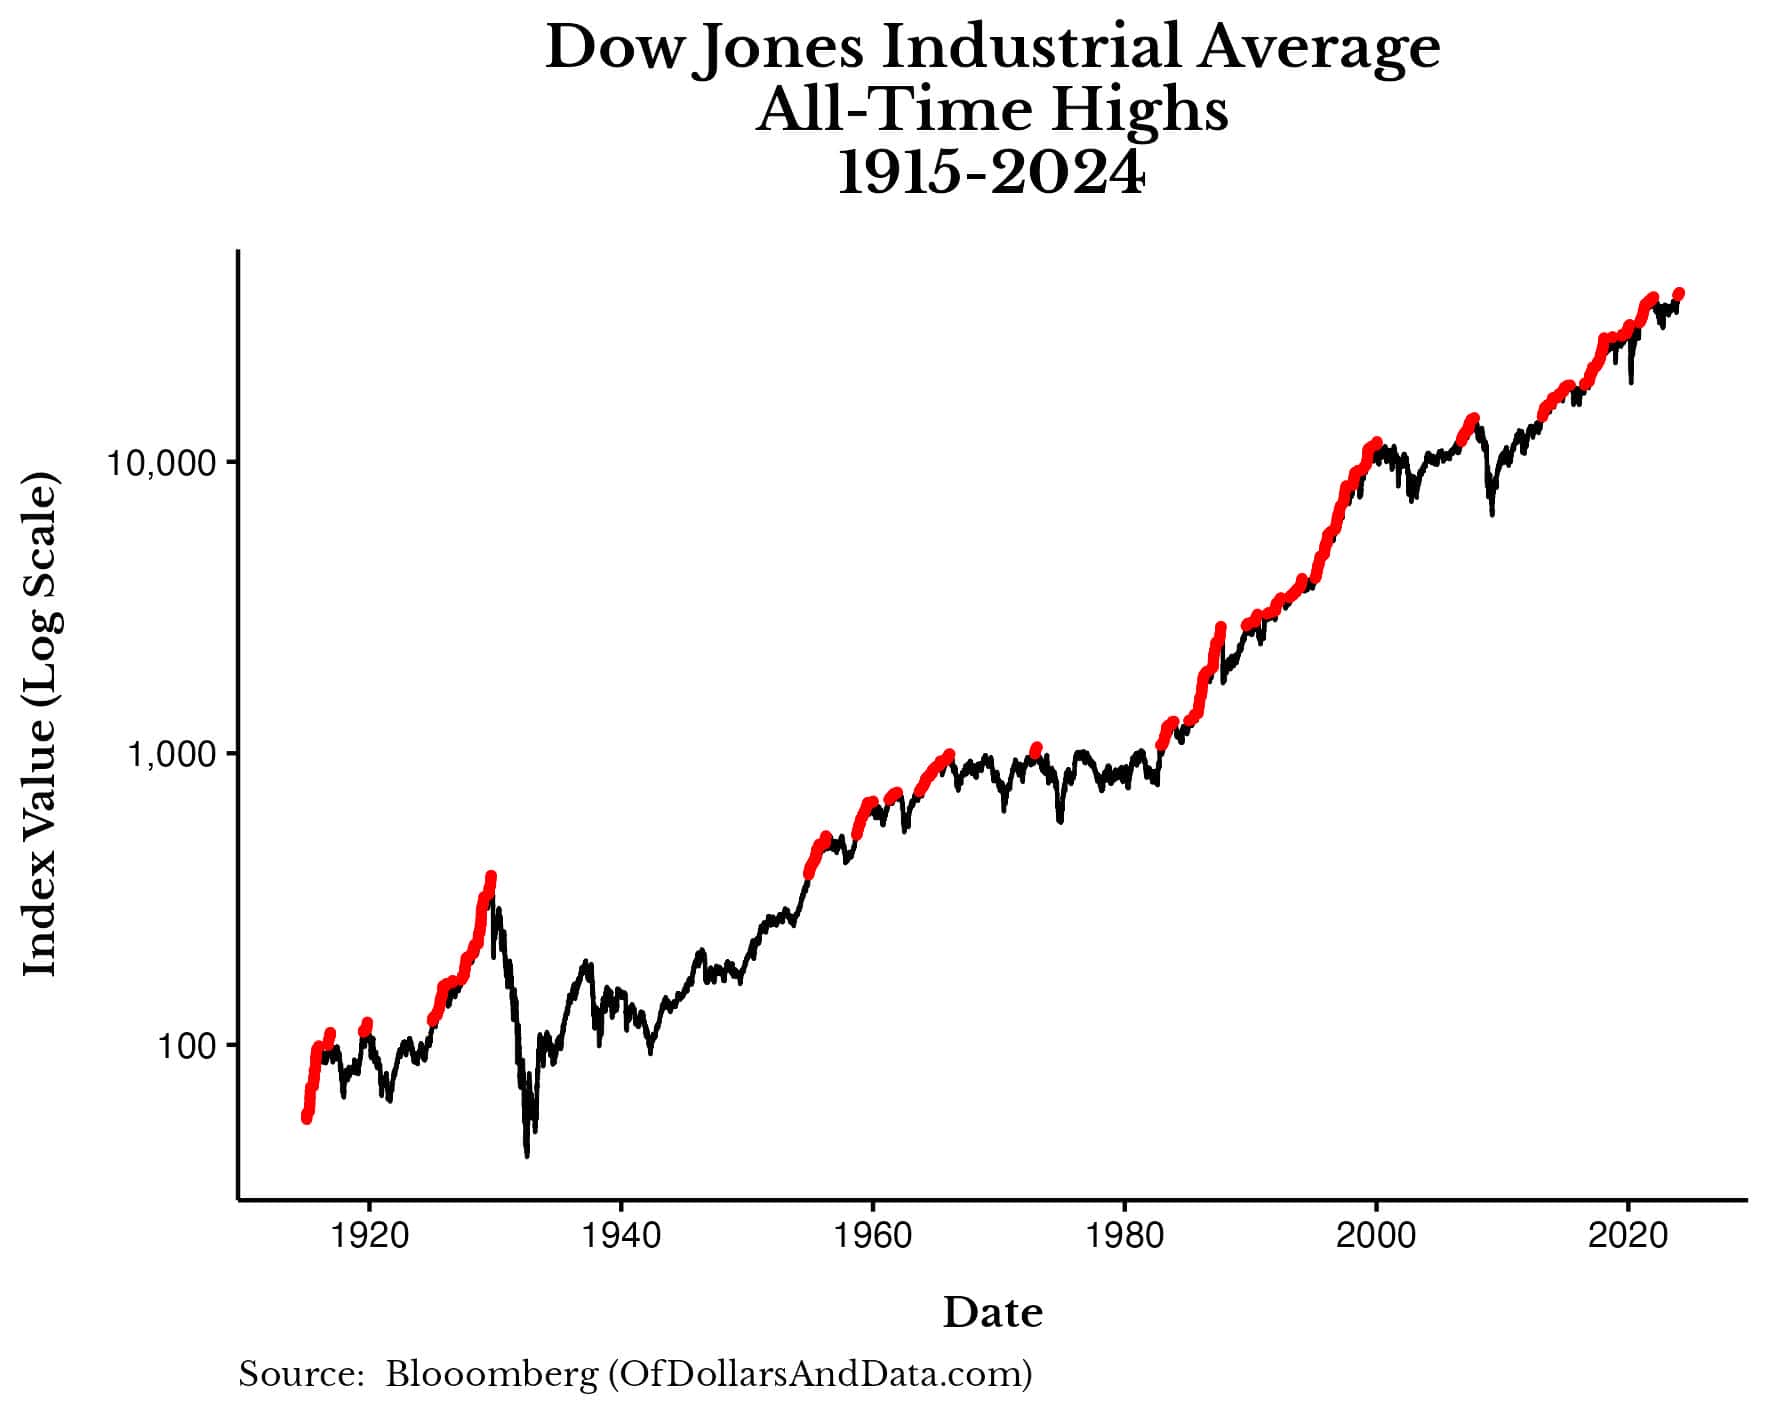
Looking at this, you can see that all-time highs tend to cluster—there are long periods of time where all-time highs are followed by all-time highs. However, there are also long periods of time without any all-time highs at all. Most notable among these are The Great Depression in the 1930s and most of the 1970s.
Technically, this plot does not include dividends or adjustments for inflation, which can significantly impact your performance. For example, while the Great Depression looks particularly scary in the plot above, if you had included dividends and adjusted for the deflation that occurred in the 1930s, your portfolio would’ve hit a new all-time highs in the late 1930s, not in the 1960s (as shown above).
Either way, all-time highs are not the norm in markets. Even when we look at prices on a monthly level (instead of a daily level), they only reach new highs about one-third of the time.
For example, going back to the beginning of 1970, U.S. stocks hit all-time highs in about 33% of all months (including dividends, but not adjusting for inflation). The same is more or less true for global stocks, which hit new all-time highs in about 30% of all months over the same time period:
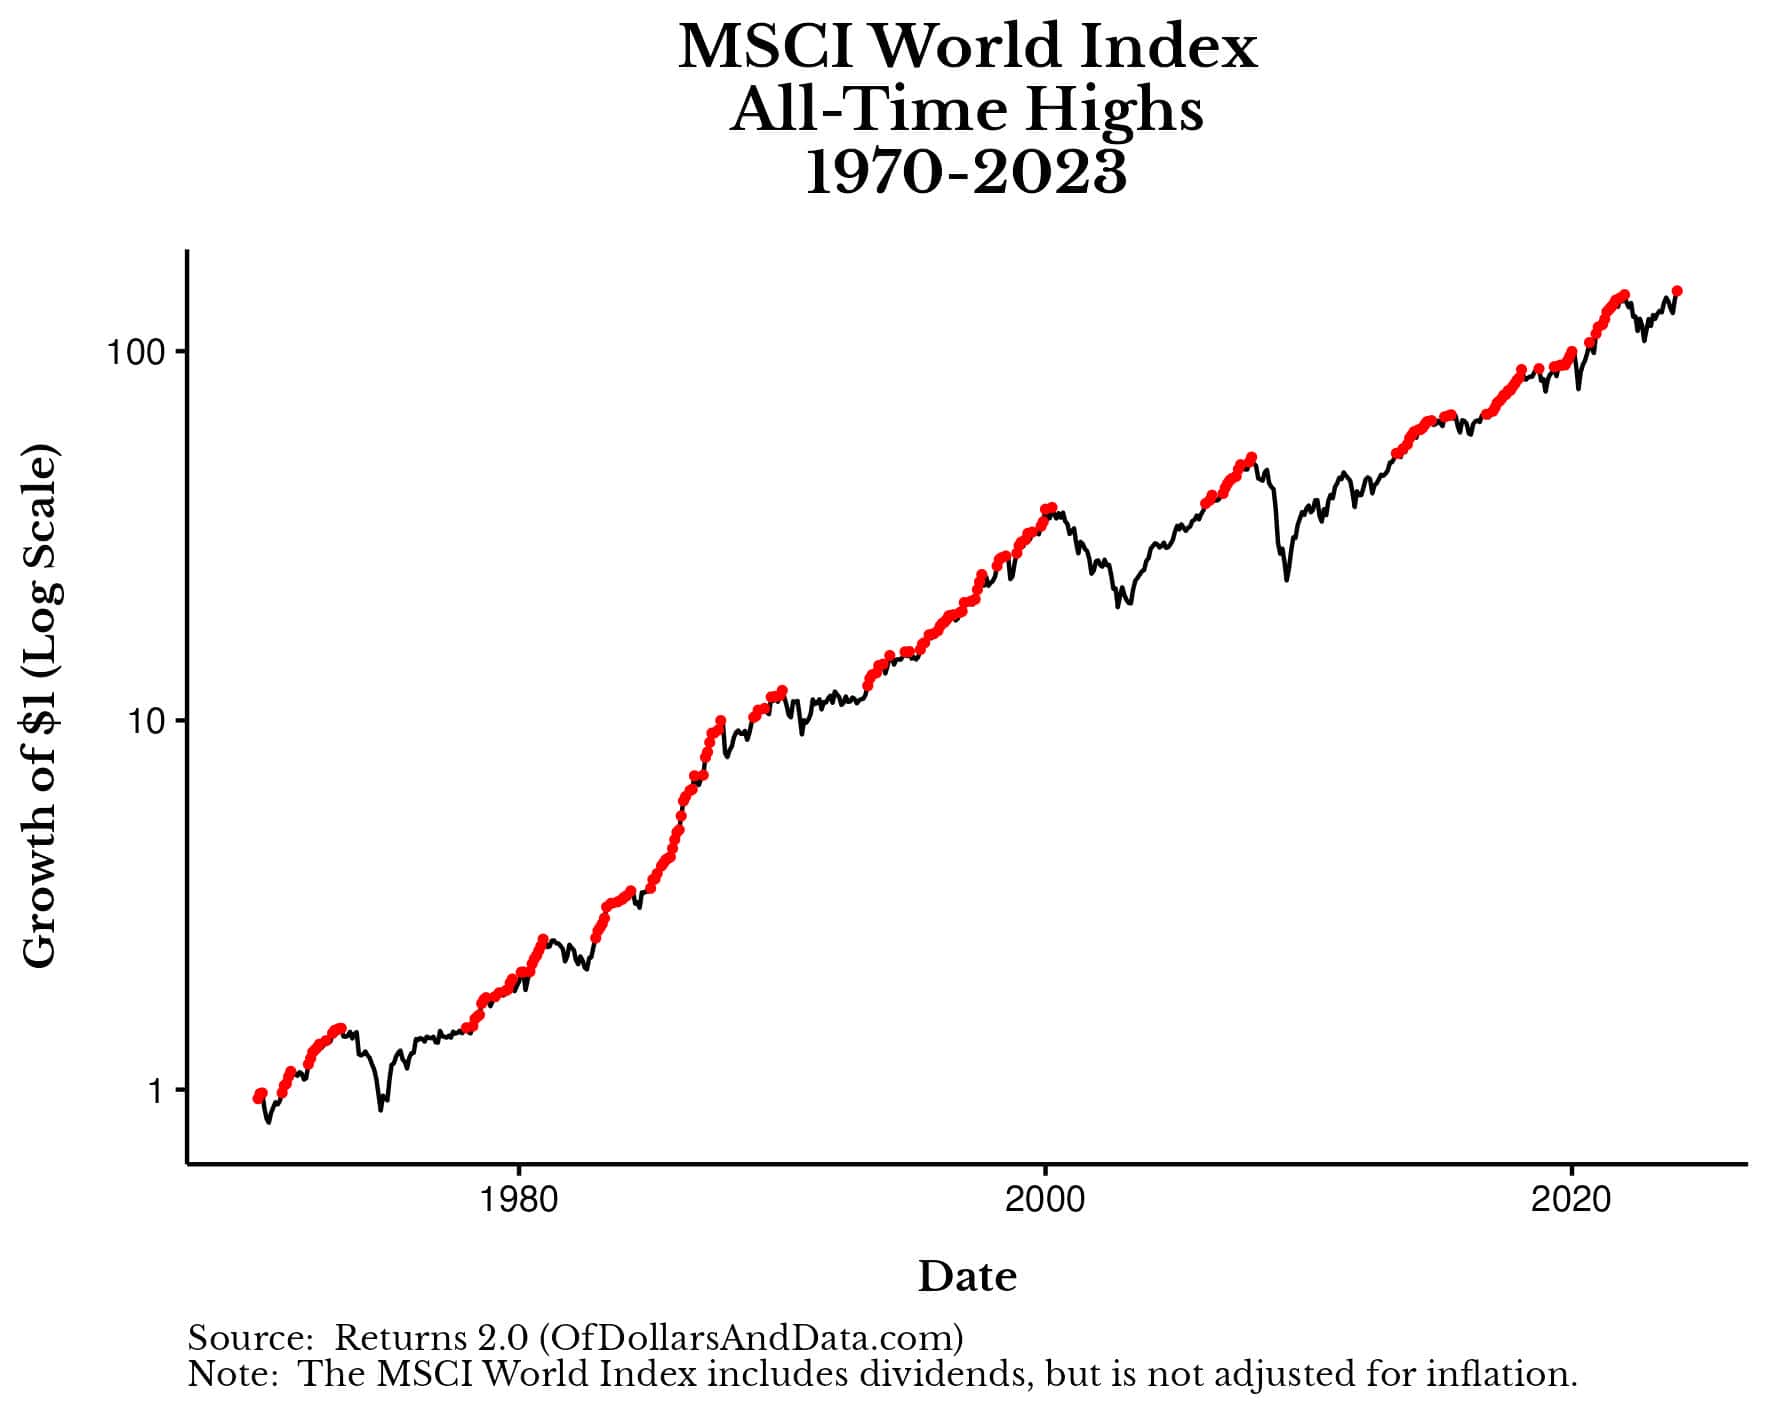
As you can see, at the monthly level for global stocks, all-time highs also tend to cluster and be followed by more all-time highs. However, this doesn’t hold forever, as markets will eventually pullback.
Now that we’ve reviewed how often equity markets reach new all time highs, let’s quantify how they tend to perform after doing so.
How Do Stocks Perform After Hitting an All-Time High?
If we were to examine how equities perform after hitting all-time highs, the results would depend on which market we were looking at and for what time horizon.
For example, if we look at the return over the next 1, 5, and 10-years following an all-time high using the daily Dow data back to 1915, we would see that 1-year average returns are a bit higher after an all-time, but 5-year and 10-year returns are considerably lower after an all-time high compared to all other days:
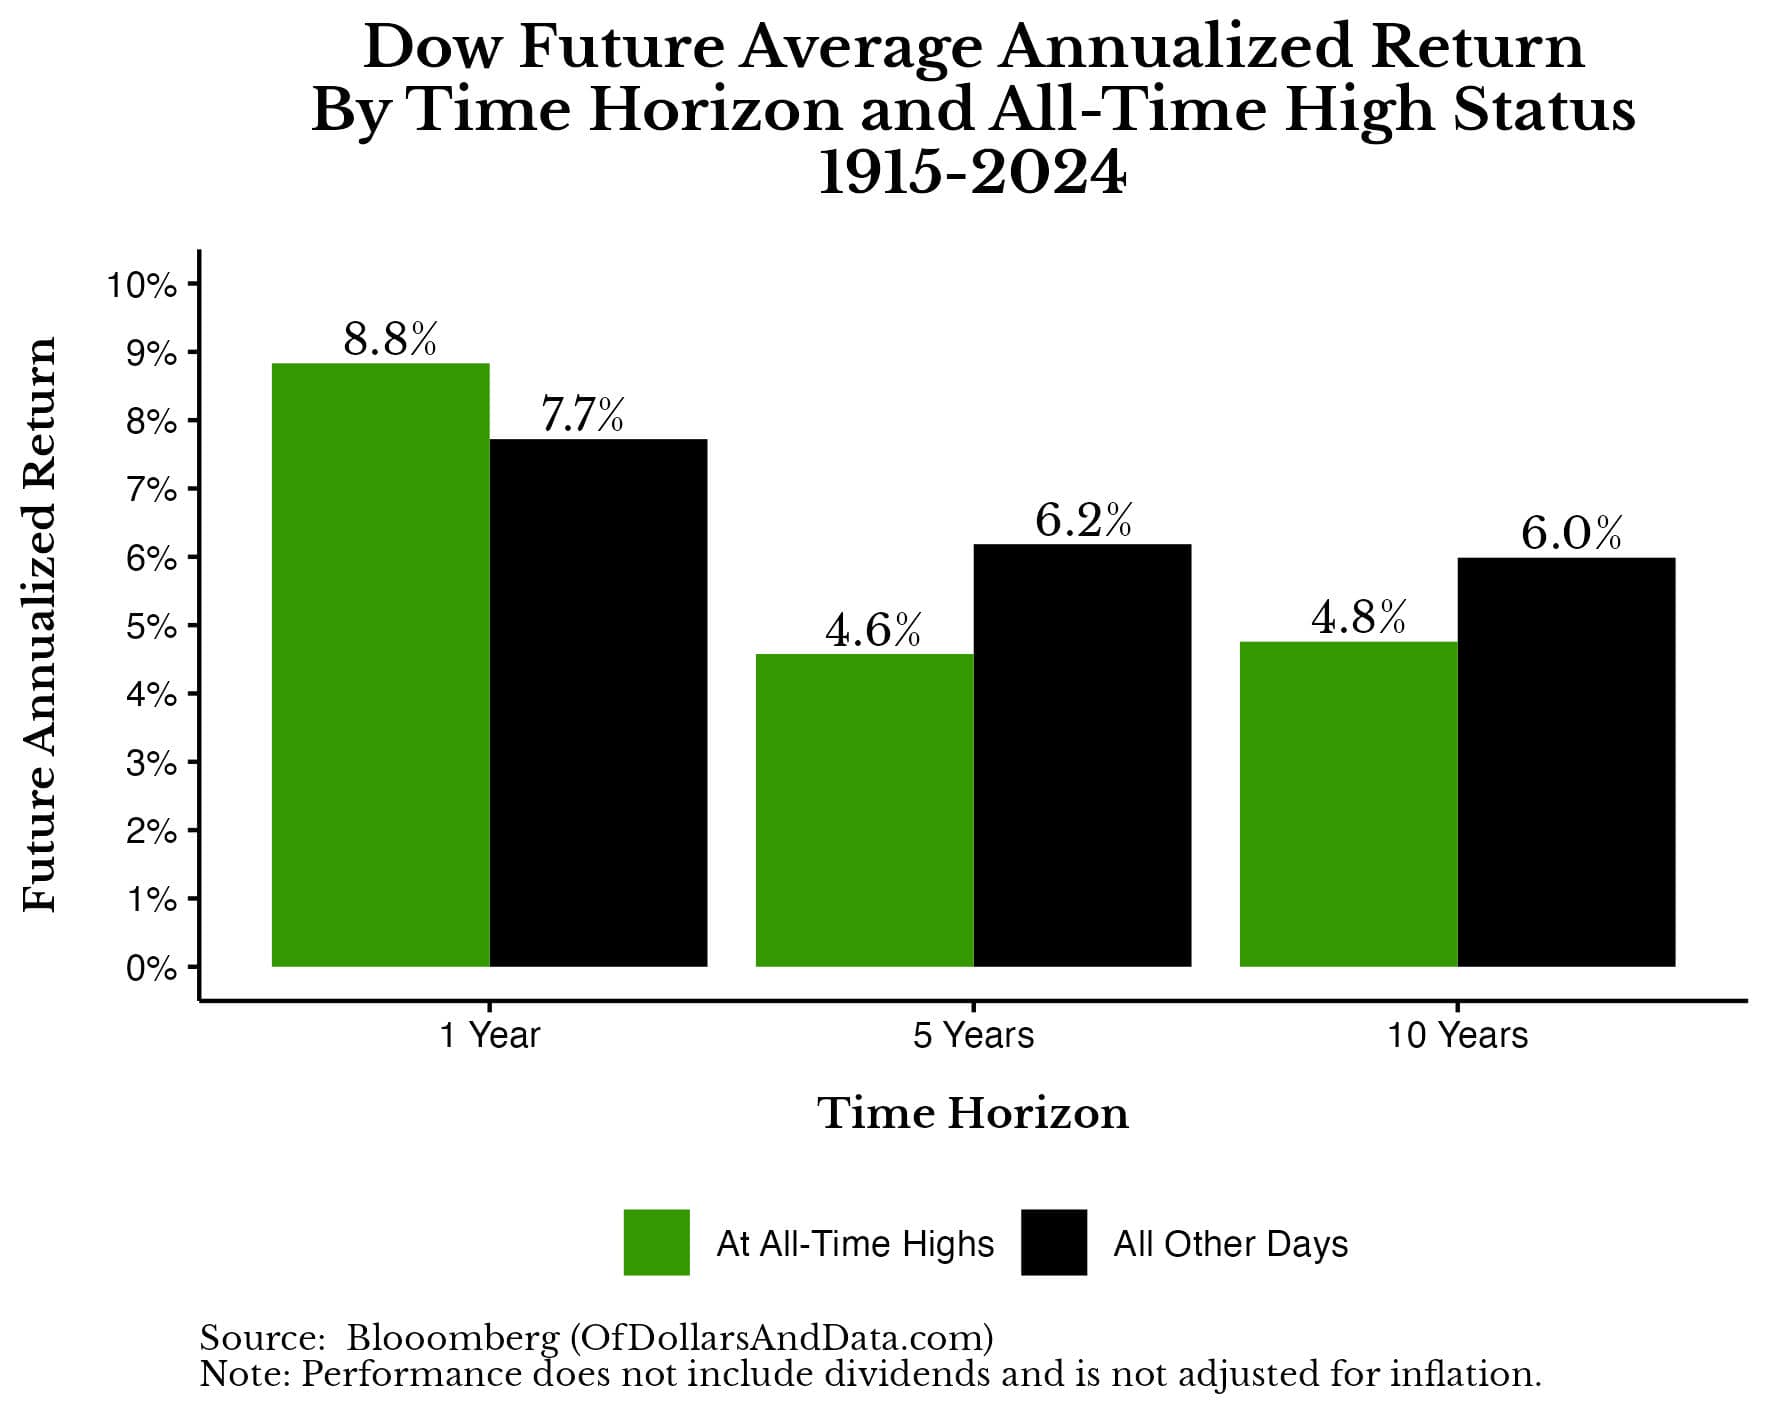
This plot suggests that any benefits that U.S. stocks see from all-time highs are short-lived as they tend to pullback (at some point) over longer periods of time.
More importantly, these differences in returns are unlikely to be the result of chance alone. When I tested the difference in future returns between all-time high days and all other days (using a t-test), the results were significant at the 5% significance level for all time horizons (1-year, 5-year, and 10-year).
If we were to look at monthly data for U.S. stocks (S&P 500) starting in 1970, we would see that the 1-year and 5-year returns were higher following an all-time high, but 10-year returns were lower:
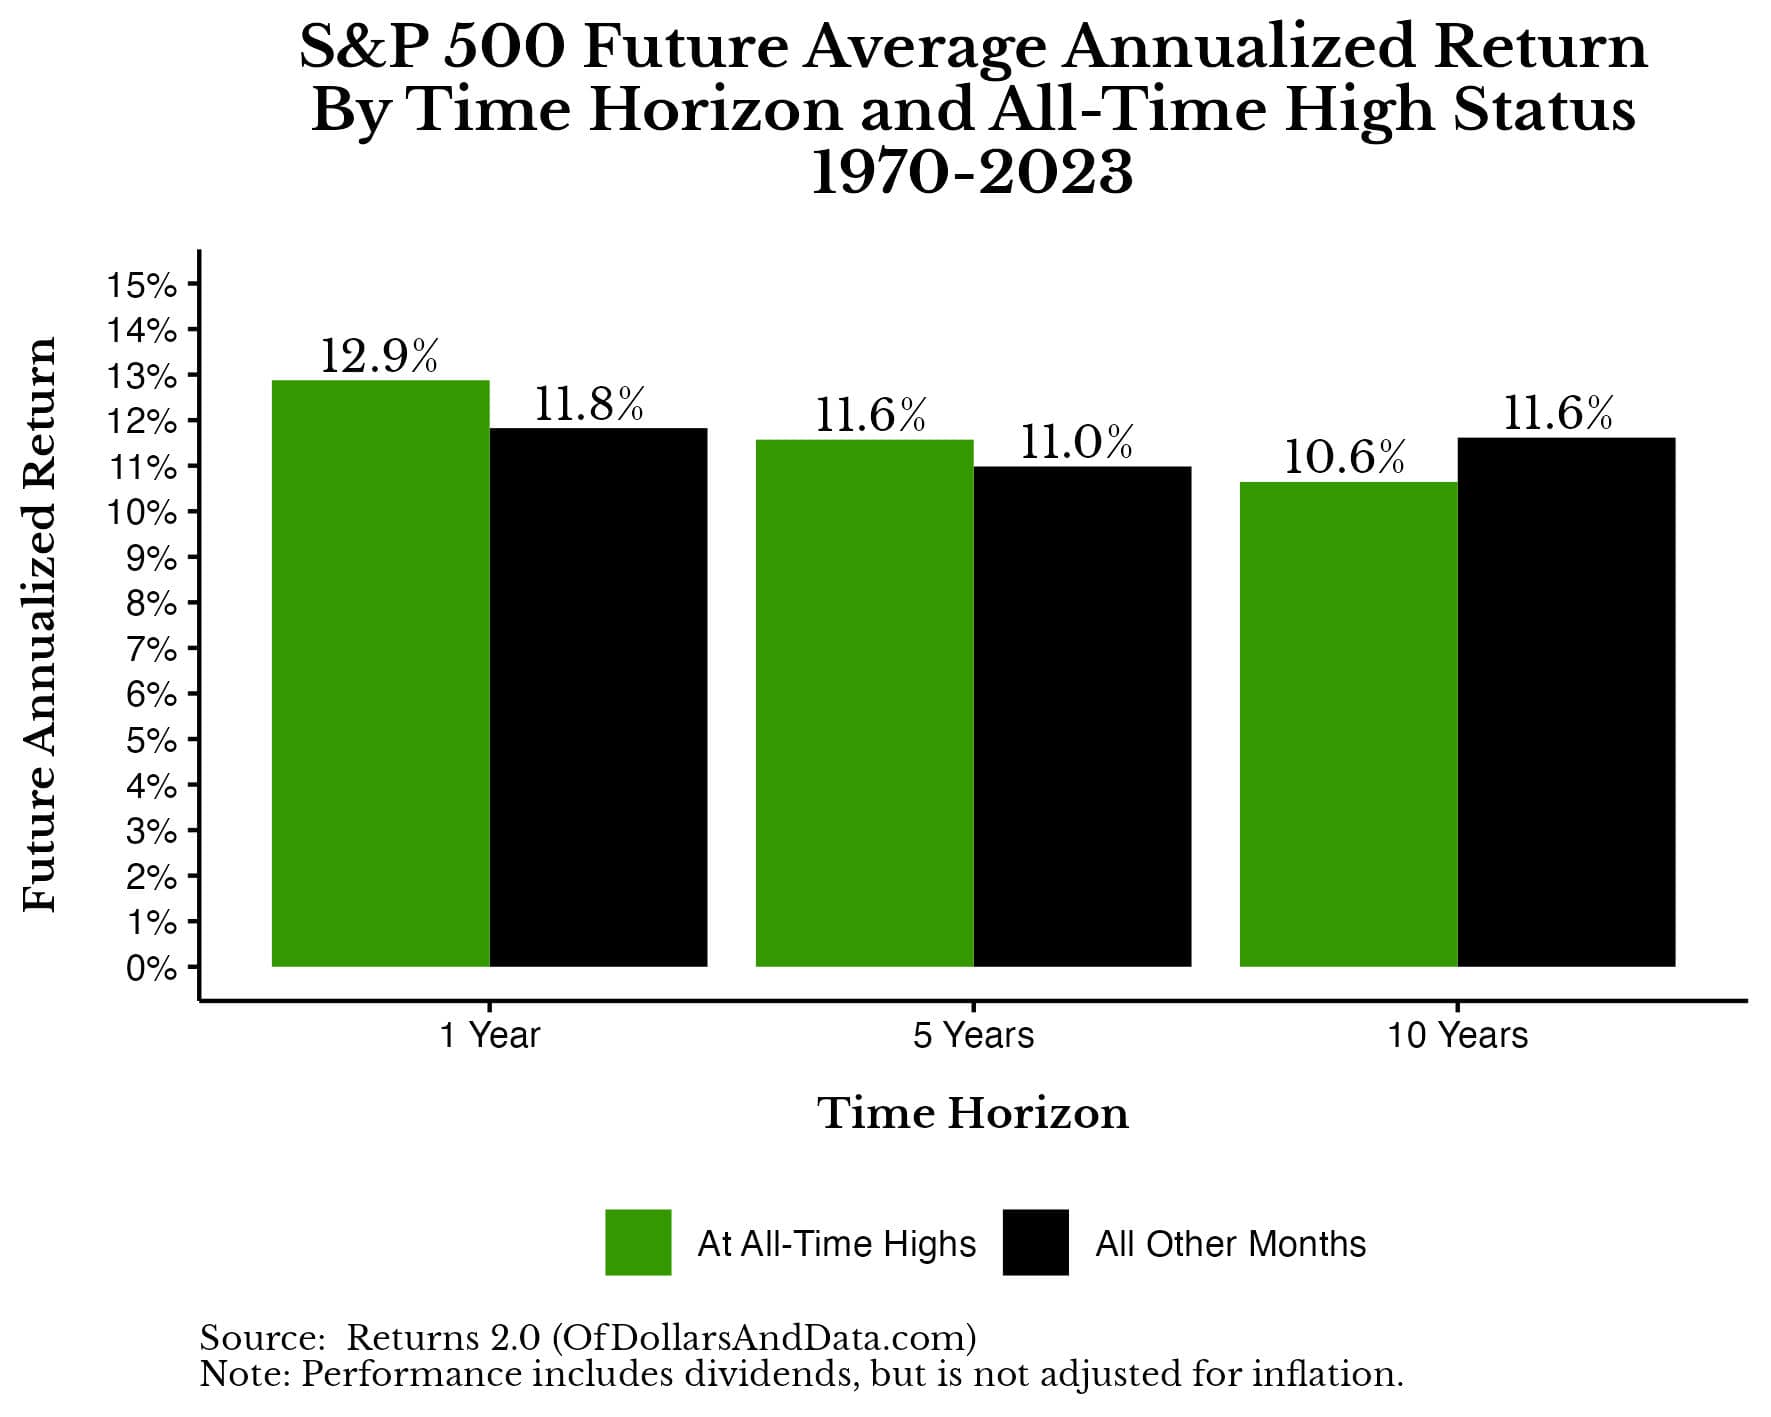
Once again, over shorter time horizons all-time highs tend to be a good thing, but over longer time horizons, less so. However, when I tested these differences in returns for statistical significance only the difference in 10-year returns was significant at the 5% level.
Lastly, I did the same comparison for Global stocks using the MSCI World Index and found a similar pattern—higher initial performance after an all-time high followed by a pullback in performance over longer time periods:
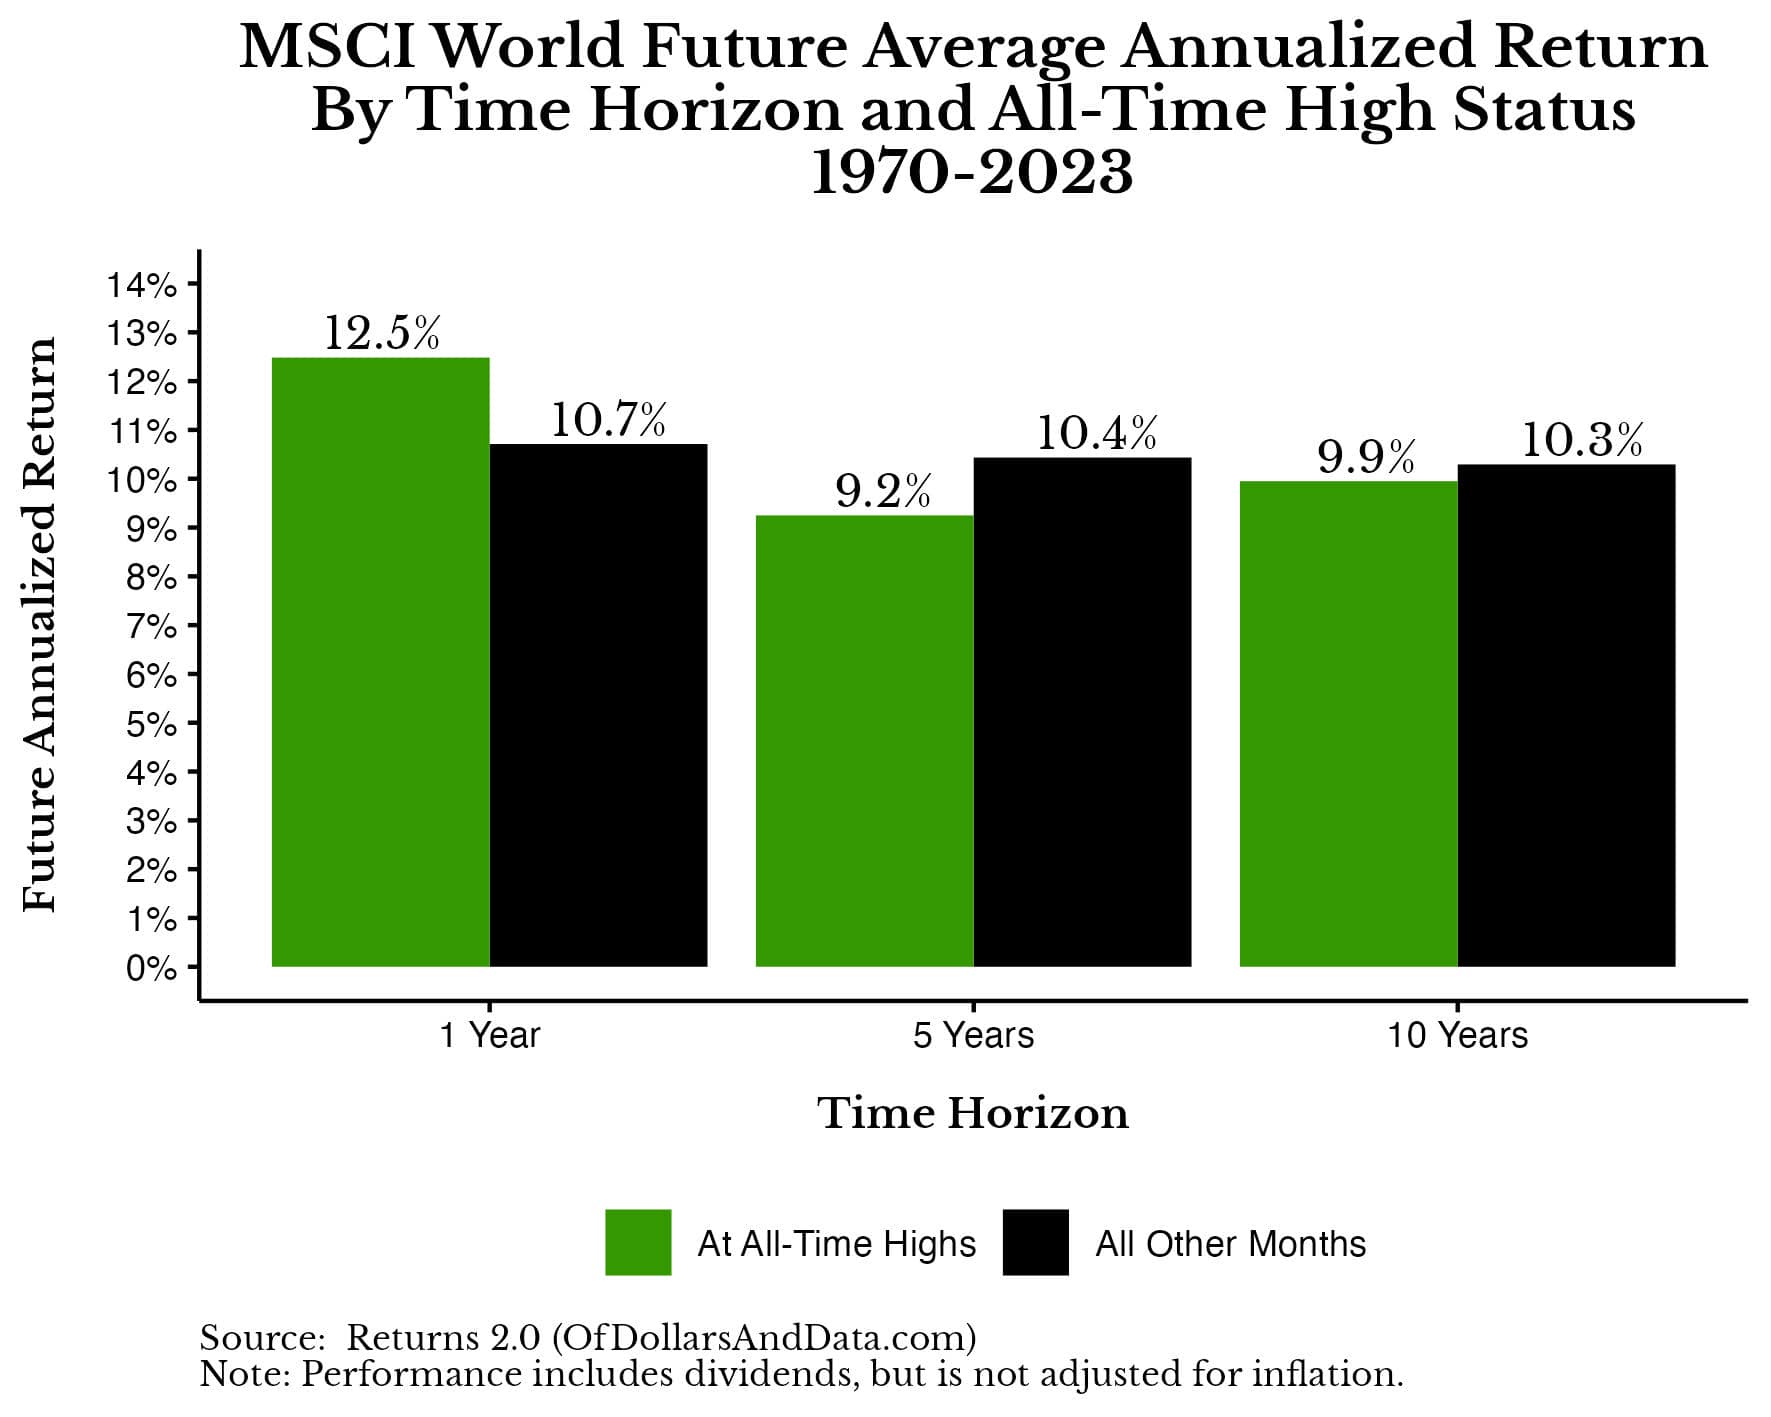
However, when it comes to global stocks, none of the differences in returns shown above are significant at the 5% level. This means that the difference in returns following an all-time high could be the result of chance alone.
Now that we know that stocks tend to outperform in the short-run following all-time highs, but less so in the long run, is there a way we could profit off of this? Let’s look at a strategy that was proposed in recent years.
Is There a Profitable All-Time High Trading Strategy?
Back in 2019, Jake (Econompic) tweeted about a strategy where you would own global stocks in the month following an all-time high, and own U.S. bonds in any other months. This simple strategy would’ve outperformed Buy & Hold (for a 100% global stock portfolio) going back to 1970.
I tested this strategy myself and found the same results…until recently.
As you can see in the plot below, this strategy of only investing in global stocks following all-time highs would’ve worked from 1970 through 2021 and then it would have started to underperform:
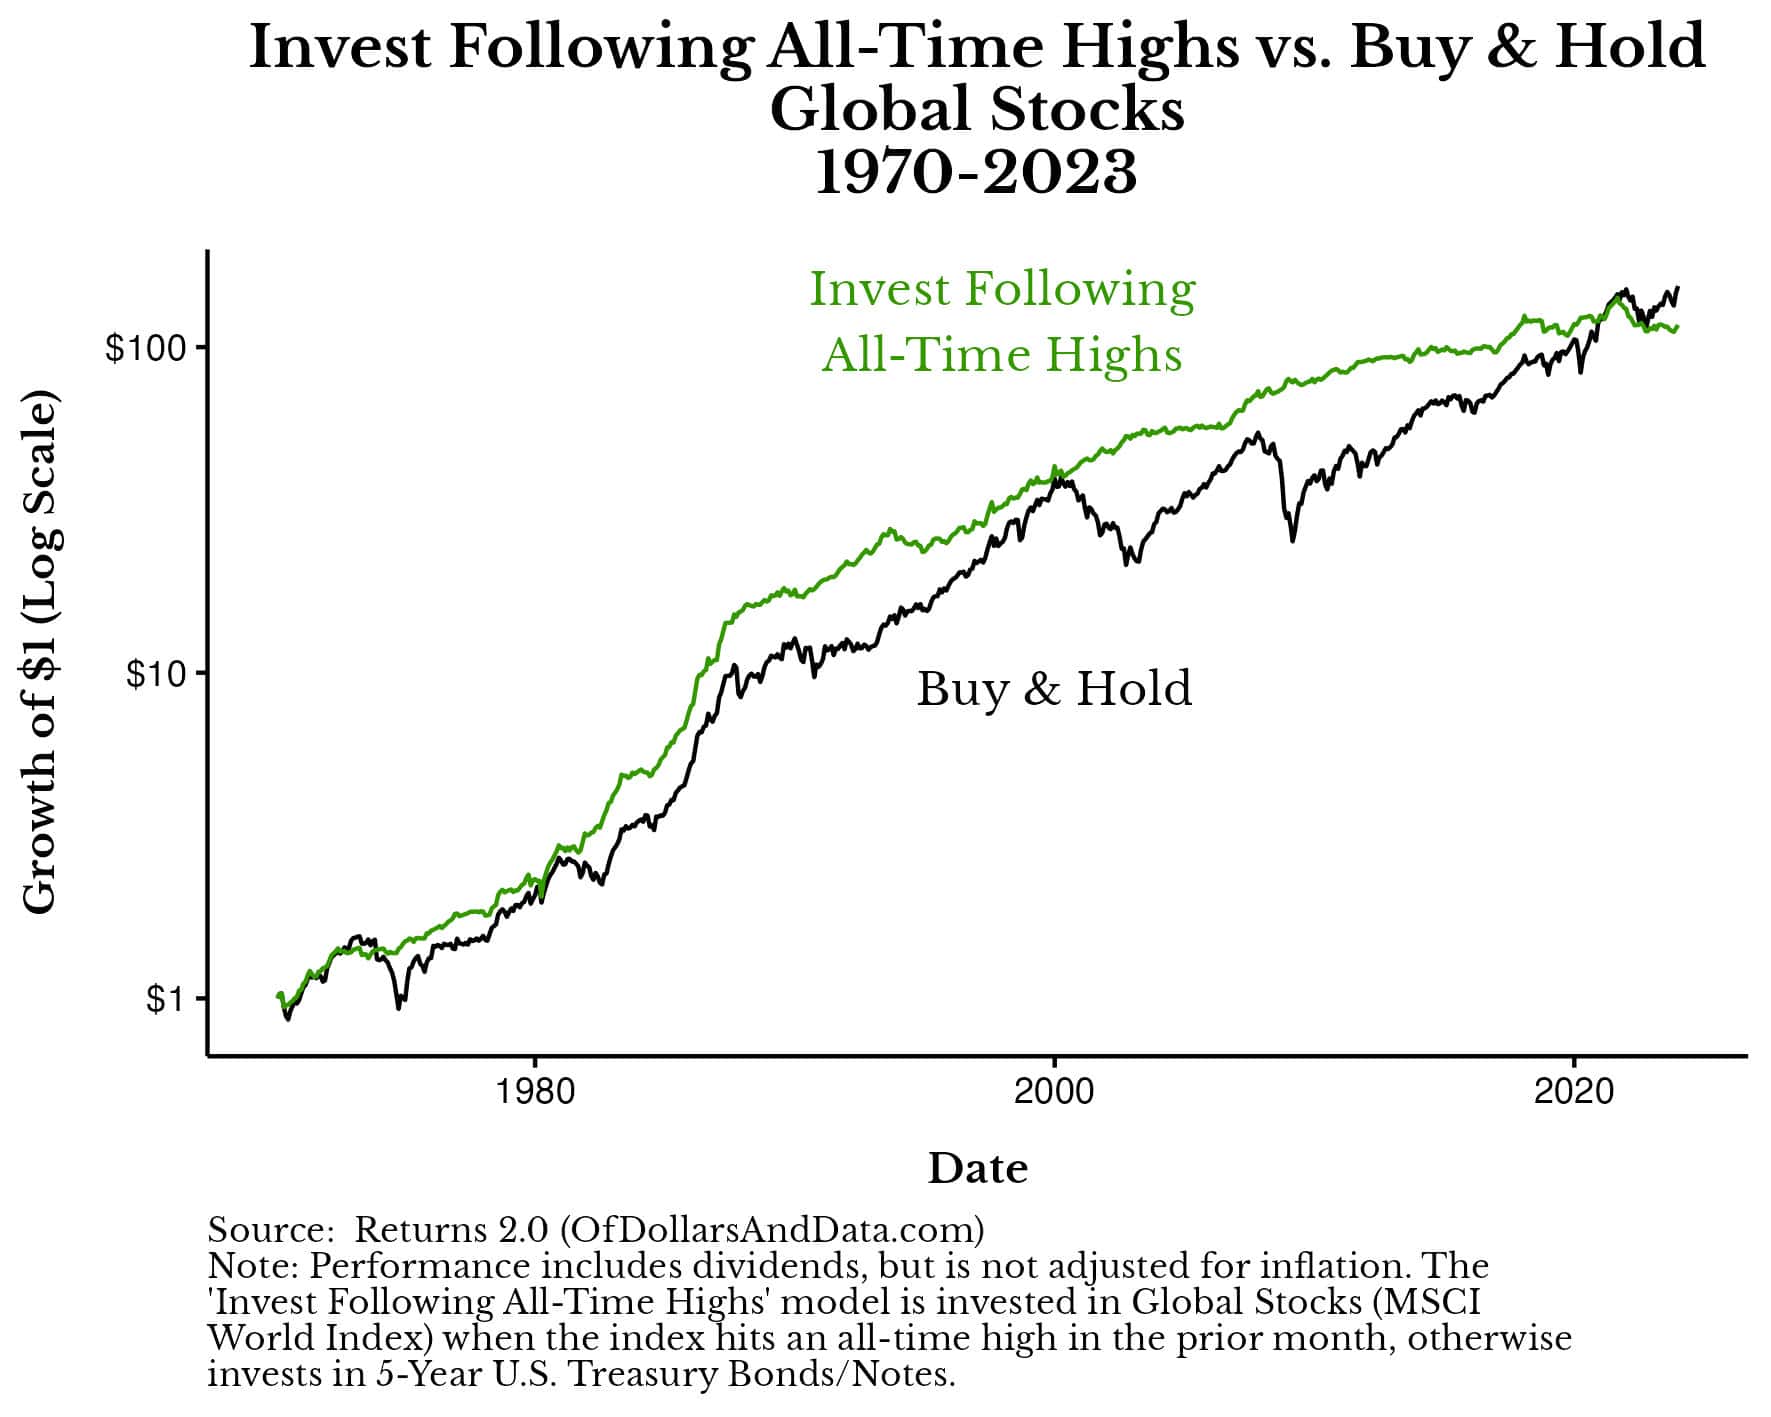
I find it a bit funny that this strategy, which outperformed Buy & Hold for nearly 50 years, suddenly stopped outperforming once it was publicly known. Of course, this likely has nothing to do with the strategy being publicized and everything to do with U.S. bonds having one of their worst years ever in 2022. Either way, it goes to show that strategies that seem foolproof in hindsight can fall apart relatively quickly.
More importantly, this strategy of investing following all-time highs was only successful with global stocks. If you had implemented this same strategy with U.S. stocks, you would’ve outperformed until the mid 1990s, and then you would’ve mostly underperformed Buy & Hold since:
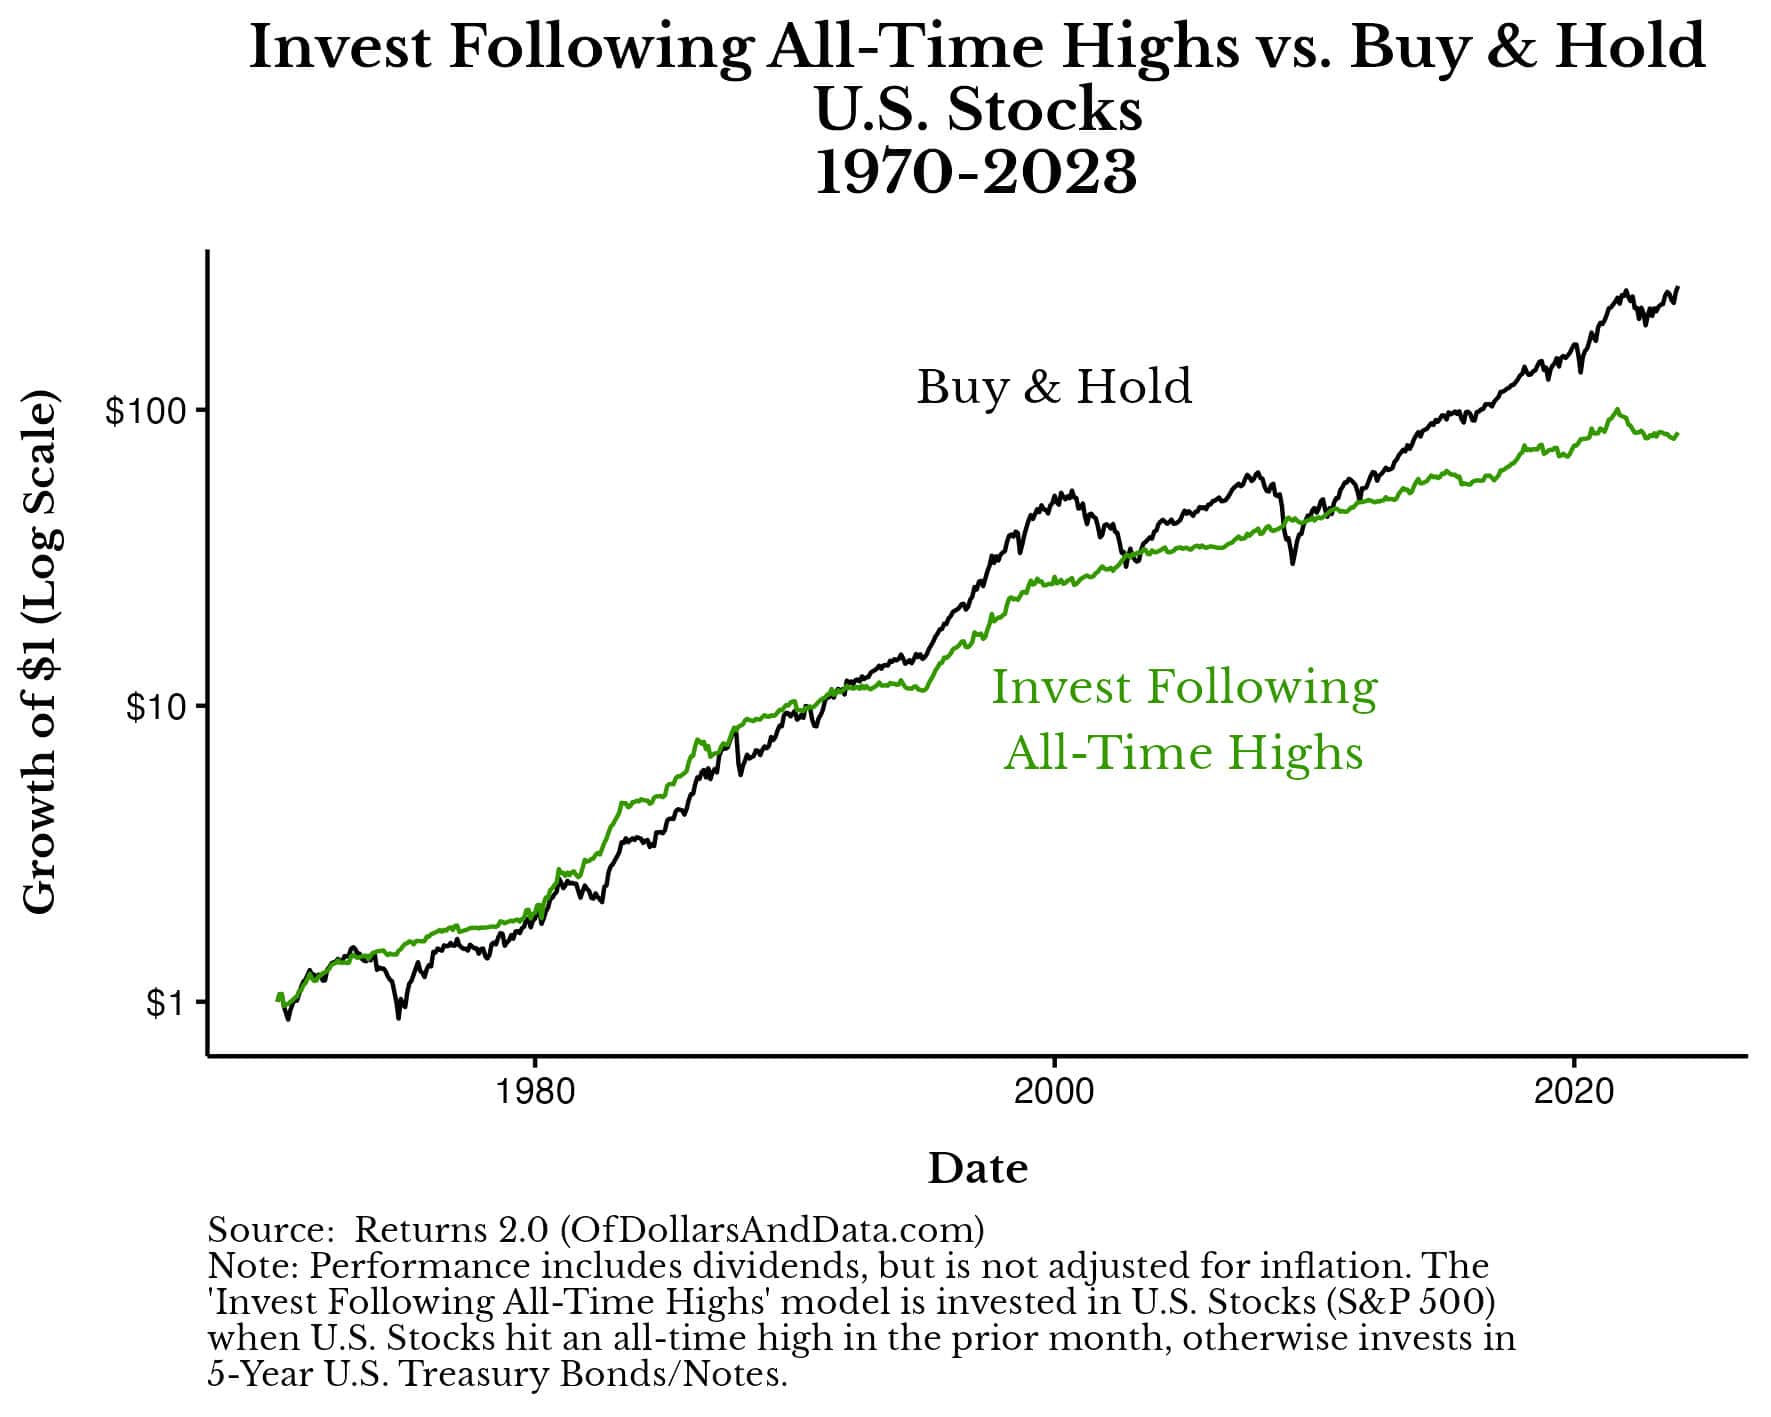
While this is just one possible strategy you could use to try and profit from all-time highs, as you can see, timing the market is almost never a good idea.
I’ve written about market timing maybe more than any other topic (see here, here, here, here, and here), yet I always come to the same conclusion—don’t do it.
It’s not that you can’t time the market ever, but it’s unlikely that you will be able to do it consistently. You may get it right once or twice, but you won’t get it right over your entire career. Consider the case of Michael Burry who famously called the 2008 housing crash, but has been wrong basically ever since (image from Adam Khoo):
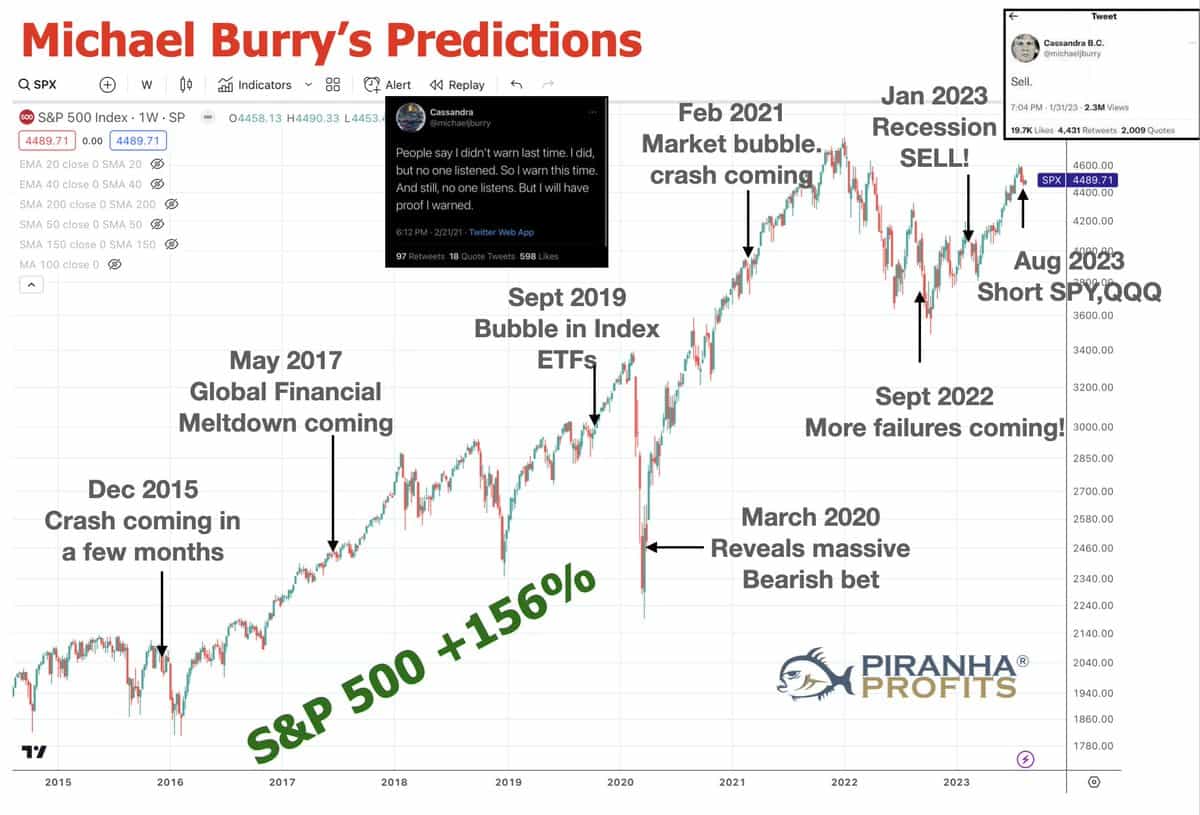
I don’t say this to dunk on Burry (actually I do a little), but to reveal the fact that market timing is incredibly hard.
After all, if those who are good at it fail at it regularly, what chance do you have?
Now that we’ve looked at whether there is a profitable all-time high trading strategy, let’s wrap things up by discussing whether you should worry about investing near all-time highs.
Should You Worry About Investing Near All-Time Highs?
Historically, equities (as a whole) tend to outperform in the short run following all-time highs, but there is less clarity over longer time periods. If this worries you, then the solution isn’t to not invest, but to take less risk in what you are investing in. I’m of the opinion that when someone is worried about investing at a particular time that it’s not the time that is the issue, but the allocation.
Investing your life savings into 100% stocks at an all-time high isn’t the scary part, investing your life savings into 100% stocks is. If more people actually understood this (and what their actual risk tolerance was), then they would be more open to investing now, but in a lower risk portfolio.
At the end of the day, I can’t change how you feel though. You have to do that. I can only show you the data and ask you to make an informed decision based on it.
Personally, I’ve never changed my investment strategy based on whether markets were at all-time highs and I never will. Any changes to my allocation have been due to my personal life (financial goals) and not what was happening with stock prices. Whether you decide to follow a similar approach is up to you.
Happy investing and thank you for reading!
If you liked this post, consider signing up for my newsletter.
This is post 383. Any code I have related to this post can be found here with the same numbering: https://github.com/nmaggiulli/of-dollars-and-data

