The benefits of diversification have been known for over half a century. In the early 1950s, Harry Markowitz demonstrated that there exists an “optimal” portfolio which has the highest investment return for a given level of risk. For his work, which created the field of modern portfolio theory (“MPT”), Markowitz won a Nobel Prize in Economics in the early 1990s.
Diversification is also the cornerstone of my core investment philosophy, as reflected in the Just Keep Buying mantra (emphasis mine):
The continual purchase of a diverse set of income-producing assets.
However, despite the theoretical ease with which someone could apply this mantra to their investment portfolio, I’ve recently realized the practical difficulties in doing so. And I want to discuss those difficulties today.
After all, you probably already know about the benefits of diversification. You know why you shouldn’t put all your eggs in one basket. But, do you know about the downsides? Do you know about the challenges that lie ahead?
If not, then you may just abandon your diversified approach at the worst possible moment. That’s what this blog post is trying to prevent. Not only will I share my personal experience with diversification (using my portfolio returns), but I will also illustrate what you should expect in a diversified portfolio so that you don’t lose faith in the future. Let’s begin.
Diversification in the S&P 500 Era
For anyone who has been investing since the Great Financial Crisis, diversification has basically meant underperforming U.S. stocks in general and large U.S. stocks in particular for the past decade and a half. I know this pain all too well.
When I started investing in August 2012 during my first full-time job out of college, my allocation consisted of U.S. stocks, U.S. bonds, international stocks (Developed & Emerging Markets), and U.S. REITs. Though I later added tilts to small cap and value stocks, this allocation has remained remarkably consistent over the past 11 years.
Unfortunately, my portfolio’s underperformance relative to U.S. stocks has remained remarkably consistent as well. Below is a chart showing the total return of my portfolio (in black) against all of its underlying holdings going back to August 2012:
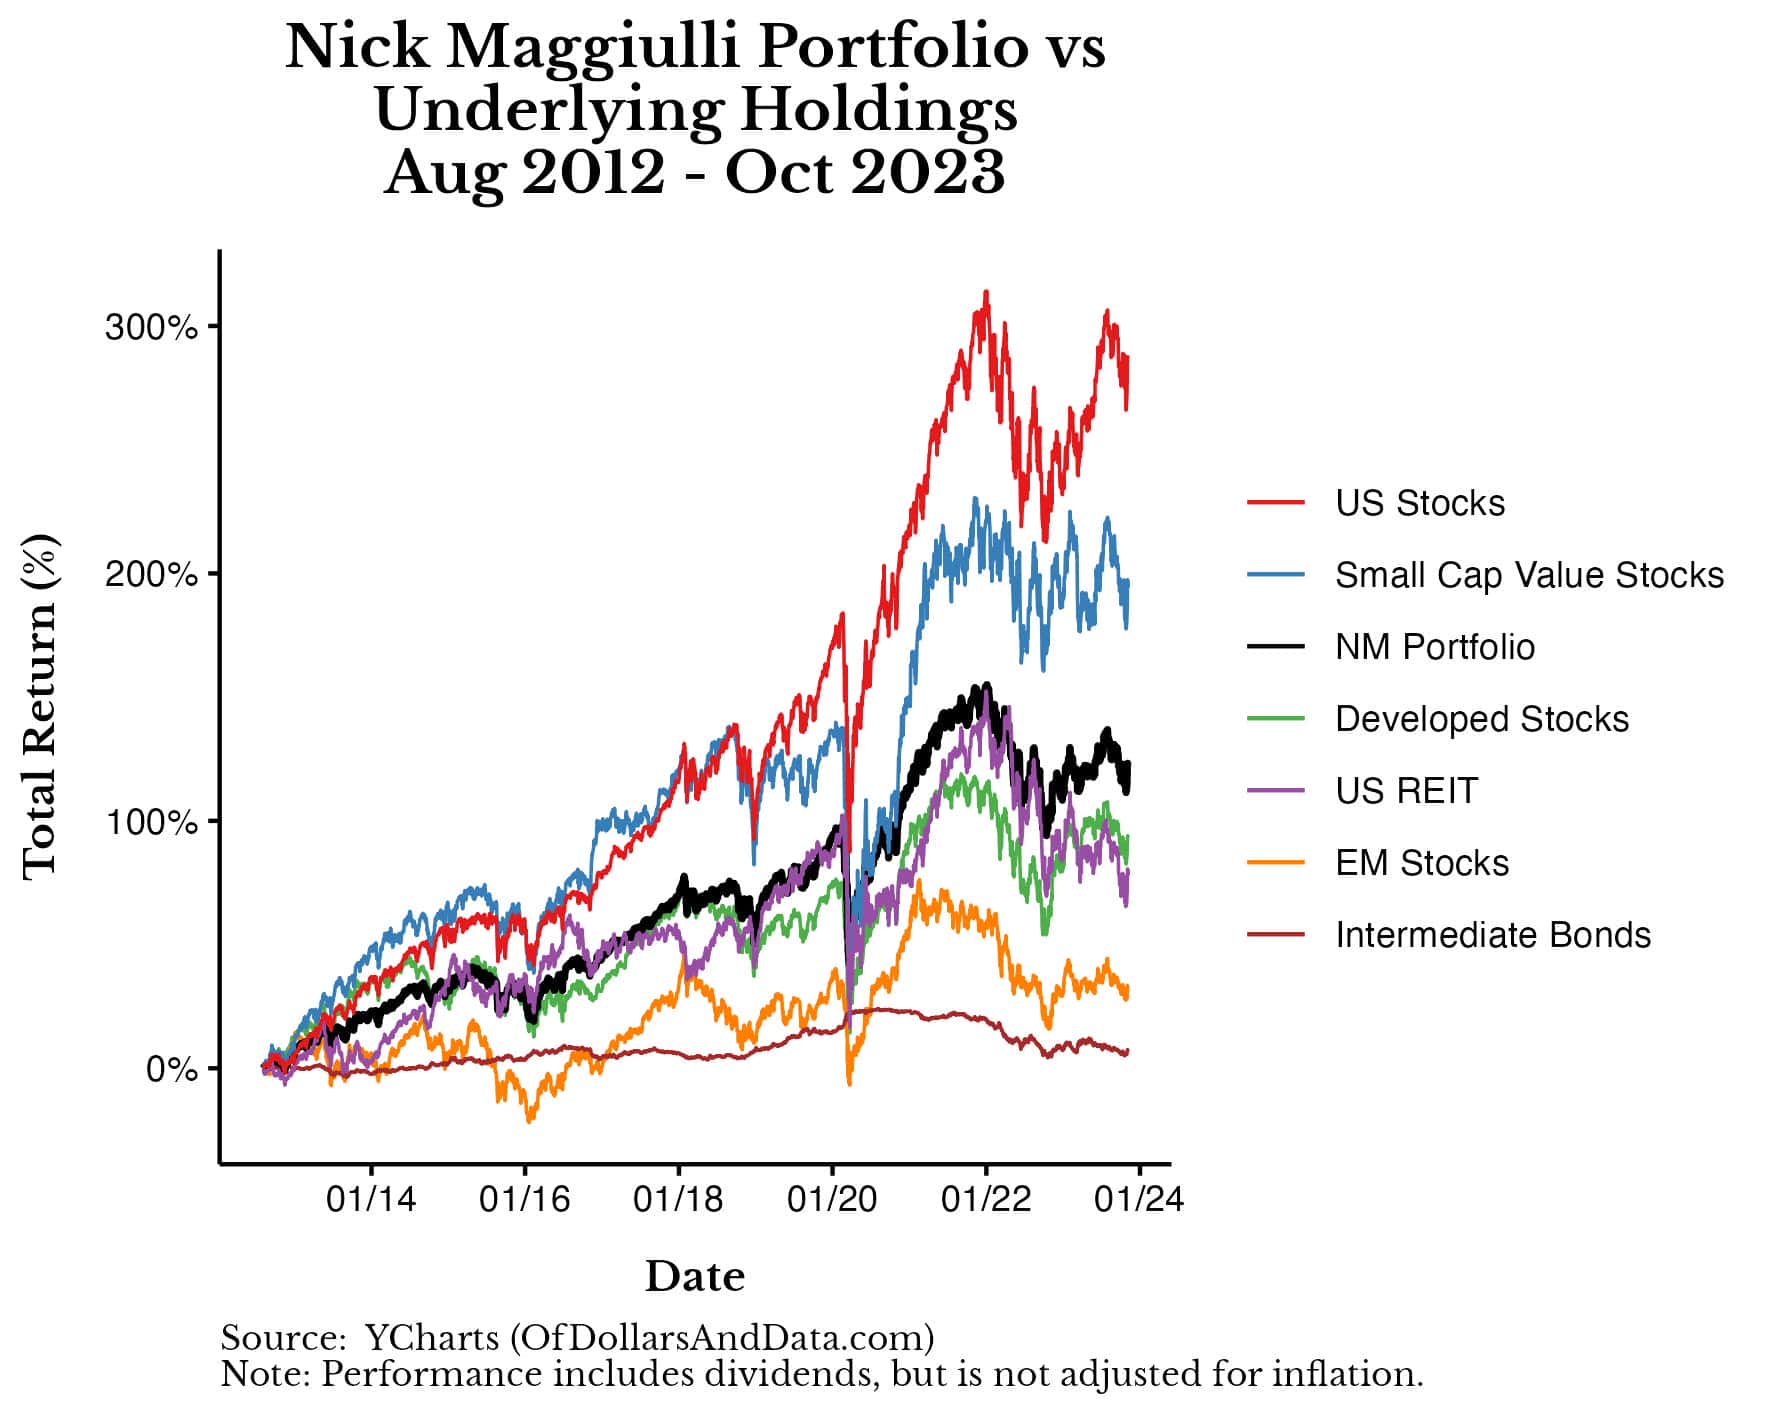
From August 2012 to mid-November 2023, my portfolio returned 7.6% annually or 4.8% per year after inflation. This is above my long-term return expectation of 4% per year after inflation for a diversified portfolio. However, it’s still far below what U.S. stocks returned over this same time period. From August 2012 to mid-November 2023, the S&P 500 returned 13.1% annually or 10.2% per year after inflation.
This means that the S&P 500 outperformed my portfolio after inflation by over 5% per year! Given that the long-term inflation-adjusted return for U.S. stocks is ~7% per year, the fact that the S&P 500 return 10% per year (after inflation) for over a decade is exceptional.
Looking back now, it seems obvious that I should’ve had a higher allocation to U.S. stocks, but it wasn’t so obvious back then. You have to remember that the U.S. stock market had just experienced one of its worst decades ever:
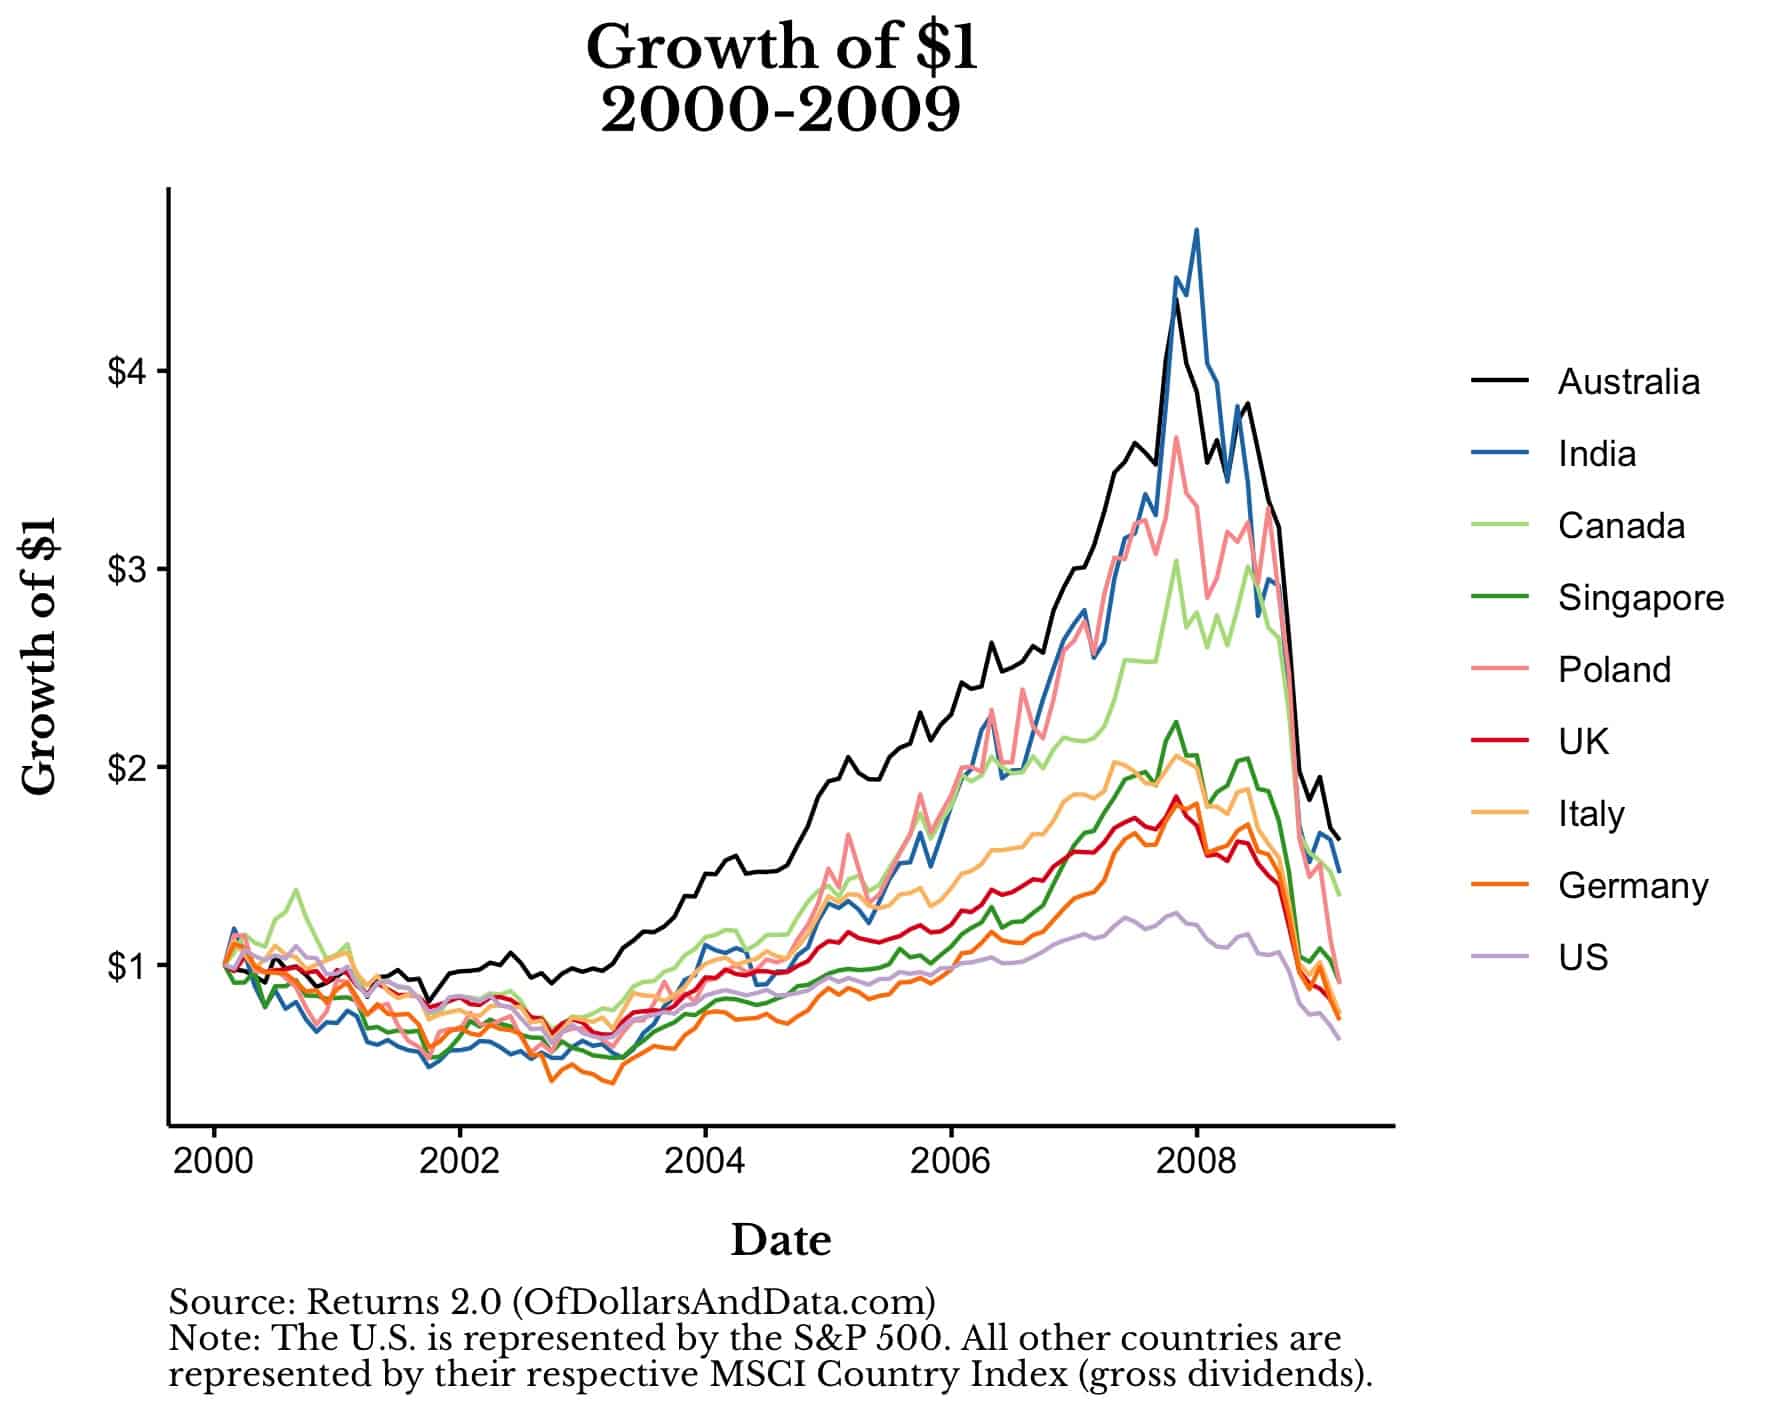
Imagine seeing this and then thinking a few years later that owning 100% U.S. stocks was the way to go. Ironically, that would’ve been the profit maximizing choice among the asset classes I was considering at the time. However, I never would’ve put 100% of my money into any single asset class, so this thought experiment is somewhat misleading.
A better evaluation of my portfolio’s performance is how it has done relative to other diversified portfolios. On that front, the Nick Maggiulli portfolio has performed much better.
Below is a chart showing the performance of my portfolio (in black) relative to a 60/40 (U.S. Stock/U.S. bond) portfolio, the All Weather portfolio (made famous by Ray Dalio), and the Permanent Portfolio from August 2012 to October 2023 [special thanks to YCharts for making these comparisons so easy]:
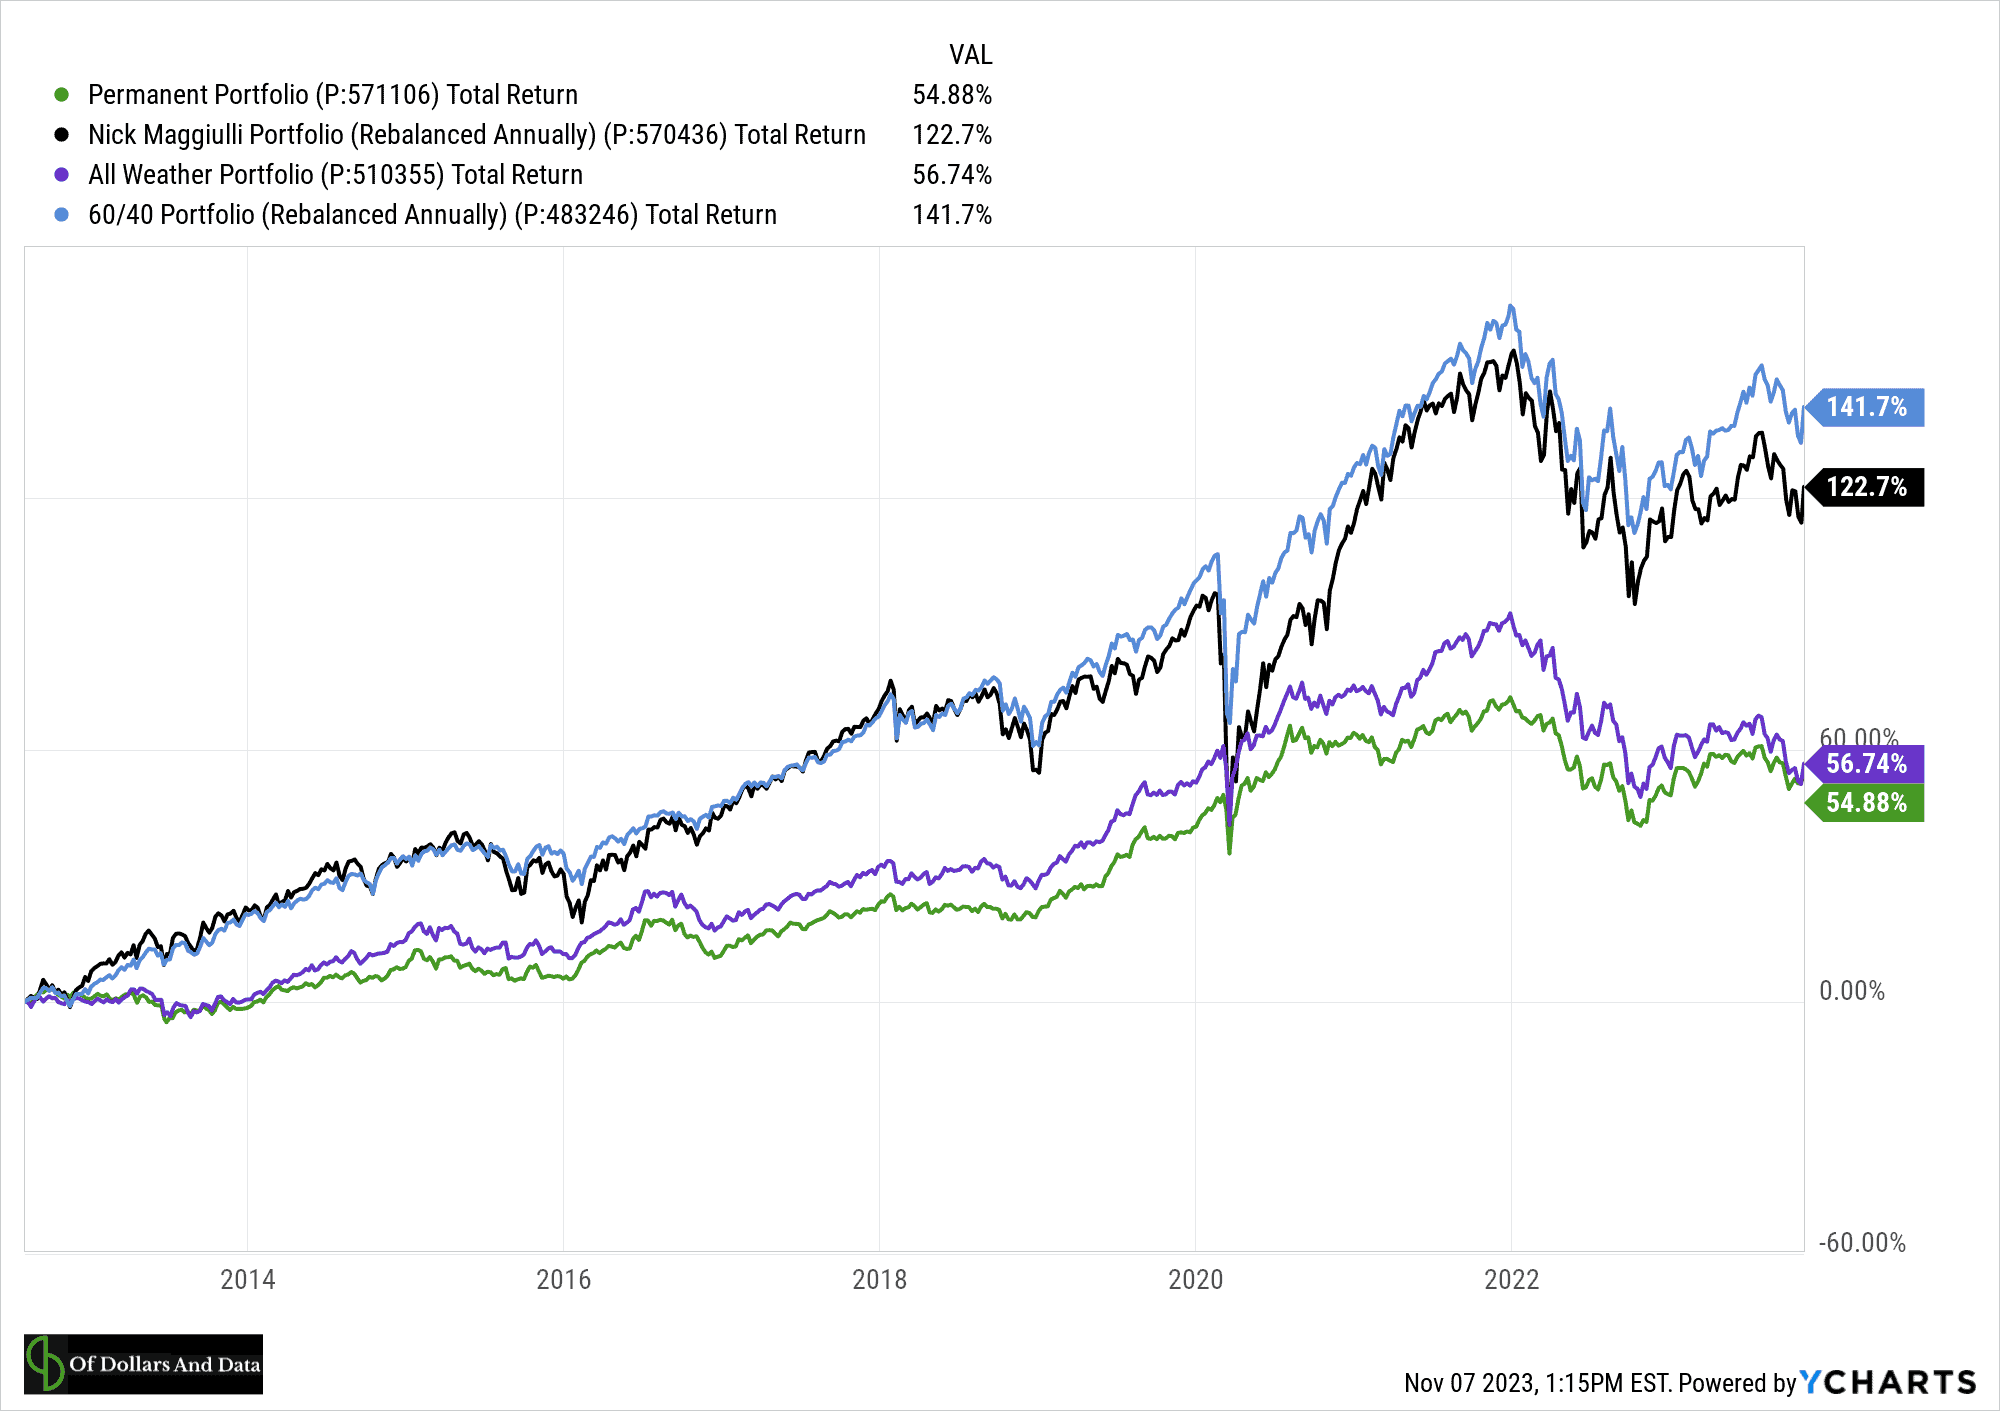
When compared to other diversified portfolios, my portfolio (in black) doesn’t look so bad after all. It easily outperformed the All Weather Portfolio and the Permanent Portfolio while only experiencing slight underperformance relative to a 60/40 portfolio.
Seeing these results presents a very different picture (no pun intended) of my portfolio’s performance. This gives me two choices on how to interpret my portfolio’s performance. I could either:
- Beat myself up for not putting everything into the S&P 500, or
- Be proud of how well my approach has done relative to other diversified portfolios.
Which is the right answer? I don’t know.
Some have argued that the S&P 500 is diversified enough as is with its large exposure to international markets (through U.S. companies). That’s a fair argument and one that John Bogle and Warren Buffett have made in the past. Nevertheless, I choose to diversify into foreign equities.
You don’t have to agree with this decision or with my any part of my allocation, but it’s what works for me. I hope for 4% inflation-adjusted annualized returns and, so far, my portfolio has delivered (and then some). That’s what ultimately matters.
When you go to build your portfolio, you will grapple with some of these same issues internally. You will see part of your portfolio underperform. You will overanalyze your decisions. You will lose money at times.
And, if you don’t, then you aren’t actually diversified. I can prove it too.
Even the Optimal Portfolio Loses Money
The beauty of modern portfolio theory is that we can use historical data to find the highest returning portfolio for a given level of risk. This is known as the optimal portfolio. Unfortunately, the optimal portfolio is the best portfolio for the past, not the future. It tells you the best thing you could’ve done, not the best thing to do going forward.
Nevertheless, if we know how the optimal portfolio behaved in the past, we can better understand how a similar kind of portfolio might behave in the future. This is exactly what I’ve done.
Using asset class data from Bullion Vault from 1972-2022, I crunched the numbers and found that the optimal portfolio over this time period was:
- 38% U.S. Housing
- 24% U.S. Stocks
- 18% U.S. Bonds (10-Year Treasury)
- 16% Gold
- 4% U.S. REIT
This is the asset mix that would’ve produced the highest return per unit risk over this time period for the asset classes in the BV data.
However, even this mathematically optimal mix of assets would have lost money in over 20% of all years tested. You can see this in the chart below showing the annual returns of the S&P 500 compared to the optimal portfolio from 1972-2022:
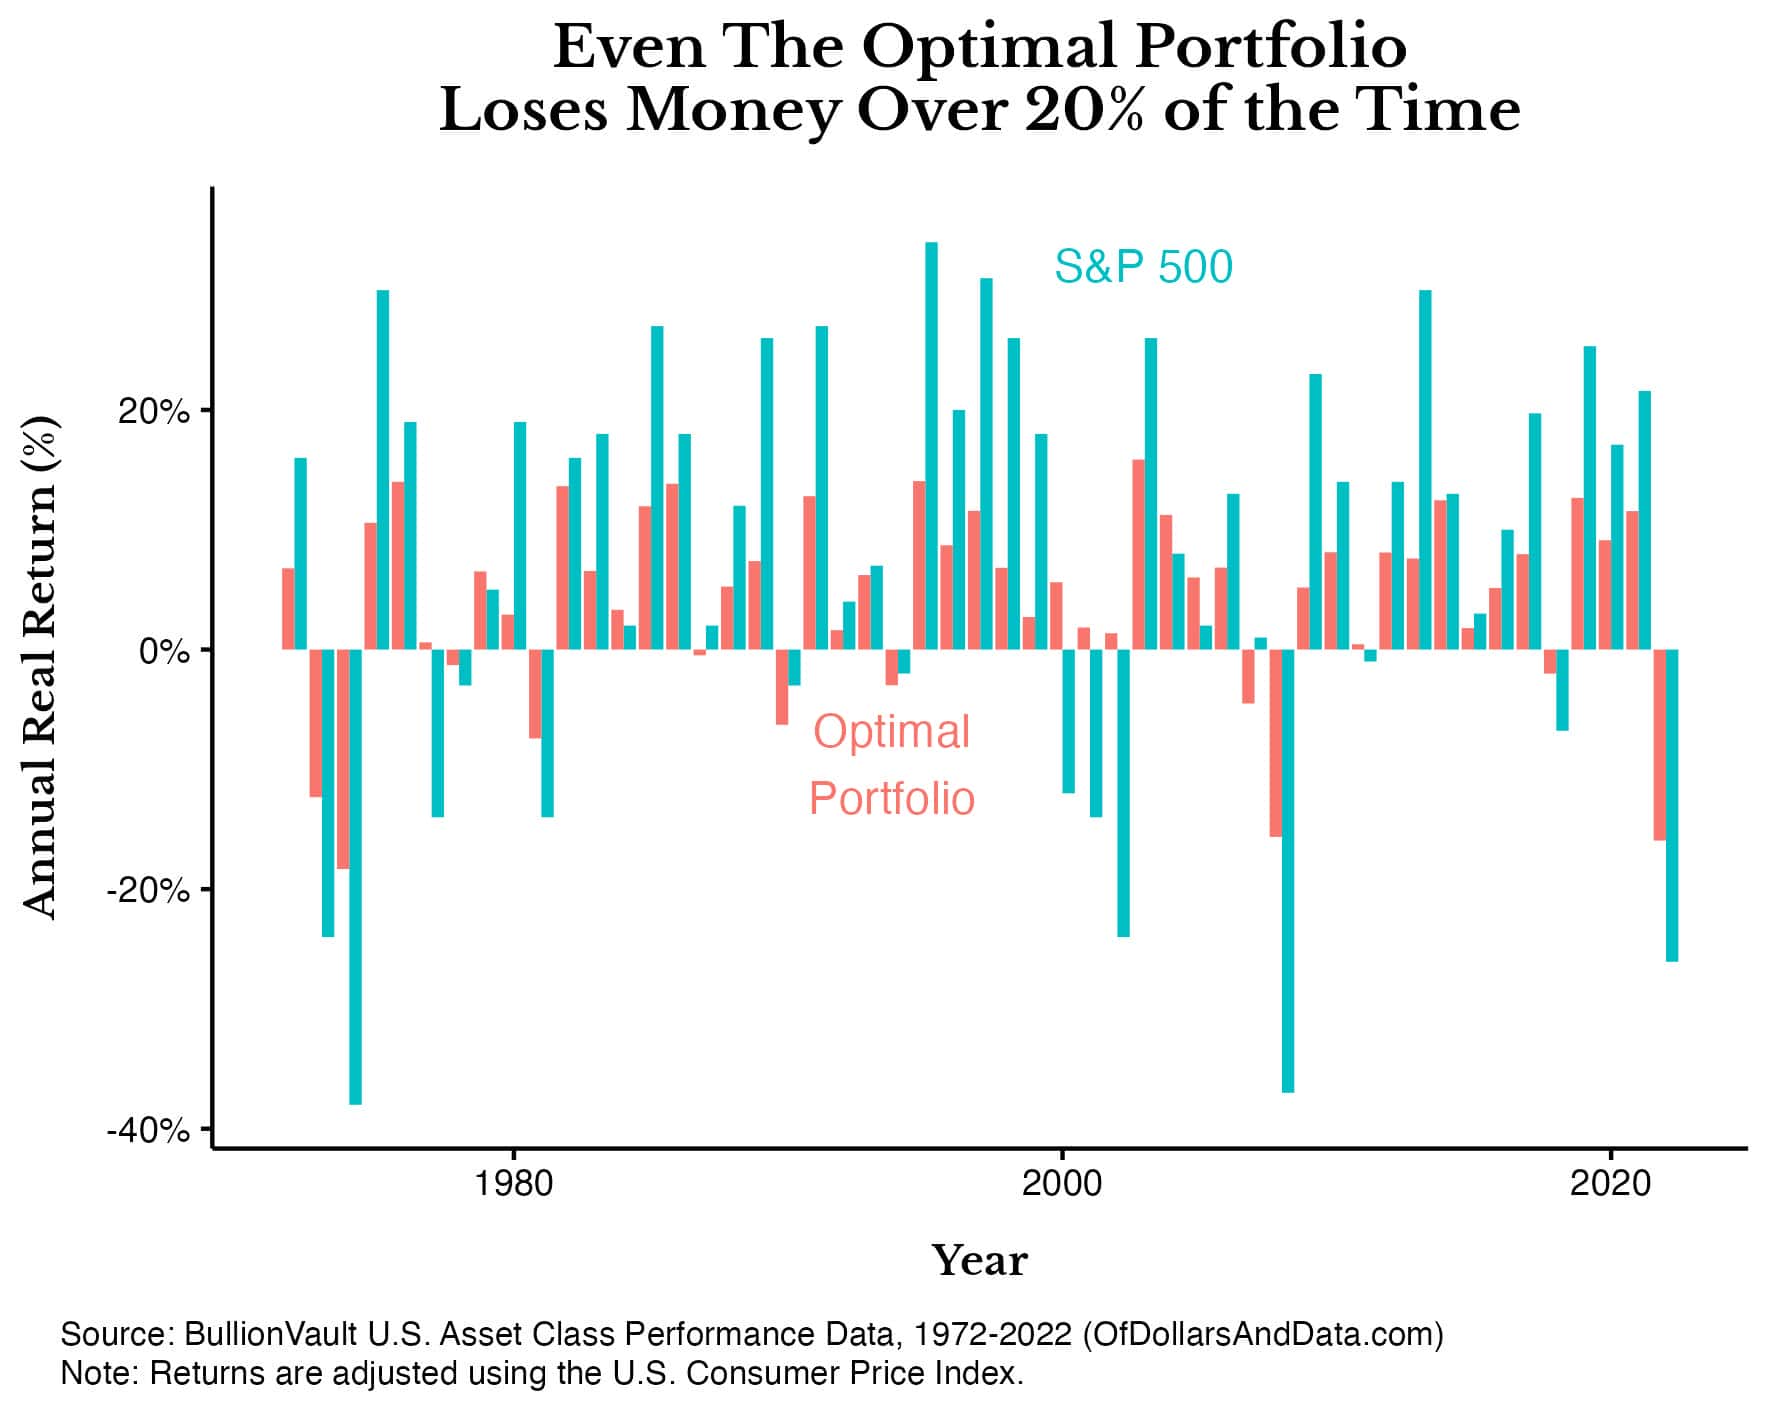 While the optimal portfolio experiences far less volatility than the S&P 500, it still loses money in one out of every five years.
But, as investors, we don’t just care about our overall portfolio return, we also tend to focus on the returns of our underlying holdings too.
Unfortunately, the optimal portfolio is not immune from owning individual asset classes that lose money either. In fact, in 88% of all years at least one of its asset classes lost money and in 63% of all years at least two of its asset classes lost money. The chart below illustrates this by plotting the number of asset classes losing money in the optimal portfolio by year from 1972-2022:
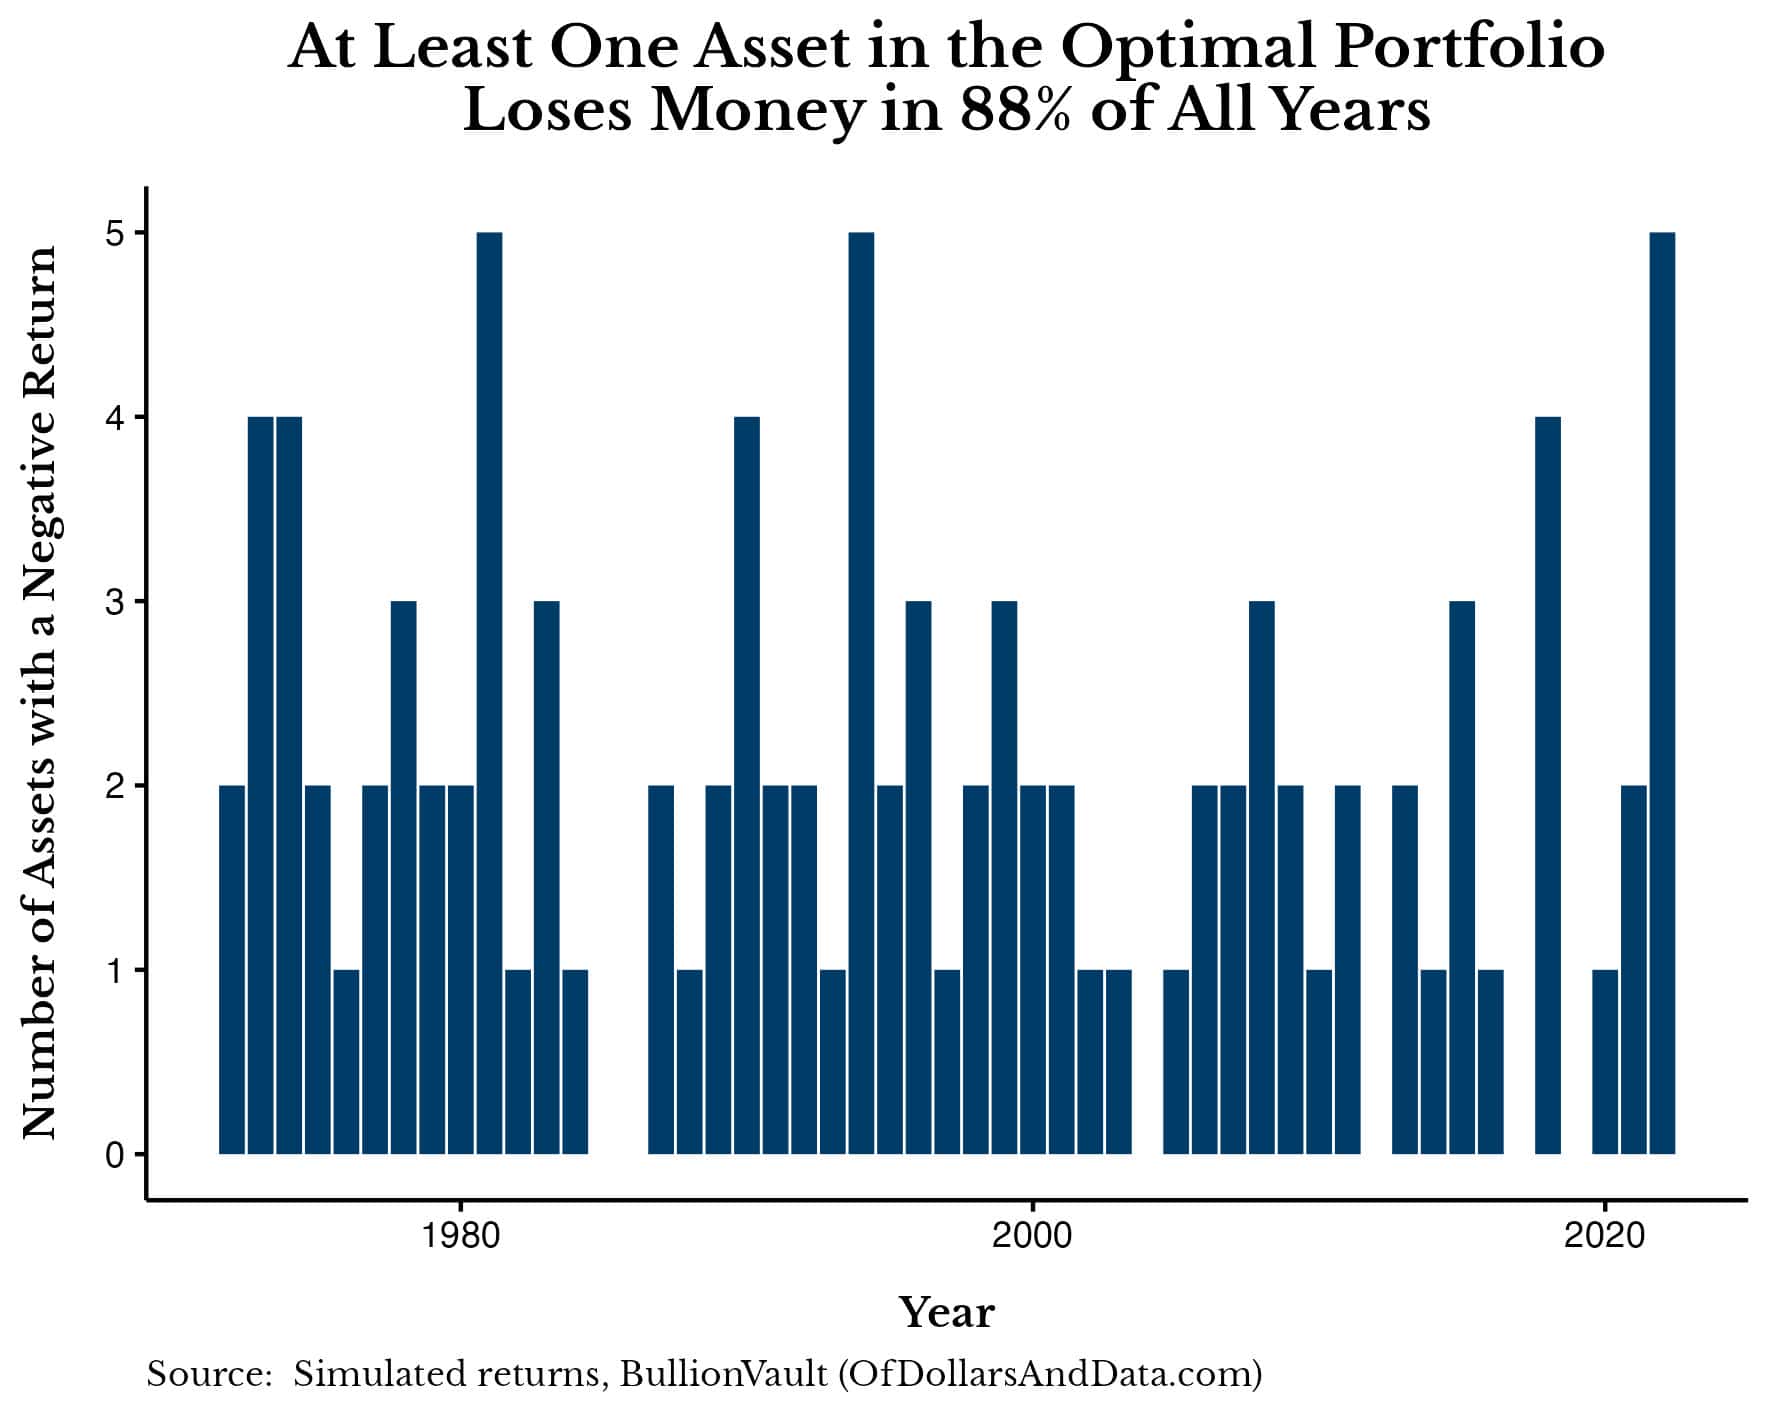
This chart highlights the biggest downside of diversification—some part of your portfolio is almost always losing money. You can’t escape it either. Because even when you “cheat” and mathematically solve for the optimal portfolio, this portfolio still loses money in some years and has at least two asset classes losing money in most years.
Therefore, even in the best case scenario, you should expect to lose money in a diversified portfolio on occasion and in parts of your portfolio quite frequently. And that’s in “the best case scenario” too.
However, you won’t be in the best case scenario. You’ll own assets that probably do worse than this. You’ll own REITs and then COVID will hit, sending commercial real estate into a multi-year downward spiral. You’ll own bonds and then rates will increase by the fastest pace in 40 years. You’ll own emerging market stocks and then geopolitical conflict will break out around the world. You get the point.
This is why diversification is ultimately an ongoing battle against relative underperformance. Brian Portnoy said it best when he wrote, “Diversification means always having to say you’re sorry.” And it’s so true.
You have to get used to saying sorry to yourself for owning some underperforming asset class. And, trust me, there will always be some underperforming asset class. It’s unavoidable. Right now those underperforming asset classes are emerging market stocks, long duration U.S. bonds, and REITs, but, one day, the underperformers will be the S&P 500 and technology stocks. It’s happened before and it will happen again.
The good news is that most of the downsides of diversification are in your head. There’s almost no chance that you will ever go broke while being diversified. However, you will question whether to be diversified in the first place. If you can overcome that, then you’ll be just fine.
With that being said, Happy Thanksgiving, happy investing, and thank you for reading!
If you liked this post, consider signing up for my newsletter.
This is post 373. Please see analysis 6, 41, and 373 for code related to this post: https://github.com/nmaggiulli/of-dollars-and-data

