Imagine a portfolio that you can own for life. A portfolio that does well during inflation and during deflation. A portfolio that works in economic growth and economic stagnation. A portfolio for the best of times and the worst of times. This is the idea behind the All Weather Portfolio.
The All Weather Portfolio was created by Ray Dalio and his firm Bridgewater Associates, currently the largest hedge fund in the world. Bridgewater manages over $150 billion in assets and is known for their analysis of economic cycles as one of the top global macro hedge funds on Earth.
While you don’t need Bridgewater’s sophistication to succeed as an investor, their insights from the All Weather Portfolio may be beneficial for how you manage your money. Let’s dig in.
What is the All Weather Portfolio?
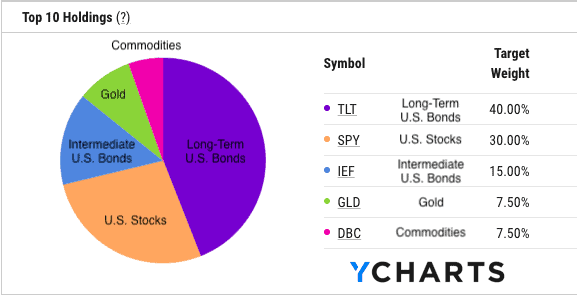
The All Weather Portfolio is an investment portfolio whose purpose is to perform well under different economic environments. Because of this mandate, the portfolio consists of 55% U.S. bonds, 30% U.S. stocks, and 15% hard assets (Gold + Commodities). [Note that this is the portfolio allocation based on Dalio’s interview with Tony Robbins in MONEY Master The Game]:
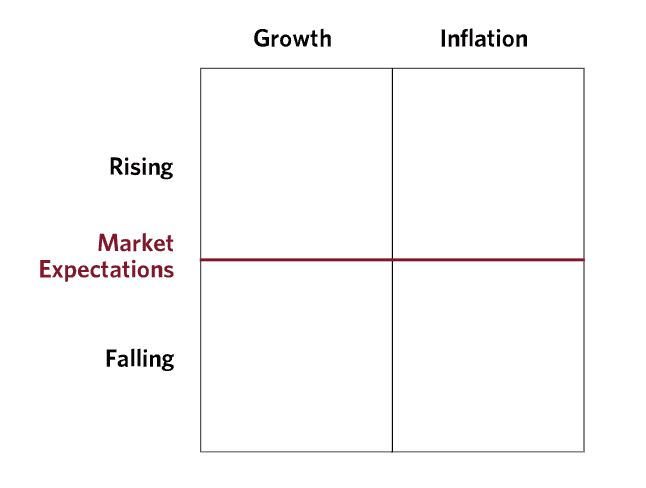
Why this particular mix of assets? Because this mixture performs well under the four economic environments highlighted by Dalio:
- Rising prices (inflation)
- Falling prices (deflation)
- Rising growth (bull markets)
- Falling growth (bear markets)
Dalio and Bridgewater have framed these four economic environments in a matrix as such:
From this matrix we can then determine which assets do best under which economic regime. For example, during periods of rising prices, commodities and gold tend to do well and during periods of falling prices, bonds tend to do well. During periods of rising growth, stocks tend to do well and during periods of falling growth, bonds tend to do well.
Taking this information we can now fill in the matrix with the best performing asset under each economic environment:
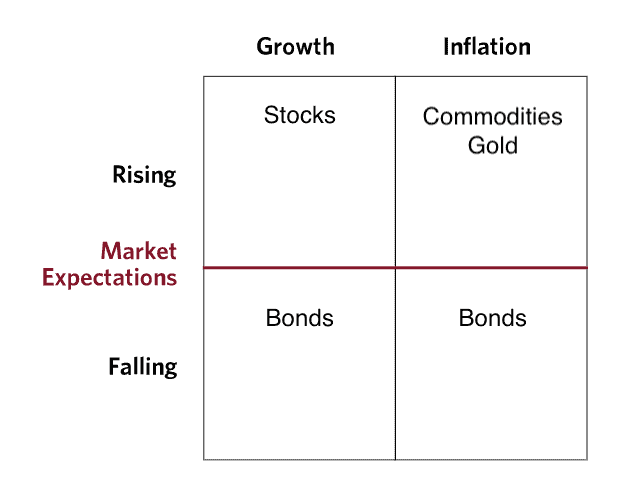
From here you can begin to see why the All Weather Portfolio has a higher allocation to bonds than stocks and a higher allocation to stocks than hard assets (Gold + Commodities). Since all four economic environments do not occur with the same frequency (i.e. high growth is more common than high inflation), the weightings of the assets are set to reflect this.
While this is an oversimplification of how assets react during different economic regimes, it gets at the core idea behind the All Weather Portfolio. Every asset performs differently based on what is happening in the macroeconomic environment, so your portfolio allocation should reflect this.
This might seem like an odd way to invest, but understanding the history of the All Weather Portfolio provides more clarity.
How Did the All Weather Portfolio Start?
The full story behind the All Weather Portfolio is nearly three decades in the making. After founding Bridgewater in 1975, Ray Dalio wanted to understand how assets performed following economic surprises. Since asset prices are determined by market participants’ collective expectations about the future, the only thing that can cause a major shift in assets prices is something unexpected (i.e. a surprise).
From this framework, Dalio and his colleagues set out to create a portfolio that would be indifferent to these kinds of economic surprises. As a result, in 1996 they created the All Weather fund. Initially used to house Dalio’s trust assets, Bridgewater’s All Weather fund eventually grew to $46 billion in assets by 2011.
The purpose of the fund matched Dalio’s original assertion to create a portfolio that wouldn’t react heavily to economic surprises. As Bridgewater states in The All Weather Story:
Market participants might be surprised by inflation shifts or a growth bust and All Weather would chug along, providing attractive, relatively stable returns. The strategy was and is passive; in other words, this was the best portfolio Ray and his close associates could build without any requirement to predict future conditions.
This was the key idea for Dalio and Bridgewater—find something that works no matter what the future holds.
This is a powerful concept, because, as I’ve previously discussed, no single asset class is safe now or in the future. Dalio has embraced this truth by creating a collection of assets that can provide stable returns in all economic environments. Well, that’s at least in theory. How has the All Weather Portfolio done in practice?
How Has it Performed?
Despite the great theoretical underpinnings of the All Weather Portfolio, has it performed as expected?
For the most part, yes.
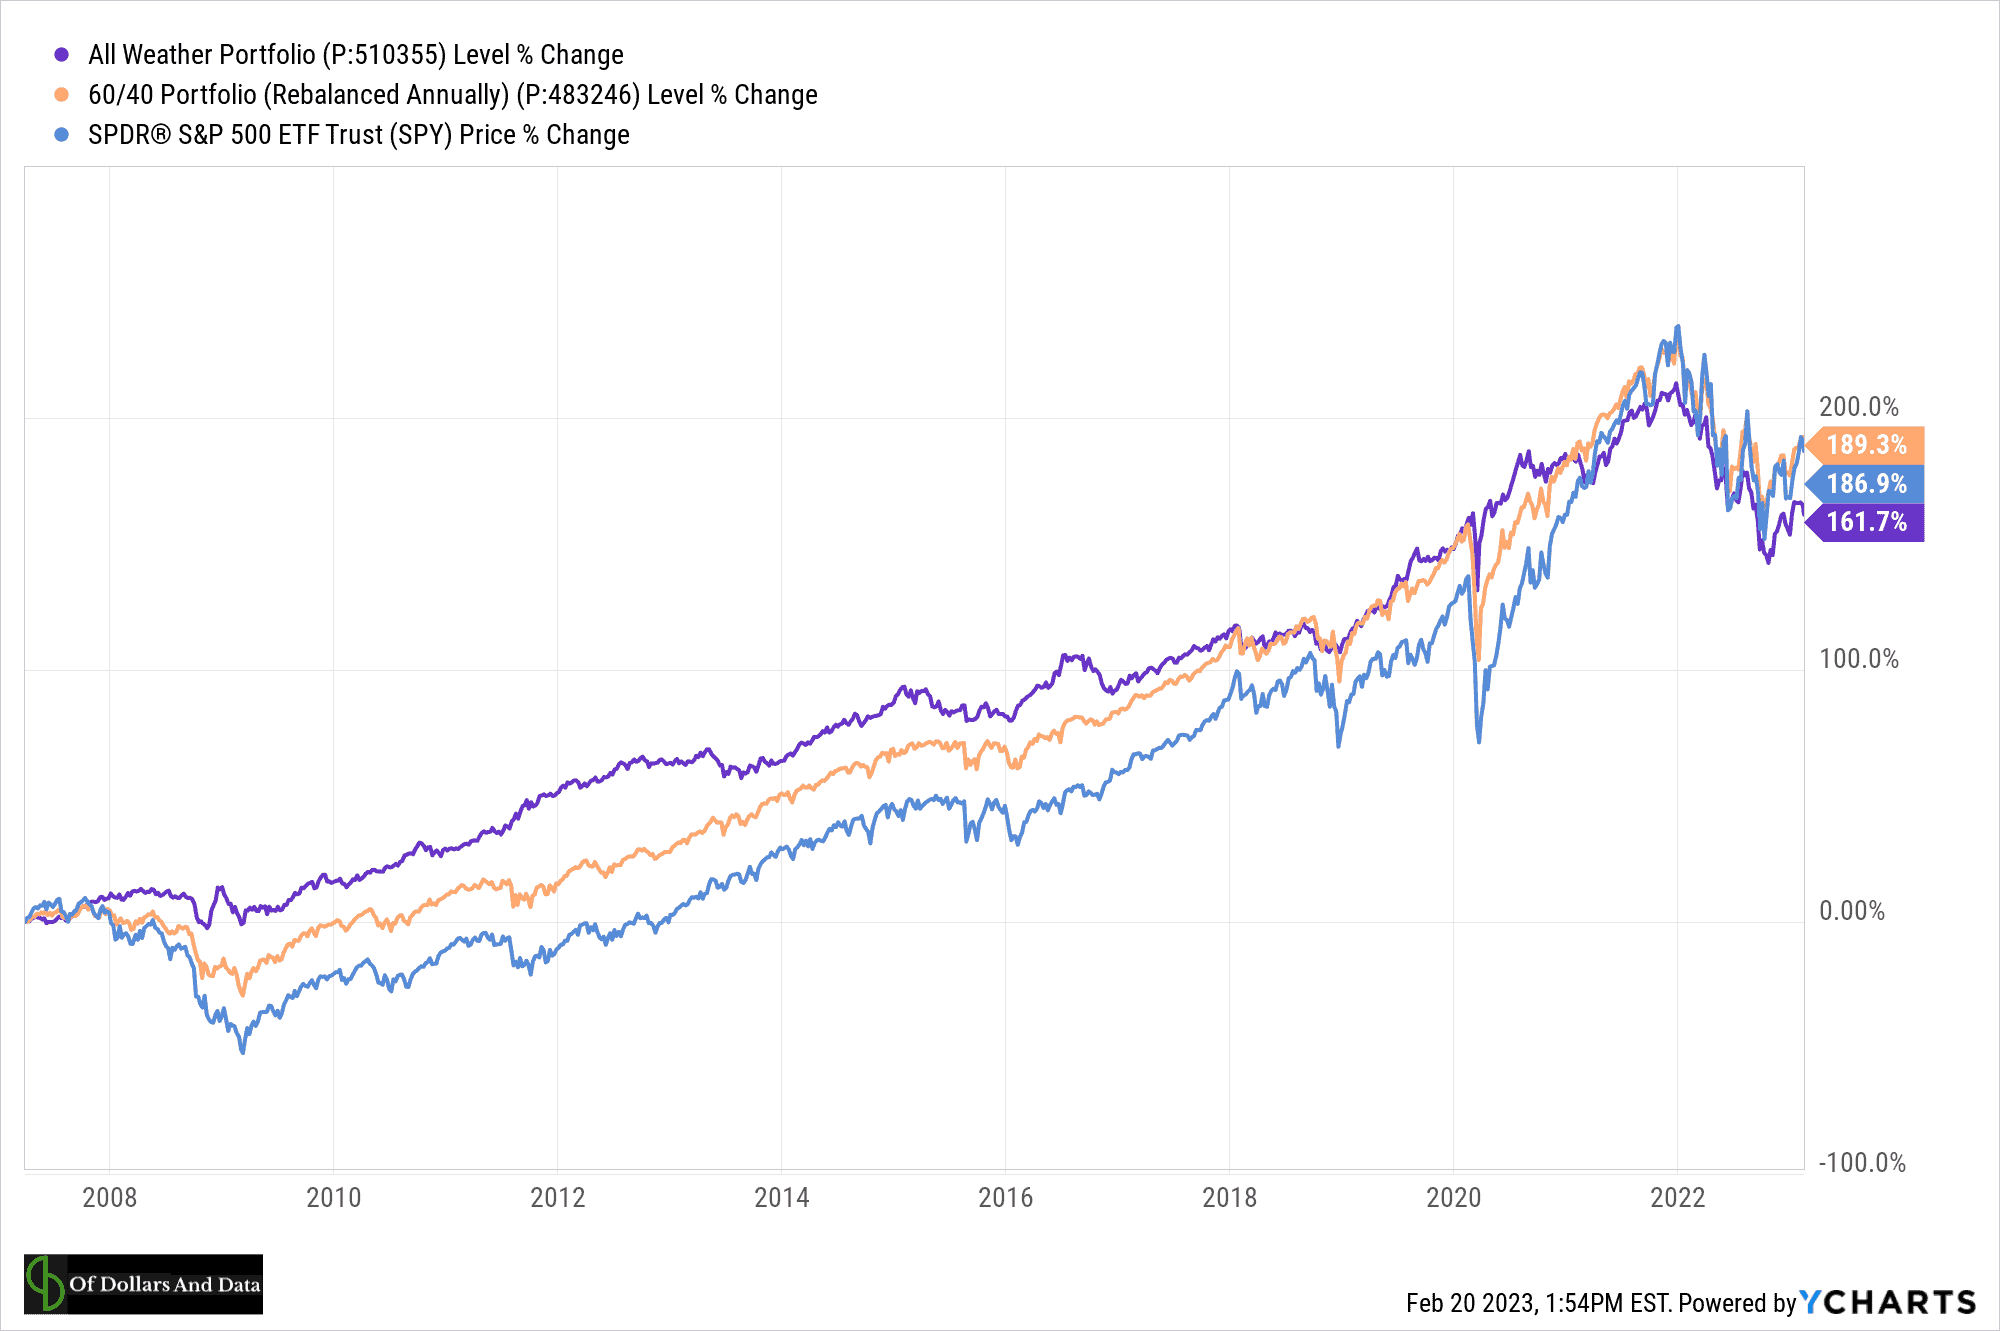
Since February 2006, the All Weather Portfolio has compounded at a rate of 6% a year, which is slightly less than a traditional 60/40 (U.S. Stock/Bond) portfolio and the S&P 500:
This was all while having much smaller drawdowns during most major crises:
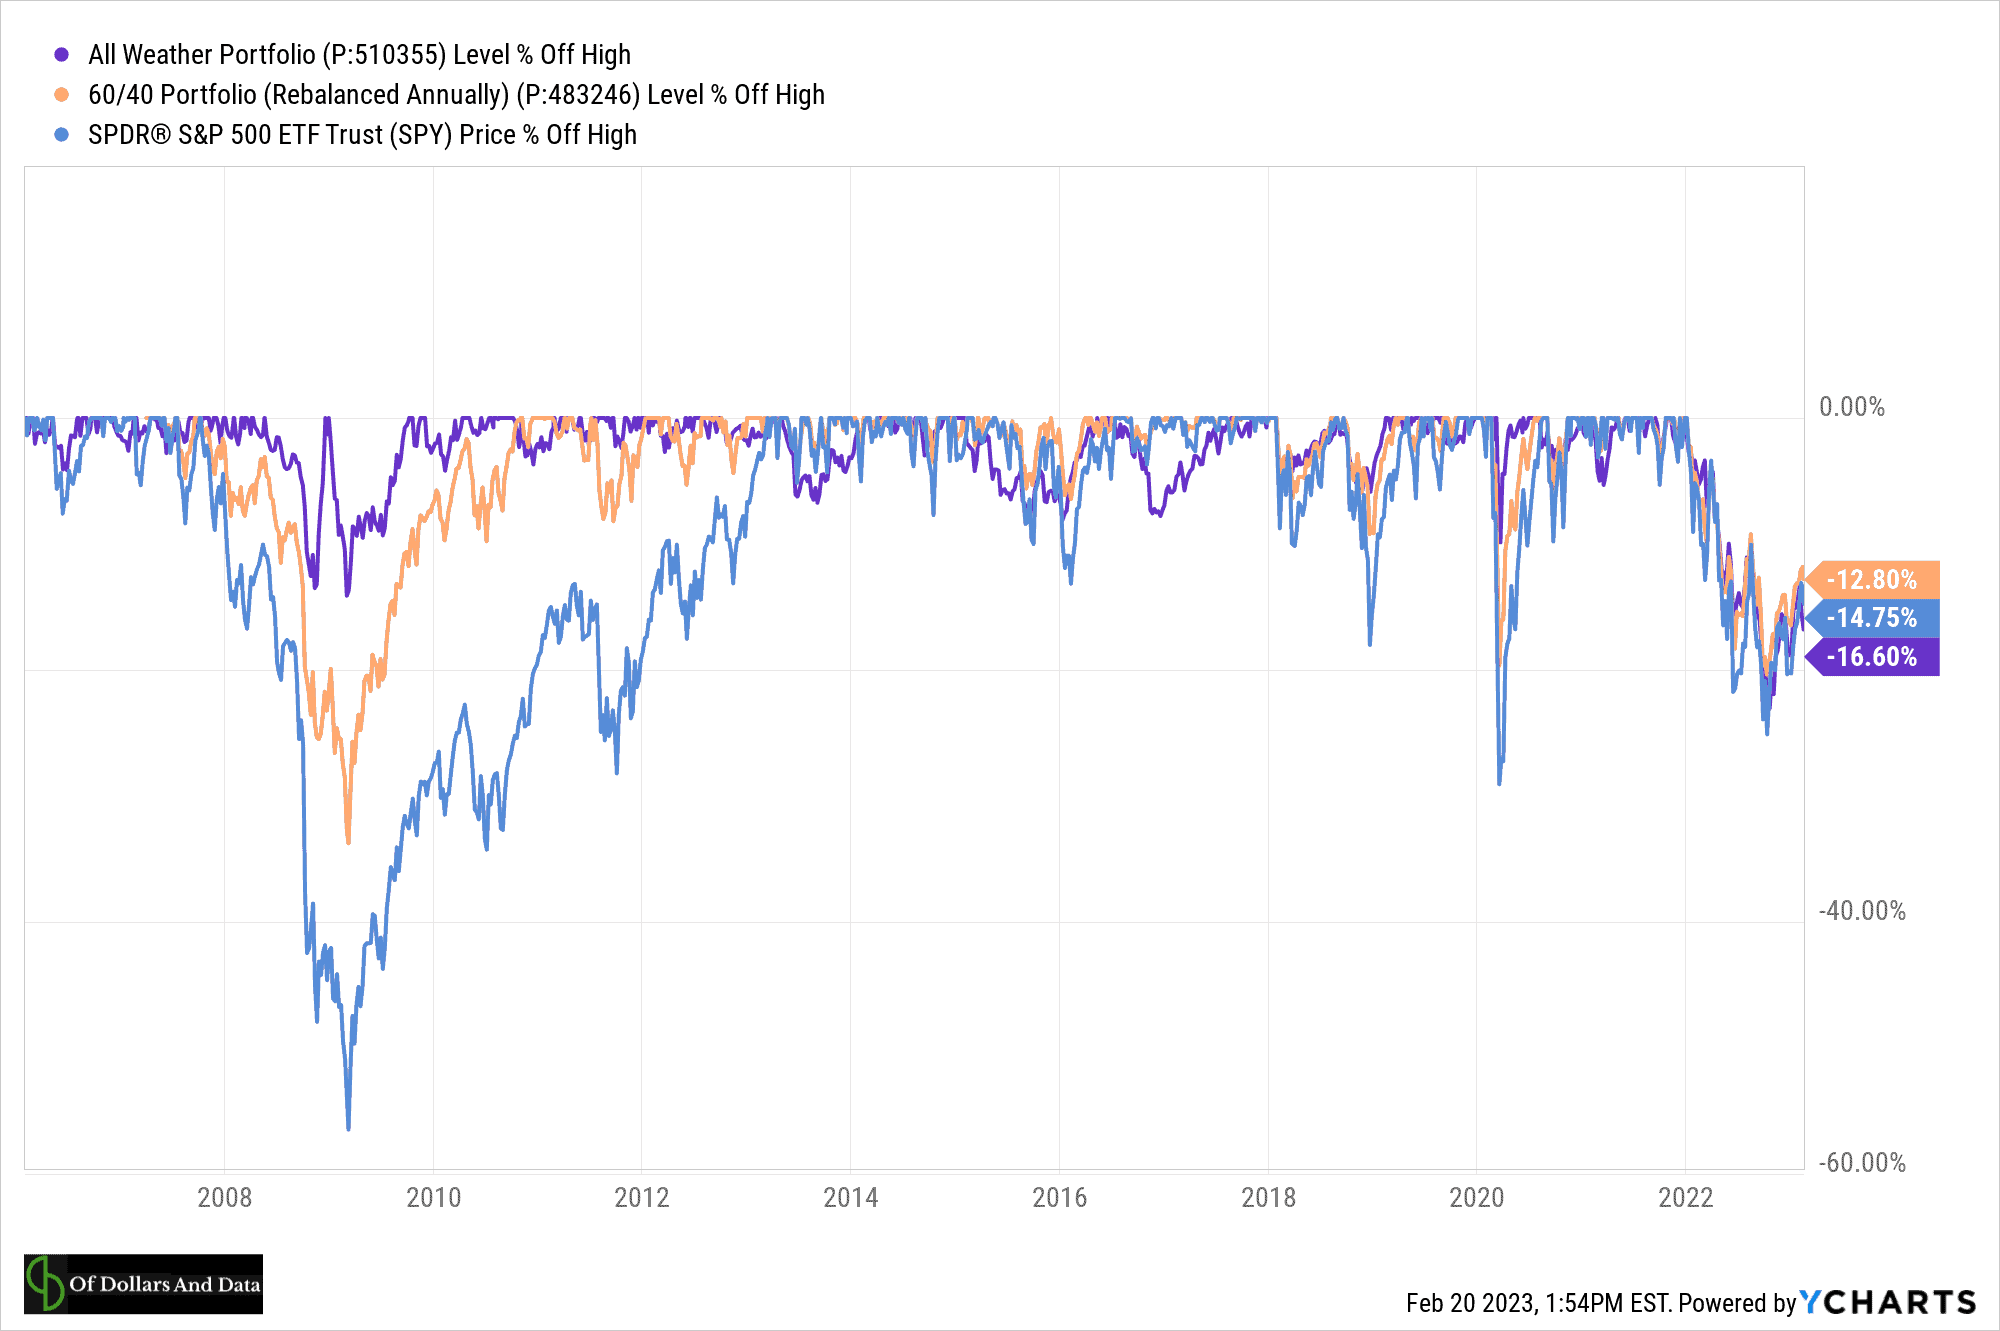
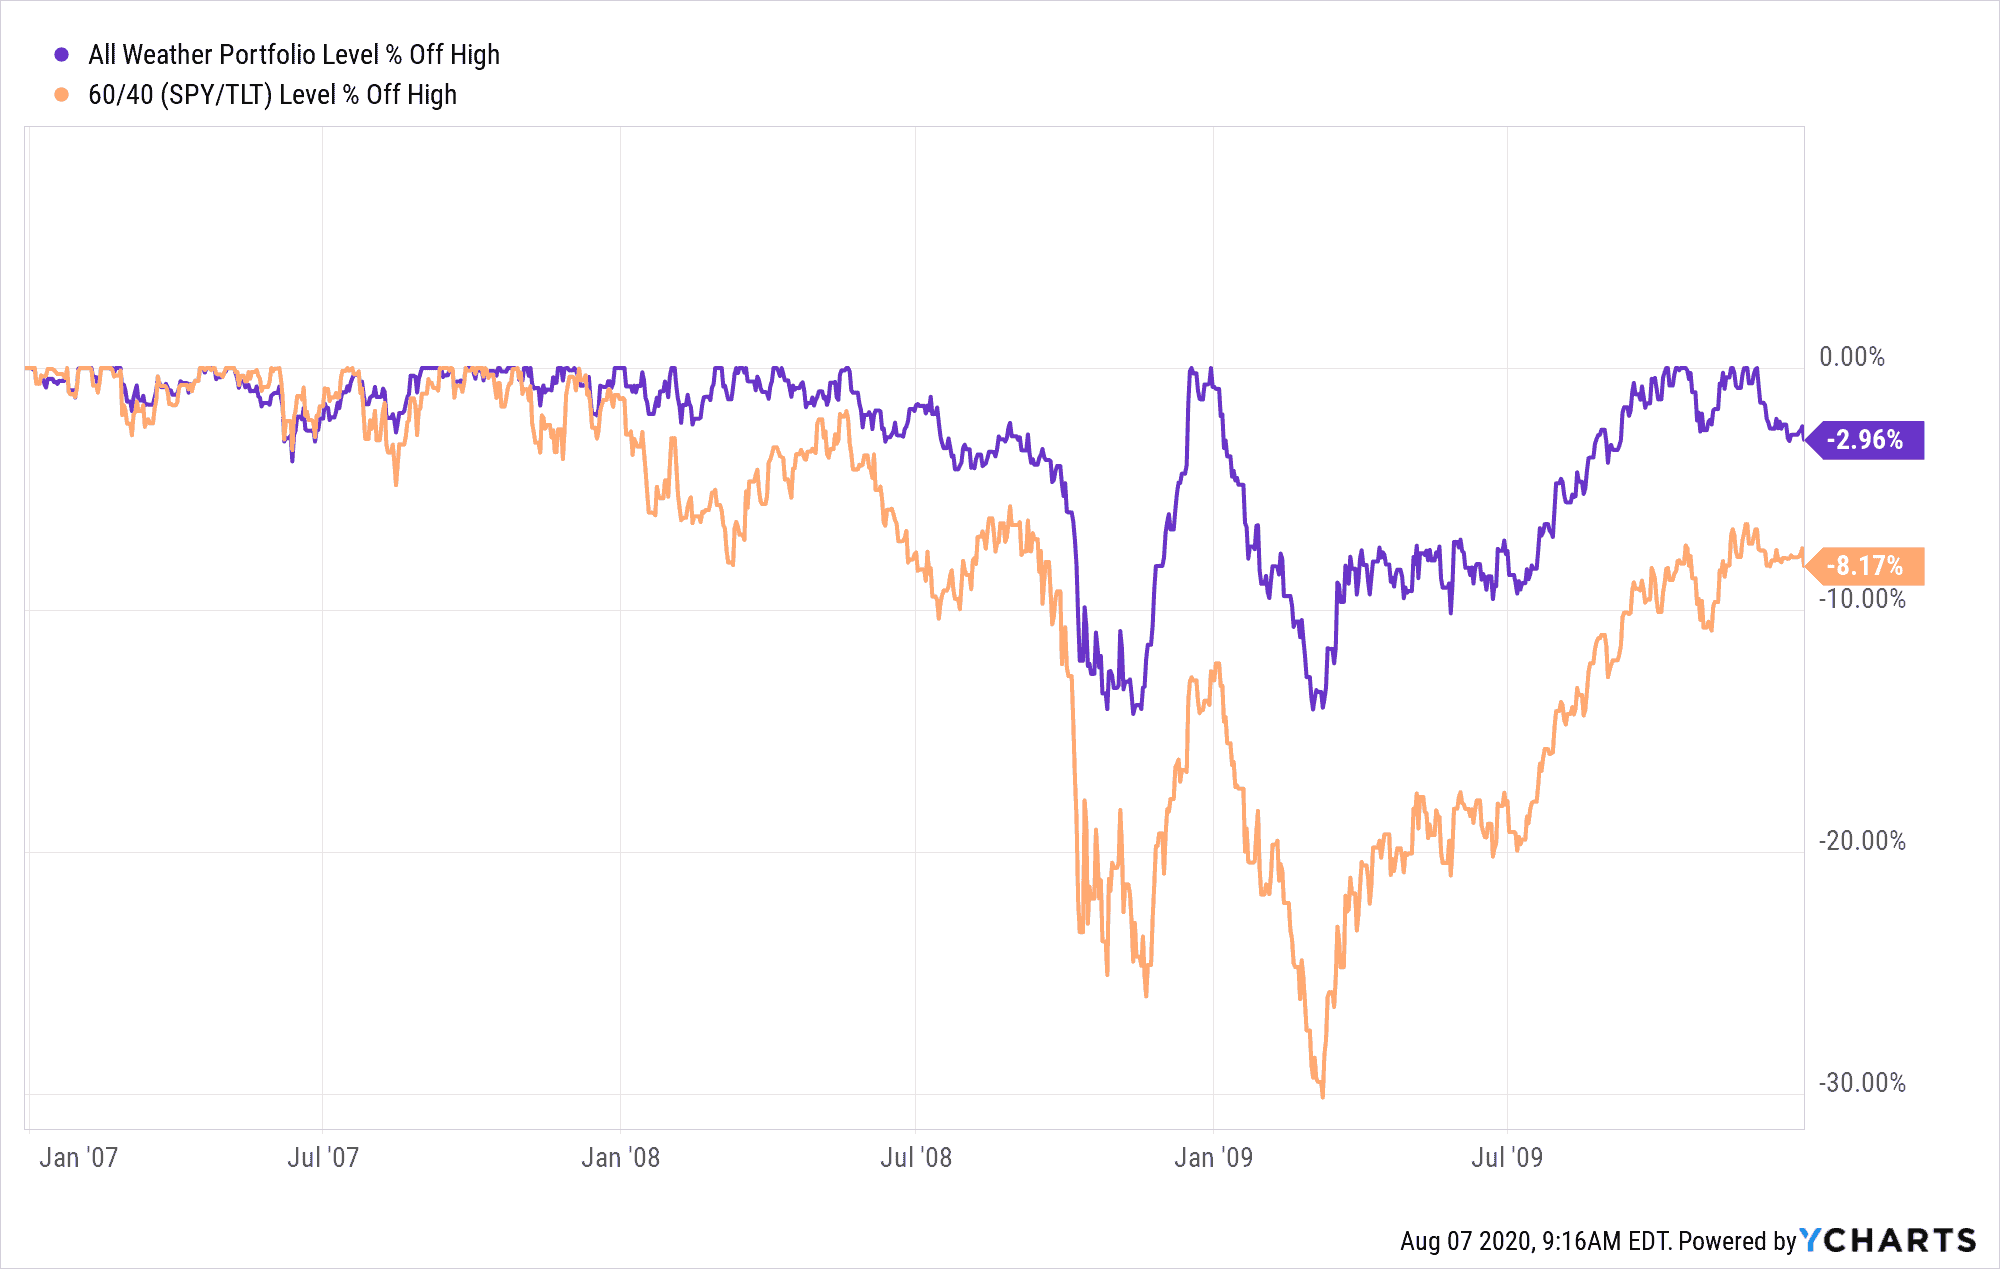
For example, during the Great Financial Crisis, the All Weather Portfolio declined less than half as much as a 60/40 (U.S. Stock/Bond) portfolio:
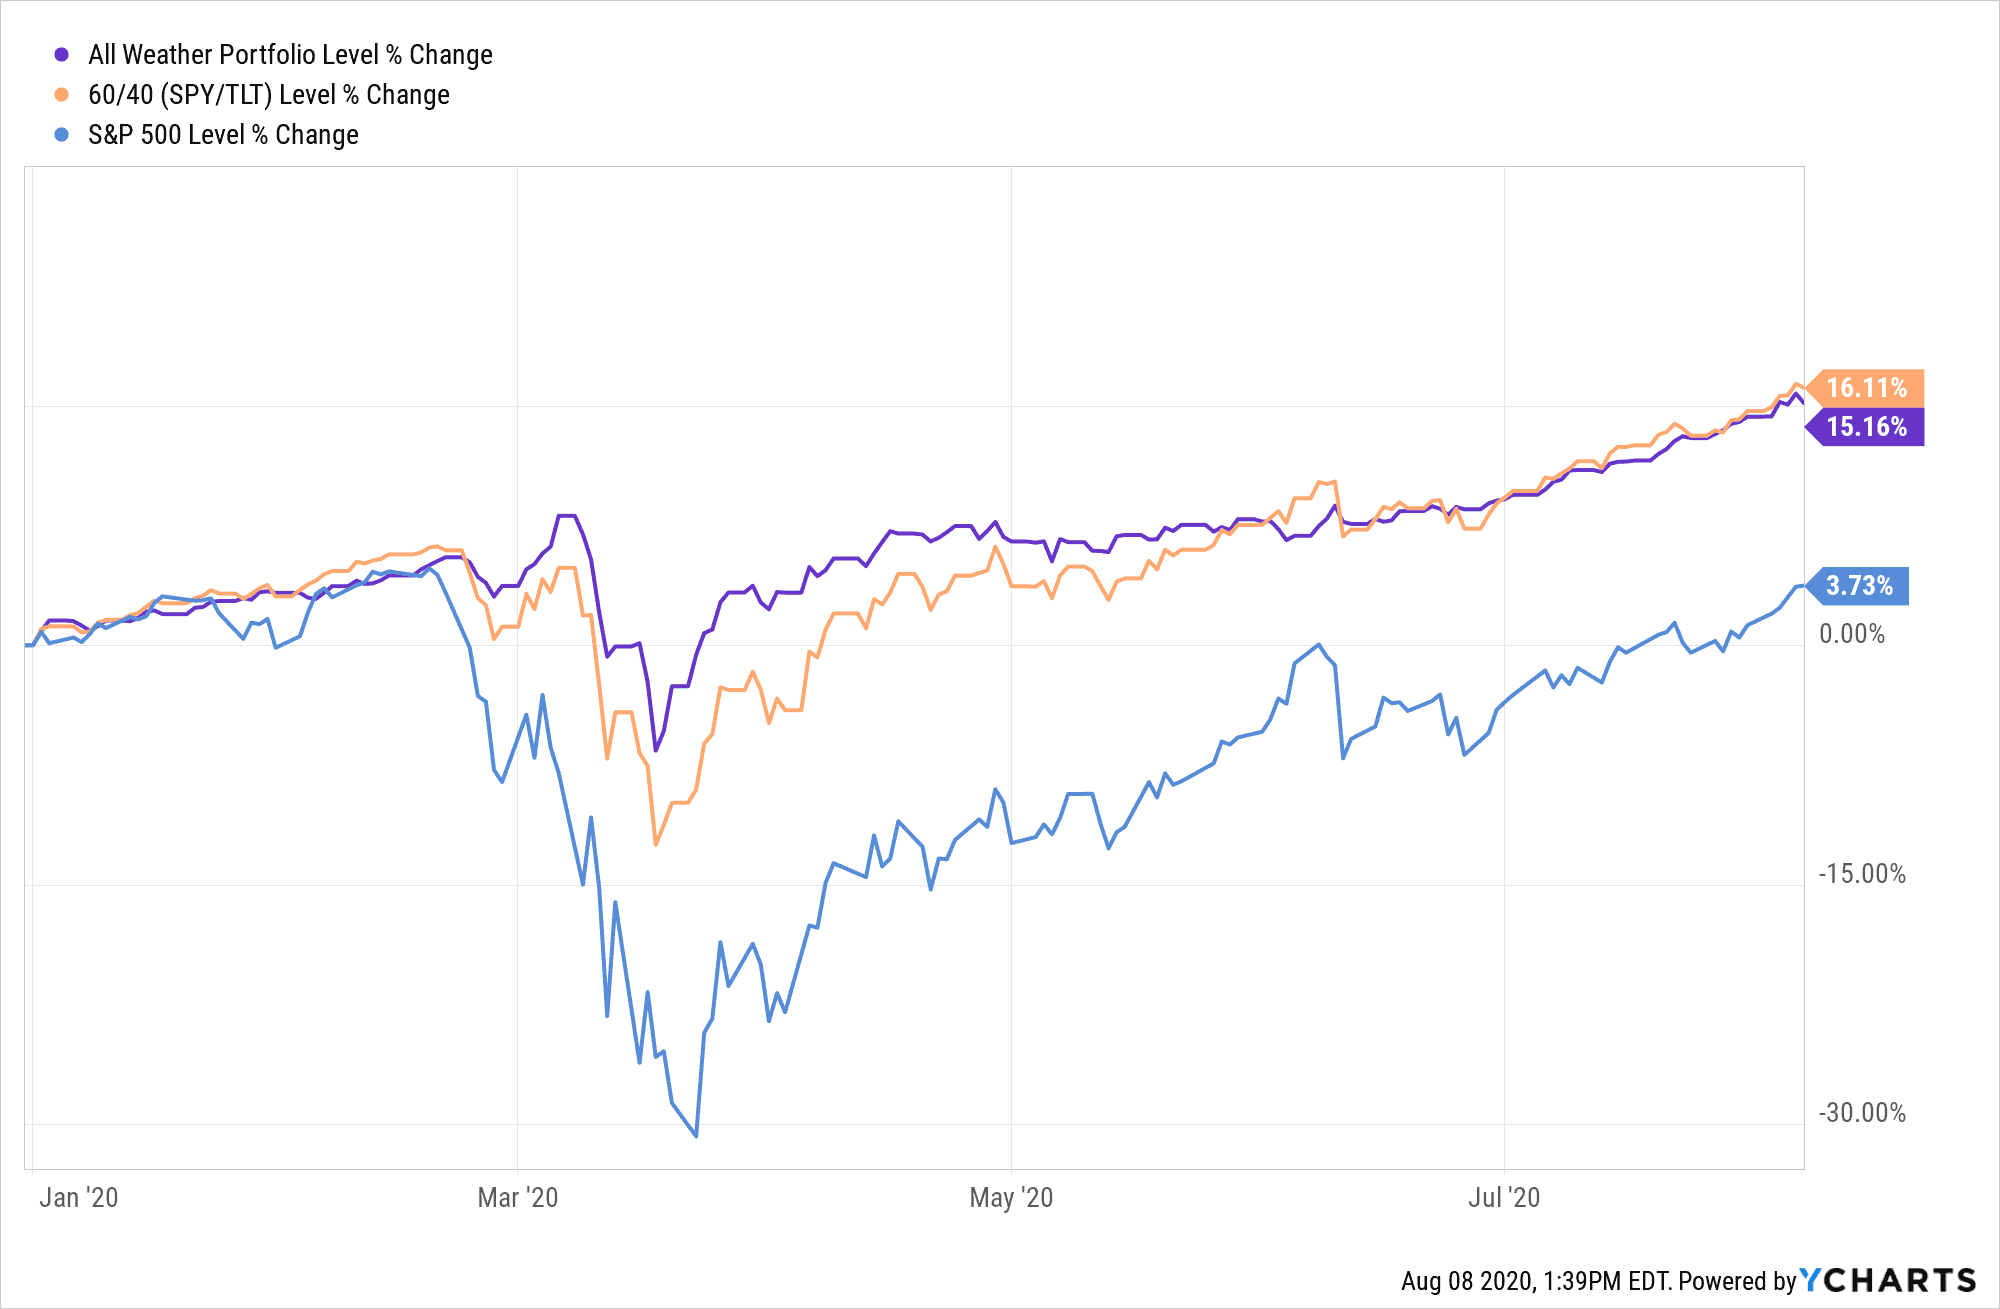
And during the COVID crash in 2020, we saw similar kinds of behavior from the All Weather Portfolio:
This is an impressive result, but the All Weather Portfolio has to give up some growth to obtain it. This is why the All Weather Portfolio underperformed the 60/40 portfolio over most of the last decade:
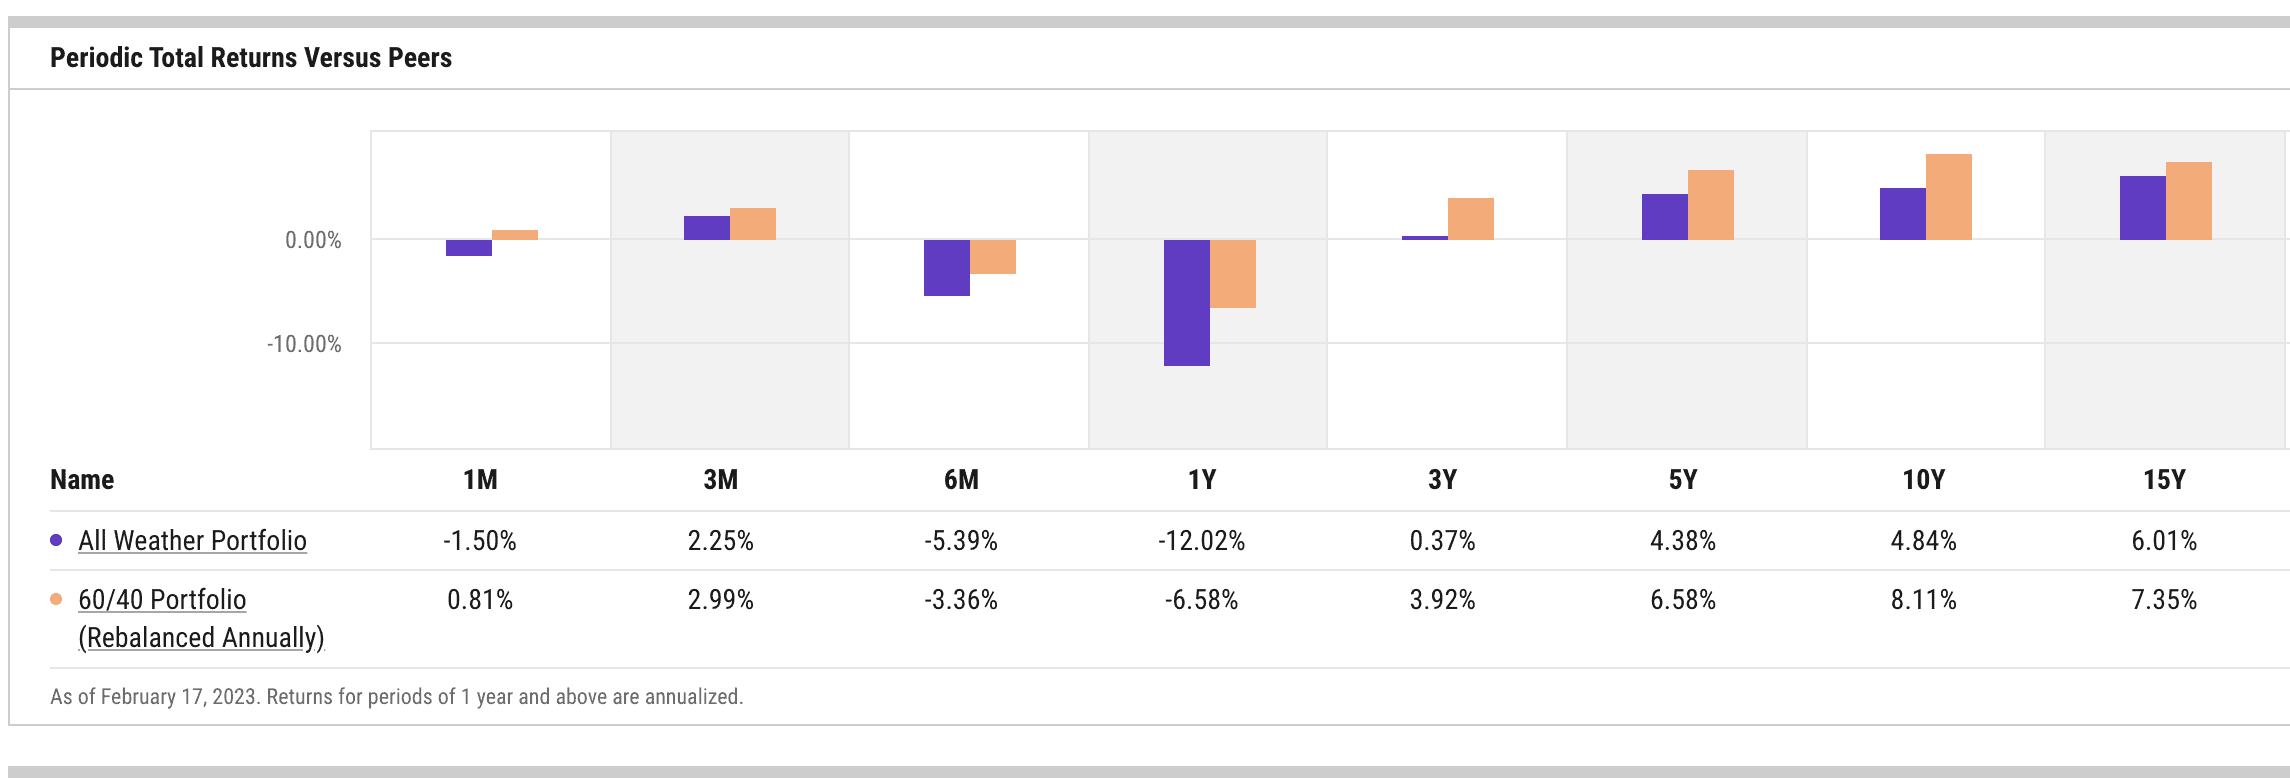
When stocks are providing high returns in a high growth environment, the All Weather Portfolio will underperform since it is only has a 30% allocation to stocks.
However, in environments that are not high growth, the All Weather Portfolio is much more attractive. For example, using data going back to 1973, I found that the All Weather Portfolio outperformed the S&P 500 and the 60/40 portfolio in a high inflation environment (1970s) and a low growth environment (2000s):
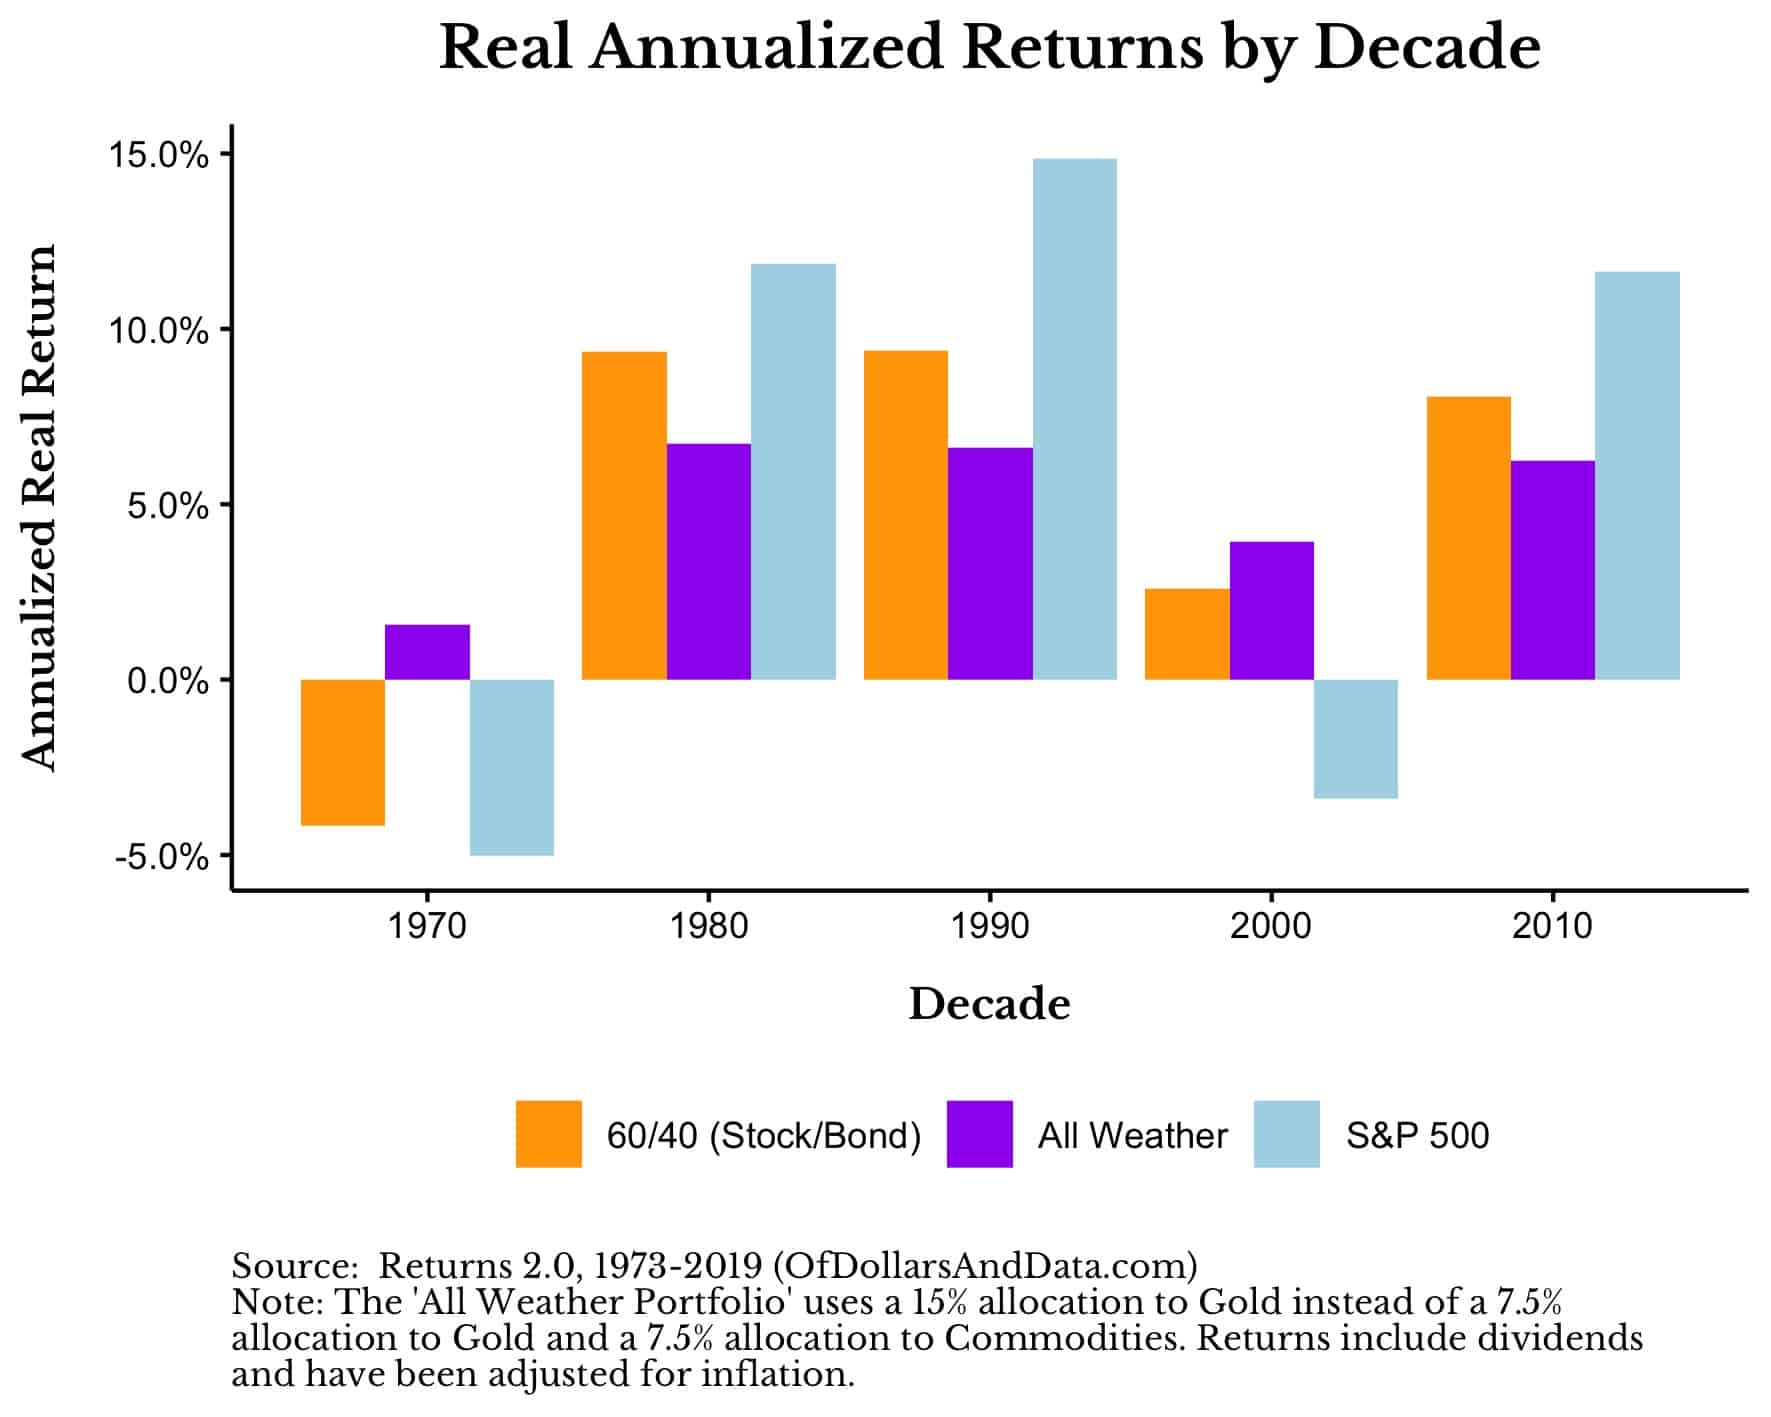
Note that these are showing inflation-adjusted returns, which makes the All Weather Portfolio that much more compelling.
I could continue to overload you with charts and data, but you get the point. The All Weather Portfolio has more dependable real returns and less severe drawdowns than other traditional portfolios. What’s not to love?
Well, before you decide to go all in on the All Weather Portfolio, let me tell you who should not invest in it.
Who Should Not Invest in the All Weather Portfolio?
Despite all of the praise I have piled onto the All Weather Portfolio, I don’t think it is right for two kinds of investors:
1. Those who want high growth
2. Those who obsessively look at the performance of their individual positions
For those investors that want high growth, portfolios with a higher weight to equities tend to outperform over the long run:
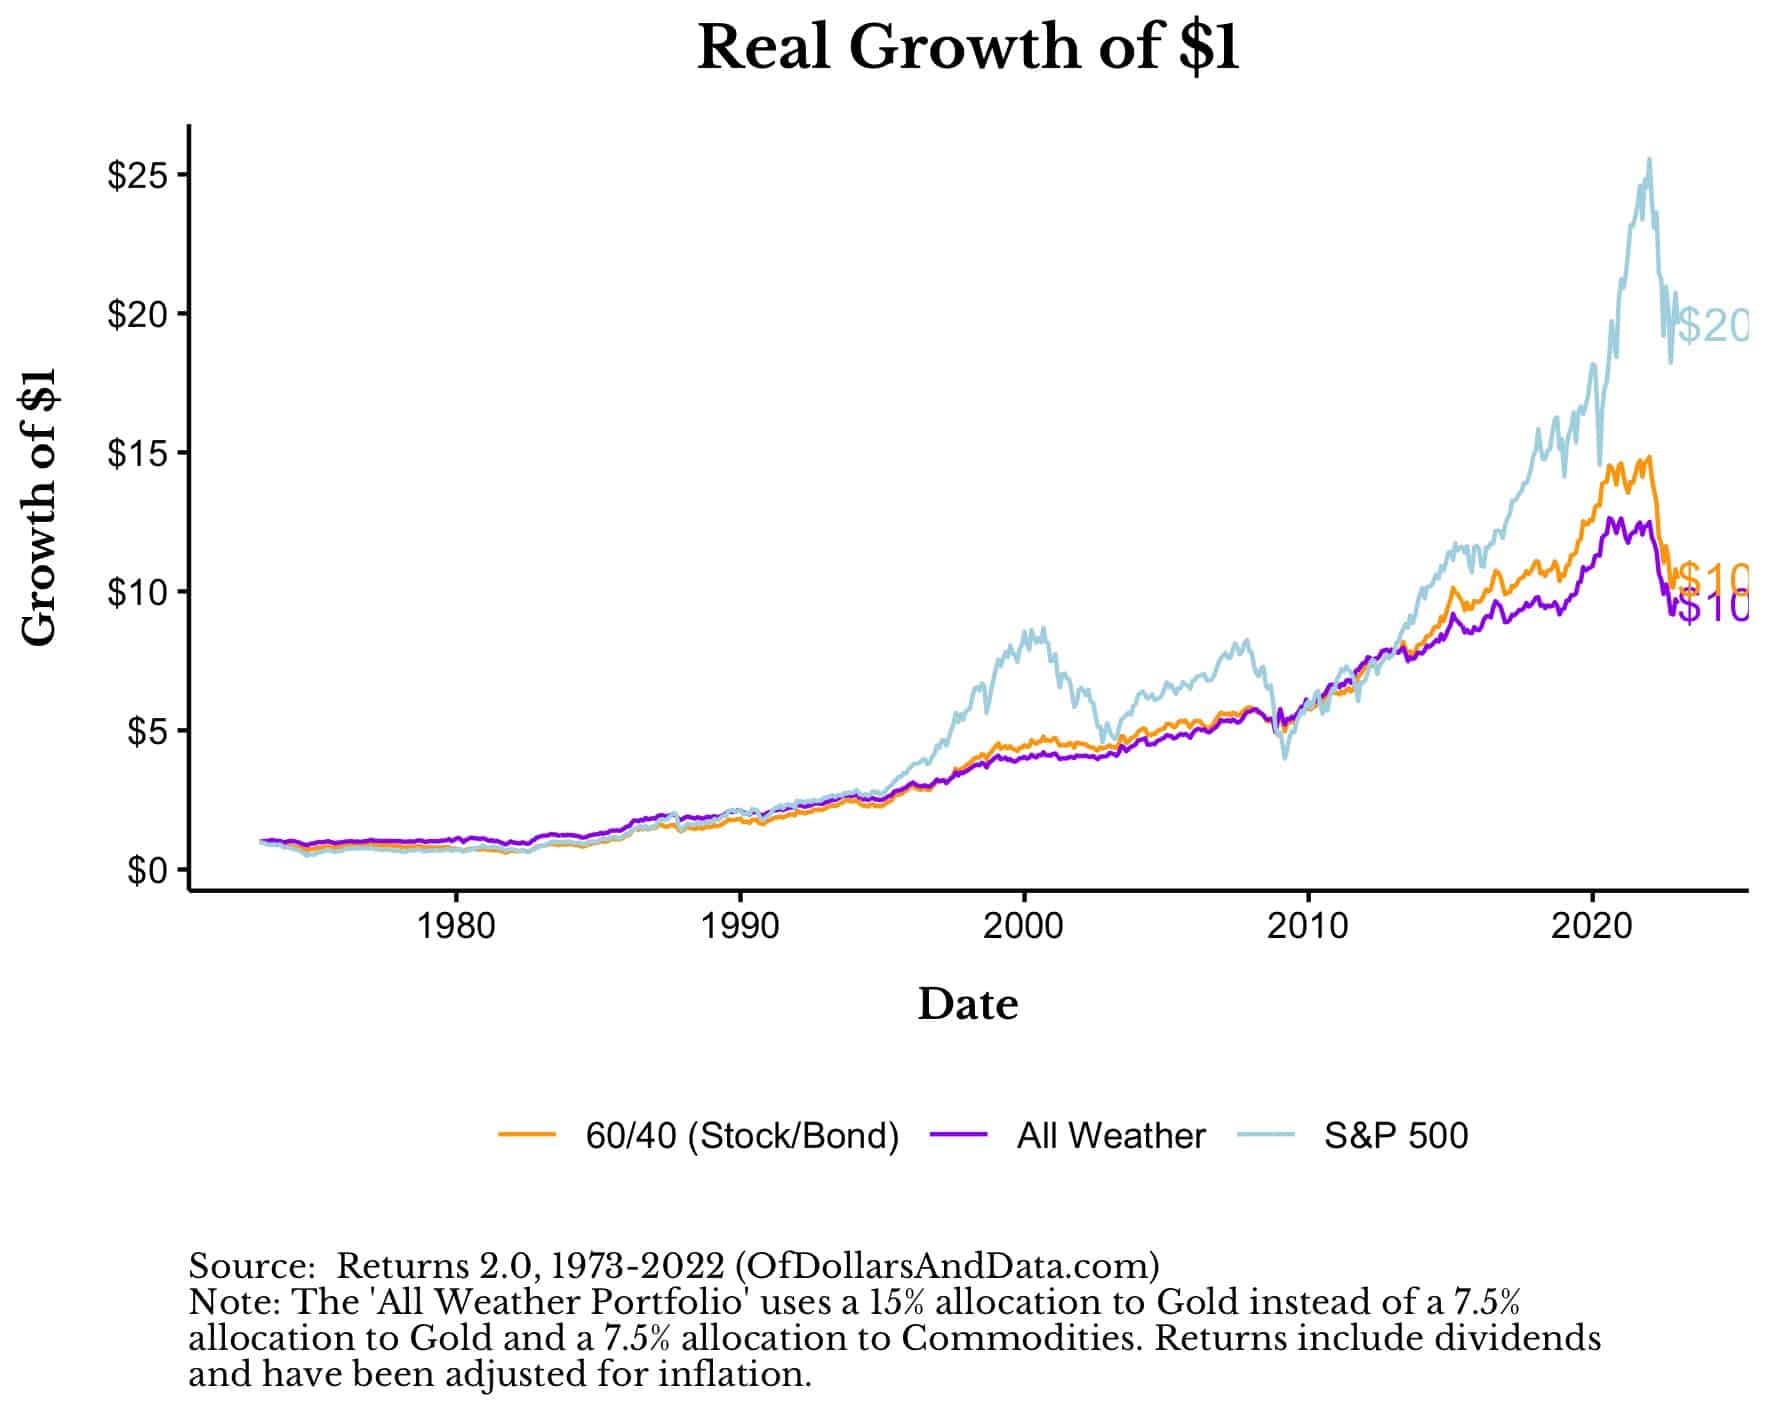
From 1973-2022, the All Weather Portfolio returned 4.8% annually (adjusted for inflation) compared to 6.3% annually (adjusted for inflation) for the S&P 500. That 1.5% is small in the short run, but can add up over very long time frames. For those that require more growth, a higher allocation to equities might be warranted.
For those investors who focus a lot on the performance of their individual positions, the All Weather Portfolio may also not be for you. Why? Because owning assets like gold and commodities ain’t easy. As I have discussed previously, gold can have decades-long drawdowns and can be difficult to stick with as an individual asset.
Just imagine owning gold from its peak in early 1980 and not seeing it reach new all-time highs again until 2008, 28 years later. If you can’t see the big picture of how gold fits into the All Weather Portfolio, then you might want to invest elsewhere.
However, if you can see the benefits of individual assets at the portfolio level and you don’t need to maximize your return, then you might be a good candidate for the All Weather Portfolio.
Who Should Invest in the All Weather Portfolio?
The investors who should consider investing in the All Weather Portfolio are:
1. Those who get very emotional about losing money
2. Those who want a simple and easy way to preserve their capital with decent growth
If you hate losses in the short term, then the All Weather Portfolio has done decently on this front. Since 1973, its only had two periods with drawdowns of greater than 20%, with one of them being recent:
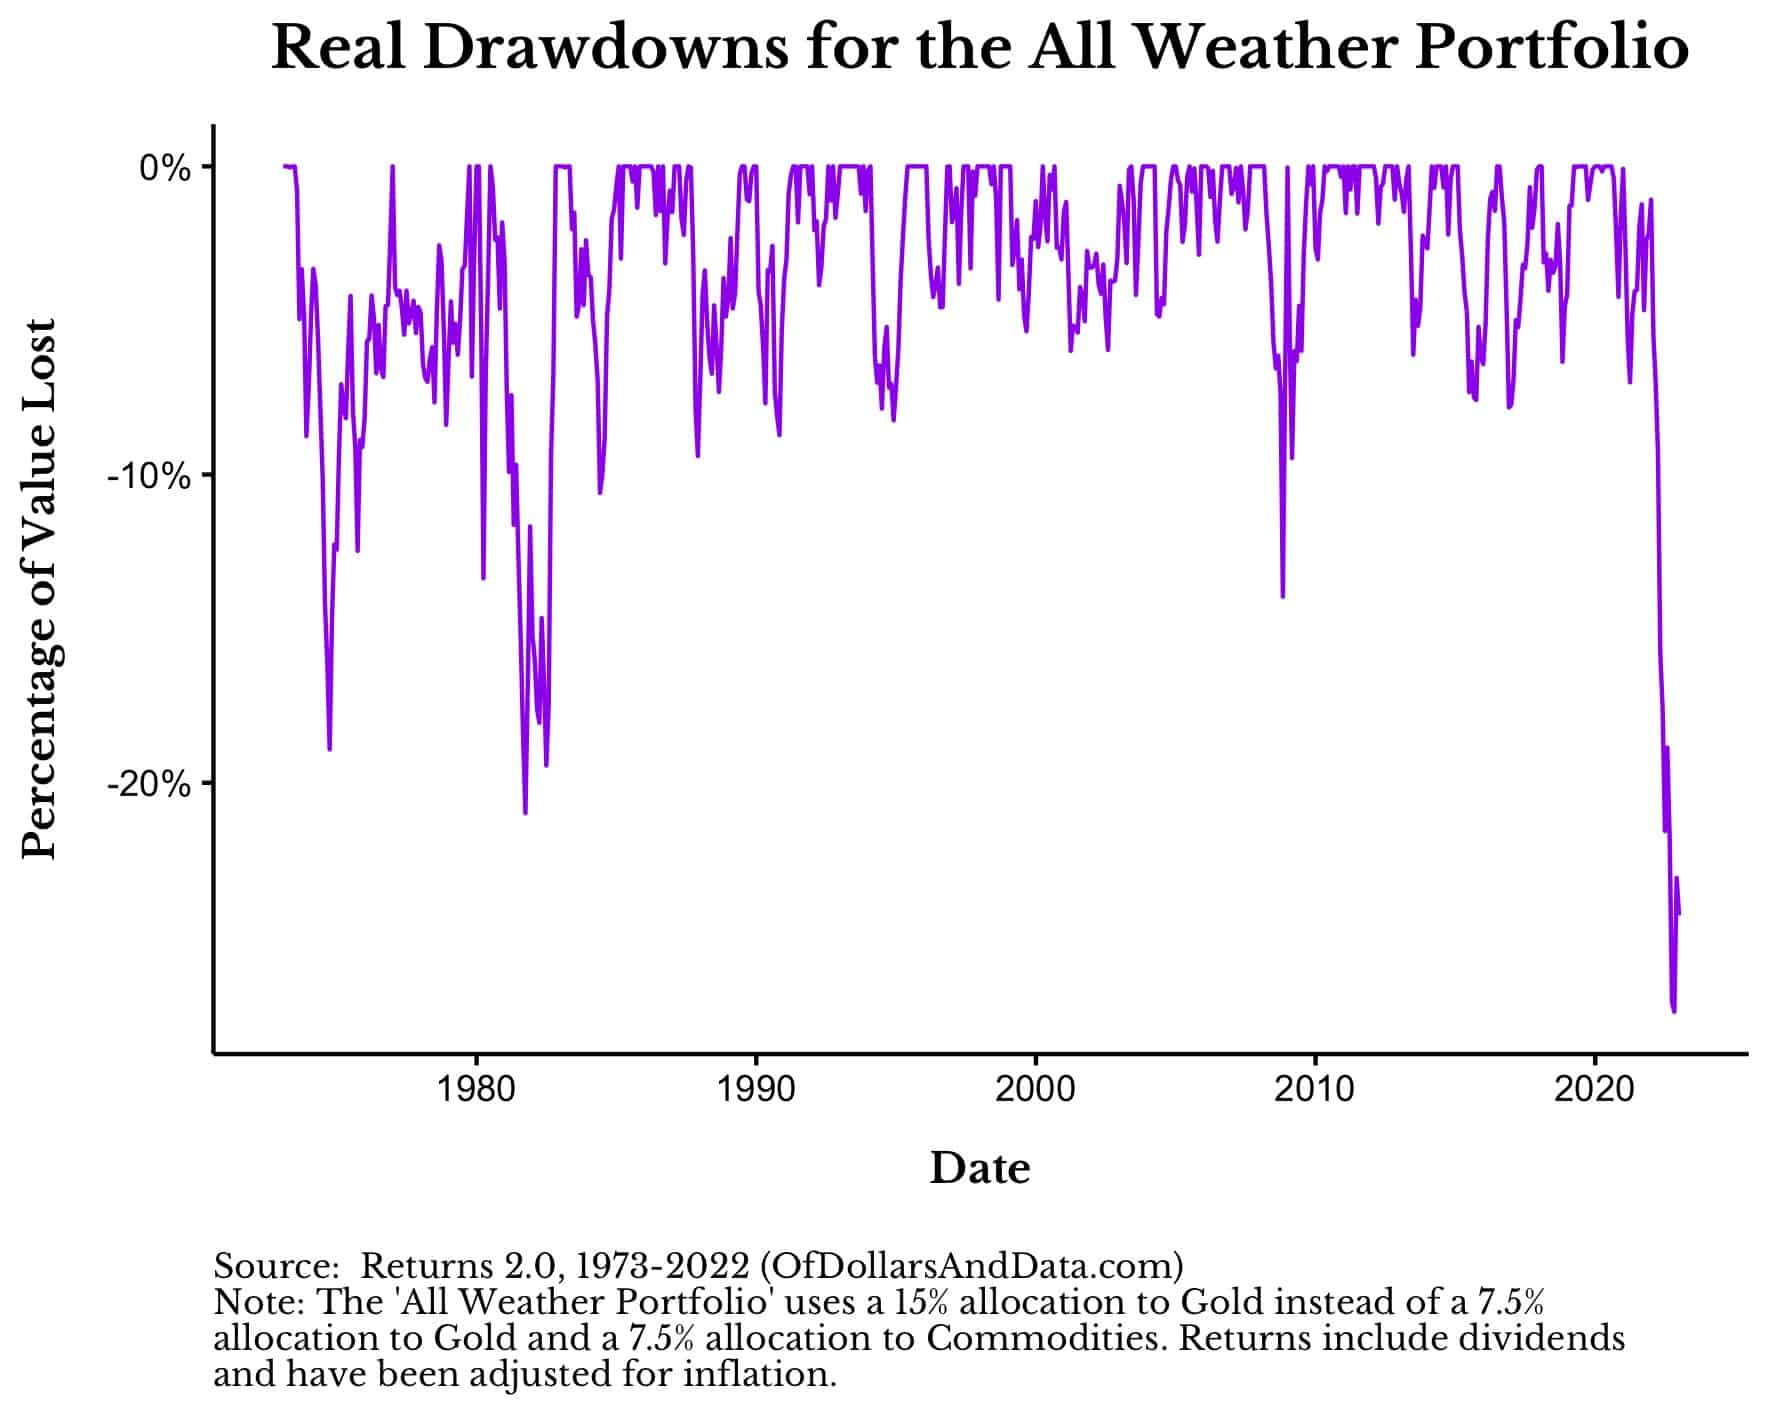
When using daily data, the declines will be larger, but not significantly so. I know 20% might seem like a lot, but compared to most risk assets, this is relatively tame.
At the bottom of the COVID crash the S&P 500 was down 33%. How worried were you then? If a lot, then you definitely might want to consider a portfolio with more stability like the All Weather.
Lastly, for those investors that want a simple and easy to implement portfolio, the All Weather might be right for you. Five funds, rebalanced on some calendar schedule (i.e. quarterly, semi-annually, annually) and you are all set. It likely won’t make you rich, but it likely will prevent you from being poor.
As I illustrated above, $1 invested in the All Weather Portfolio in 1973 would have seen its purchasing power grow 10x through today. This all happened while not losing much more than 20% over half a century.
If this sounds like something you might want to consider, then let’s talk about how you can actually implement it.
How Can You Implement the All Weather Portfolio?
The easiest way to replicate the All Weather Portfolio is through a selection of low-cost ETFs. For example, for only 0.21% a year you can recreate the All Weather Portfolio with:
- 40% TLT (Long-Term U.S. Bonds)
- 30% SPY (S&P 500)
- 15% IEI (Intermediate Term U.S. Bonds)
- 7.5% GLD (Gold)
- 7.5% DBC (Commodities Index)
Do you have to choose these exact funds? Of course not.
Maybe you want to choose a total U.S. stock fund or a global stock fund over just the S&P 500. That’s fine, as long as you have roughly 30% exposed to equities. The same goes for global bonds vs. U.S. bonds. I prefer U.S. bonds only because I think they are safer, but that assumption may not hold in the future.
The nice thing about this ETF implementation is that it can be done through any brokerage firm. Even Robinhood investors can put some of their capital into the All Weather Portfolio while they let the rest ride on individual stocks. Of course, I don’t recommend individual stocks, but to each their own.
Lastly, after allocating your money in these proportions, you will still need to rebalance back to these allocation weights at least annually. Rebalancing frequency doesn’t matter all that much so if you want to do quarterly rebalancing you can, but I would do annual rebalancing out of simplicity.
Once you’ve done all that, then you are good to go. If history is any guide, your All Weather Portfolio should provide far more consistent growth with less volatility than most other portfolios. Now you can sit back and worry about all the non-investment things life throws at you.
Happy investing and thank you for reading!
If you liked this post, consider signing up for my newsletter.
This is post 198. Any code I have related to this post can be found here with the same numbering: https://github.com/nmaggiulli/of-dollars-and-data

