Retirement. The Nobel Laureate William Sharpe called it the “nastiest, hardest problem in finance.” And it is. Between deciding how much to save and spend throughout your life, you also have to make guesses about the future.
What will inflation be? How long will I live? What kind of returns will assets provide? And the list goes on.
Despite this complicated process, the financial aspect of retirement planning boils down to three things:
- How Much You Save Before Retirement. This is a function of the number of years you decide to work, your income, and your savings.
- Asset Allocation. This is a function of how you invest your savings and how much risk you want to take.
- How Much You Spend in Retirement. This is a function of your total savings and your future spending, inflation, asset returns, and lifespan.
This might seem daunting, but, if you make just a few simplifying assumptions, you can eliminate most of these choices. For example, you have no control over future asset returns and inflation and limited control over your lifespan. So, if we assume those are out of our hands, then retirement comes down to your savings rate and asset allocation. That’s it.
But, even these two choices are very different. Your savings rate is constantly in flux, being impacted by financial decisions small and large throughout your life.
You can stay in or you can eat out. You can take transit or you take Uber. You can buy or you can rent. All of these choices, and more, will have varying degrees of impact on your retirement success.
However, your asset allocation (i.e. how much risk you take) is one decision that you make that will have the greatest impact on your finances for the least amount of effort.
Because all of those thousands of other financial decisions that you will make across decades will require far more time and energy than deciding what you invest in. Because once you are invested, the compounding should take care of itself.
This is why asset allocation is by far the easiest retirement choice you can make. Let me illustrate this with a simulation. To start, we need to assume the following:
- Before Retirement
- You work and save money for 40 years (i.e. assume you start saving at 25 and retire at 65).
- Your annual income starts at $50,000 and grows with inflation.
- You save X% (this will vary) of your income each month and re-invest it in some portfolio.
- Your saved money goes into a portfolio consisting of some mix of U.S. Stocks and Bonds (this will vary).
- In Retirement
- You live for 25 years (i.e. assume you retire at 65 and die at 90).
- Your spending is identical to what is was when you were working (constant in real dollars). So if you saved 10% of your income each year, this implies you lived off of 90% of your income. In retirement you would be spending 90% of your final income (indexed to inflation) each year.
- Your nest egg is invested in whichever portfolio you invested in before retirement (this will vary).
If we were to start this simulation in 1926 and go through every possible 65 year period (i.e. 40 working years + 25 retirement years) and finish in 2018, we would have 28 different retirement simulations we could test (thanks to Michael Batnick for the idea).
Of course this is simplified, but it will illustrate my main point. First I will walk through an example of one simulation and then present the full results.
Example Walkthrough
Let’s say you started working in 1926 with an income of $50,000 (yes this was a lot of money then, but the starting income is arbitrary for this). By the time you retired in 1966, your real income was identical, but your nominal income would have grown to $89,000 due to inflation.
If you saved 10% a year over this time period, you would have saved a total of ~$240,000. If you had invested in:
- 100% Bonds you would have $382,000 when you started retirement.
- 60/40 Stock/Bond you would have $1.6 million when you started retirement.
- 100% Stocks you would have $3.7 million when you started retirement.
In your first year of retirement you would have spent $80,000. This represents 90% of your final income (i.e. 100% – 10% savings rate). With such spending, your portfolio would run out of money in 5 years with 100% Bonds, in less than 20 years with 60/40 Stock/Bond, and would not run out in 25 years with 100% Stocks.
This example shows the power of asset allocation to have a dramatic impact your chance of financial success in retirement. That one decision made near the beginning of your working life (and stuck to throughout) can have an impact equal to your savings rate with far less effort.
Full Results
Now, let’s do the same simulation for all 28 periods we have available. Below is a chart of the portfolio values at the start of retirement (for the 100% Bond, 60/40 Stock Bond, and 100% Stock portfolios) based on the year you started retirement for each simulation. Note that the leftmost points (i.e. retire in 1966) were covered in the example above:
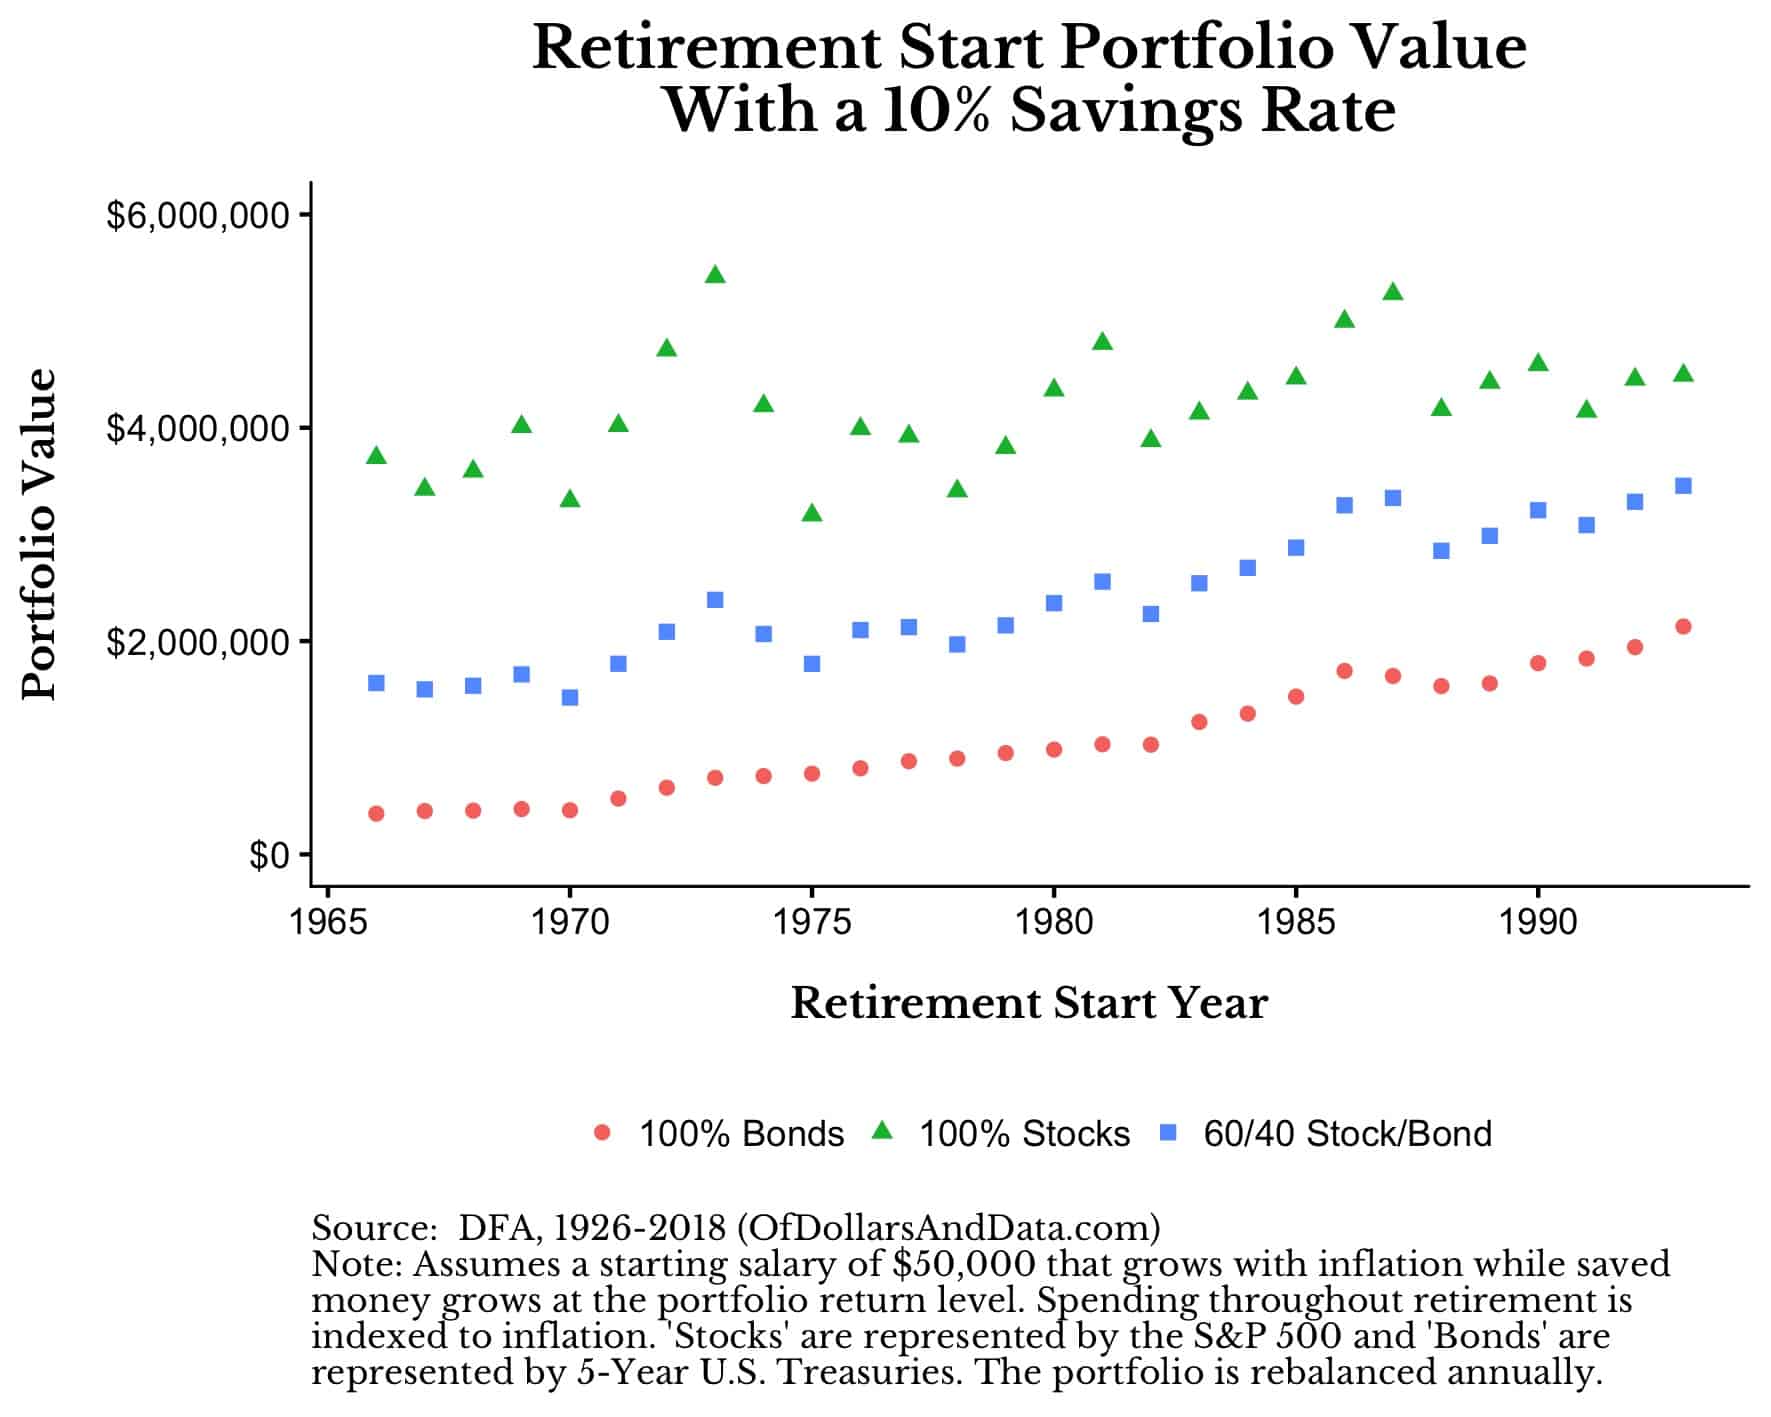
As you can see, the asset allocation decision can make a large impact on your final portfolio value. The spread you see between the 100% Stock portfolio and the 100% Bond portfolio shrinks over time because of how those assets performed over the years.
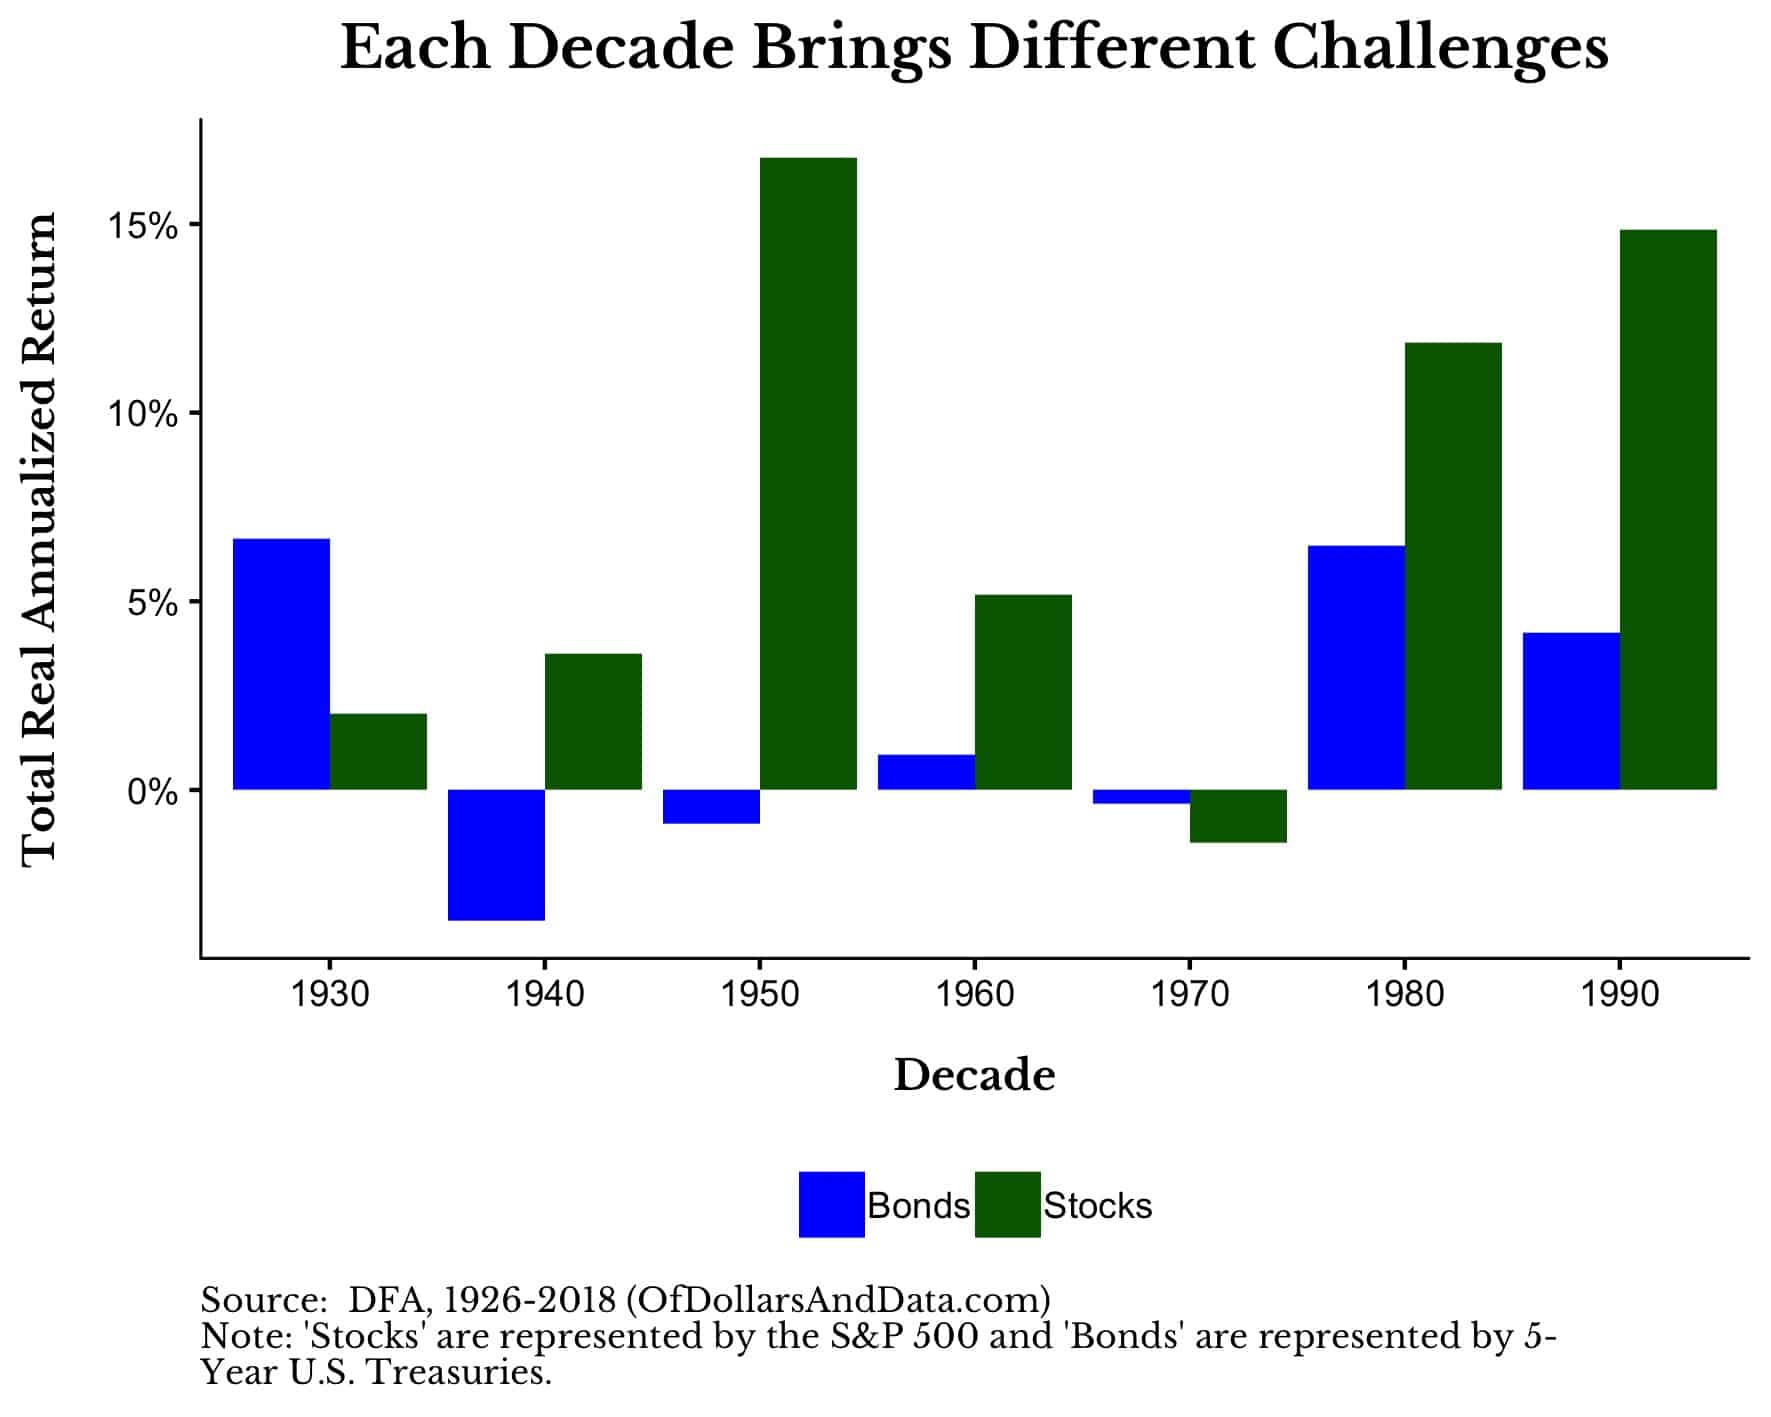
The main takeaway is that stocks completely dominated bonds for most of the twentieth century. For example, bonds did quite poorly from the 1940s-1970s, but started to do much better in the 1980s-1990s:
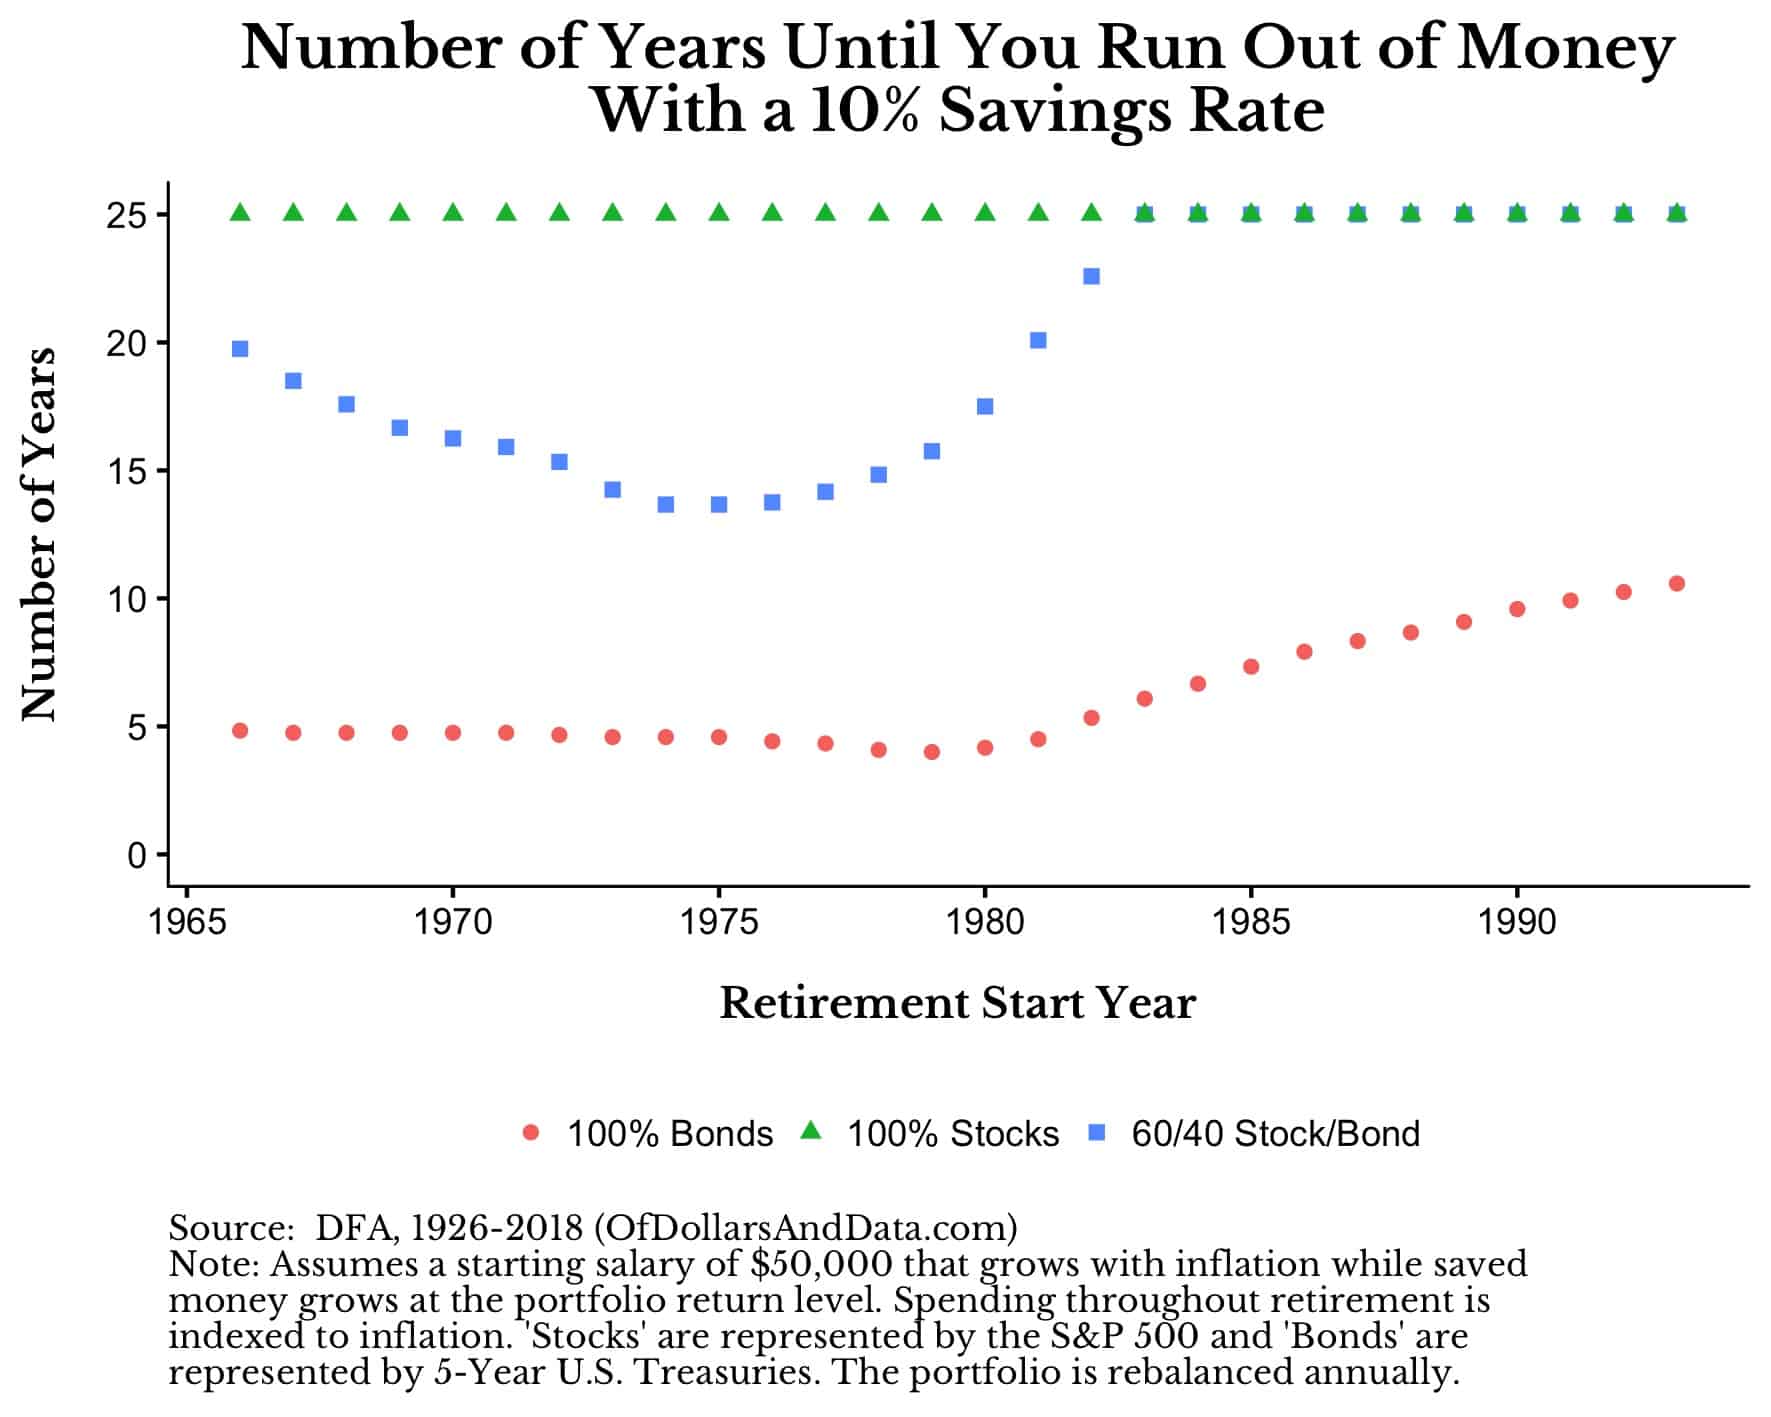
These disparities in returns will also show up in the simulations when looking at the number of years until you run out of money. The plot below has color/shape for each portfolio and the number of years until that portfolio ran out of money based on the retirement start year. If a particular point is at the top of the chart (i.e. 25 years) that means that simulation did not run out of money.
For example, as I highlighted in the “Example Walkthrough” above, if you started retirement in 1966, your portfolio would run out of money in 5 years with 100% Bonds, in less than 20 years with 60/40 Stock/Bond, and would not run out in 25 years with 100% Stocks. This plot is just expanded to show if you retired in 1967, 1968, and so on:
But, we can take this a step further by varying the savings rate over time (from 5% to 20%) and watching how that affects the number of years until the portfolios run out of money:
As you can see, your savings rate will make a big difference in whether you run out of money in retirement, but so does your asset allocation. With a savings rate as low as 13%, the 60/40 portfolio never runs out of money in any of the simulations. Compare this to the 100% Bond portfolio which still runs out of money in some cases with a 20% savings rate!
However, moving your savings rate upward is no easy task. It requires decreased spending or increased income, both things that are not necessarily easy to do. On the flip side, it is also not necessarily easy to bear more risk in your portfolio (i.e. going from 100% Bonds to a 60/40 portfolio), but as Corey Hoffstein so famously repeats:
Risk cannot be destroyed, only transformed.
So, by taking less risk now (i.e. 100% Bonds) you actually take more risk later (i.e. running out of money in retirement). So the question is: Do you want to work your butt off to increase your savings rate, or would you rather take the easy way out and take a little more short-term risk?
The Hardest Choice in Retirement
Despite all of the discussion of the financial choices you need to make for retirement, it’s actually the non-financial aspects of retirement that are the hardest to figure out.
As I have written before, the most important decision you can make in your retirement is how you are going to spend your time, not your money. Many people end up retired and lose their sense of purpose despite having sufficient financial resources.
Though this may seem unrelated, this is also my biggest problem with universal basic income (including sovereign wealth funds). These systems provide money, but they don’t provide any sense of fulfillment for those that receive that money. With the recent increase in deaths of despair in the U.S., figuring out how to give people income and meaning may be one of the most important problems we can try to solve in society.
Though I don’t have an easy answer for how to help you find meaning in your life, I recommend that you create something and give back to a community. Also consider reading How to Retire Happy, Wild, and Free, a retirement book that can help anyone tackle the issue of meaning before and during retirement. It’s the best retirement book I have ever read and it has zero discussion of money.
Lastly, for all of those that have been following along, you may have noticed that my most recent posts have far more data and far fewer stories. I am going back to my roots and hope you stay along for the ride. As always, thank you for reading!
If you liked this post, consider signing up for my newsletter.
This is post 113. Any code I have related to this post can be found here with the same numbering: https://github.com/nmaggiulli/of-dollars-and-data

