Assume I flip a coin 5 times and get the following result (let H = heads and T = tails):
HHHHH
What is the probability that my sixth flip is also a heads (H)? Assuming the coin is fair (equal likelihood of heads and tails), you already know that the answer is 50%. Because coin flips are an independent process, prior flips have no bearing on future flips.
But it doesn’t feel that way does it? Even if you understand the basics of probability, after seeing five heads in a row, it can feel like a tails is “due” even though you know better. This feeling is known as the gambler’s fallacy and explains why it is hard for humans to understand random processes.
Investors have a similar problem when it comes to thinking about future market returns. I call it the investor’s fallacy. But what makes the investor’s fallacy more difficult than the gambler’s fallacy is that markets are not an independent process. What happened yesterday can affect what happens today.
This explains why the very best days in the market and the very worst days tend to occur near each other. The same logic goes for what happened last week, last month, or last decade.
Because of this interdependence of market returns, it is easy for investors to convince themselves that markets can be due for good or bad years. And with the stellar performance in U.S. markets over the previous decade, it feels like a correction is warranted.
However, if you examine the data you will realize that this thinking is just as flawed as the person expecting a tails after seeing five heads in a row. There is little to no relationship between prior 10-year returns and growth over the next 10 years.
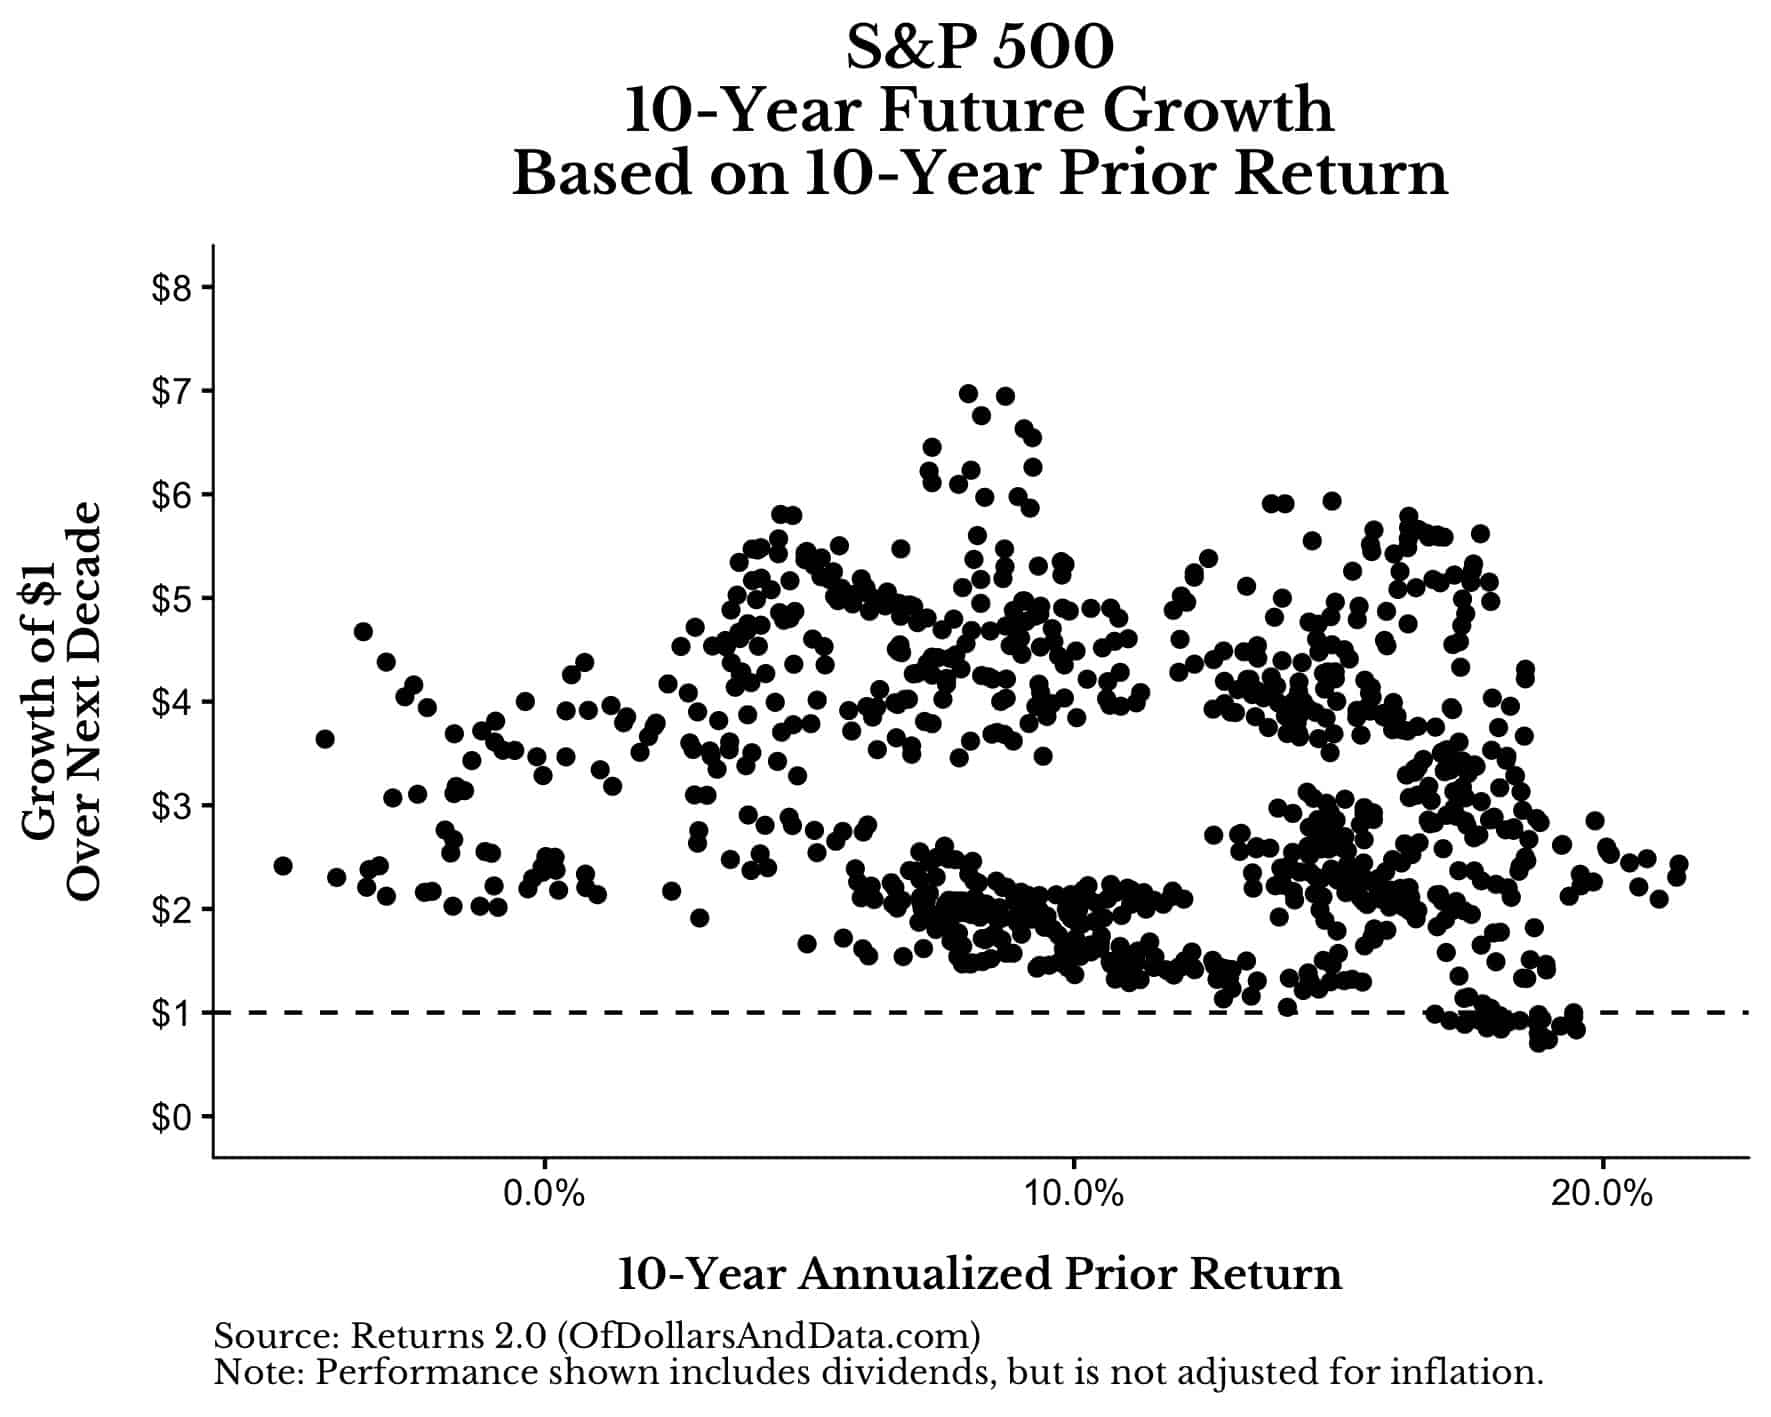
For example, if you look at how the S&P 500 performed over its prior 10-years (starting in 1936) and then look at how it grew in the future, you won’t see much of a pattern (note: if the GIF below isn’t loading, give it time, or you see this Tweet):
If we pause this graphic to single out prior 10-year returns and future 10-year growth, it’s hard to see any relationship. The correlation between prior 10-year returns and future 10-year growth is only -.19 (slightly negative):
But what does this tell us about where we are now? From 2010-2019, the S&P 500 compounded at a rate of 13.4% a year (including dividends, but not adjusted for inflation). Historically, markets that compounded at that rate for the prior 10 years had growth ranging between 1.1x and 5x over the next decade (aka it was all over the place):
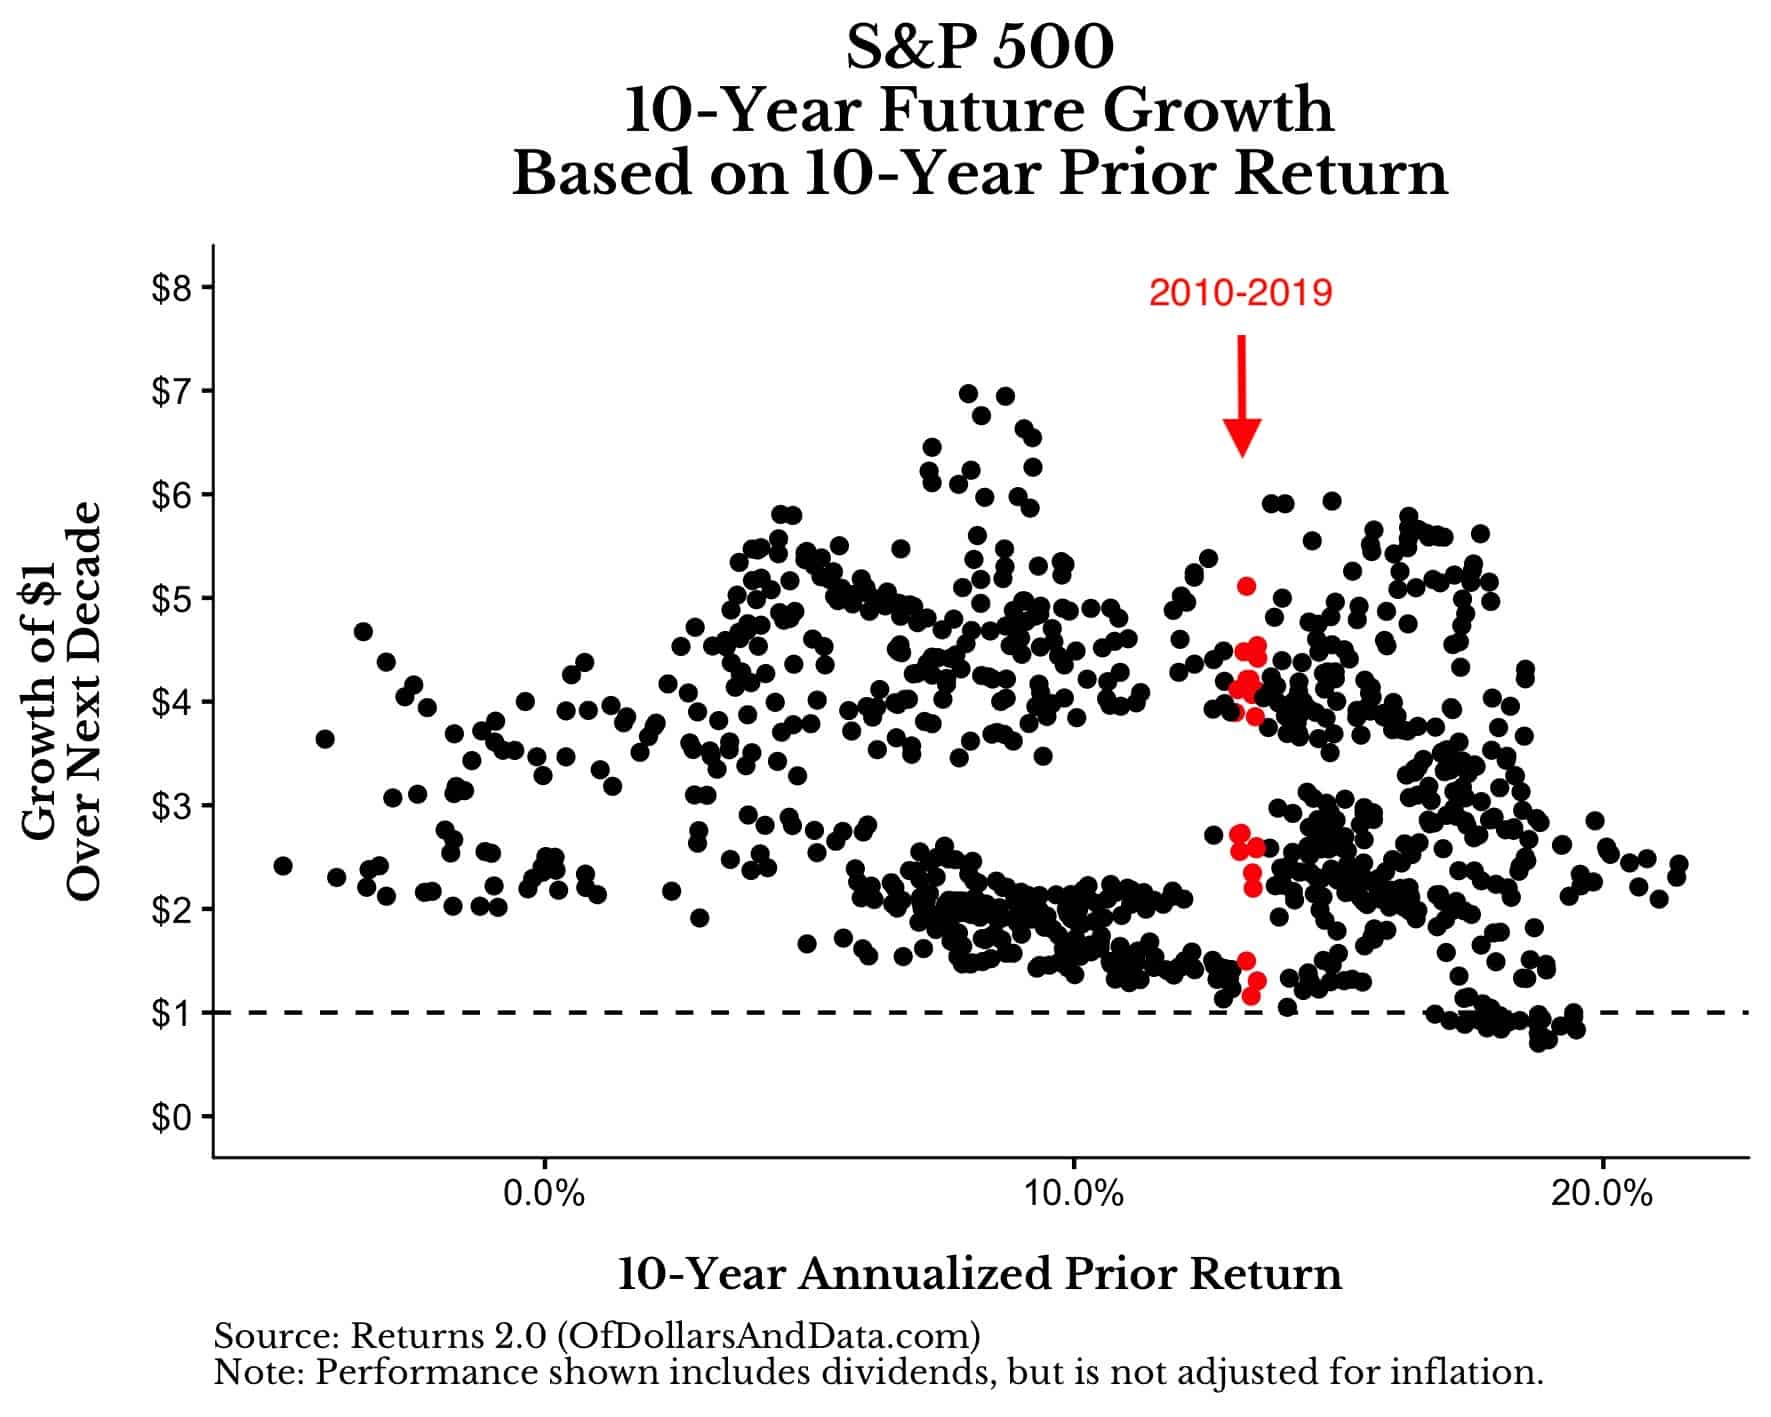
Those red dots represent historical months within the same range of where we are today. I have no idea what U.S. markets will return over the next 10 years, and history seems to suggest the same thing.
And while the prior 10 years show little to no relationship with future returns, this is not necessarily true if we look at returns over the last 20 years. Typically, if U.S. markets did well over the prior 20 years, they did poorly in the next 10 years, and vice versa.
You can see this relationship clearly here (note: the correlation in this plot is -0.83):
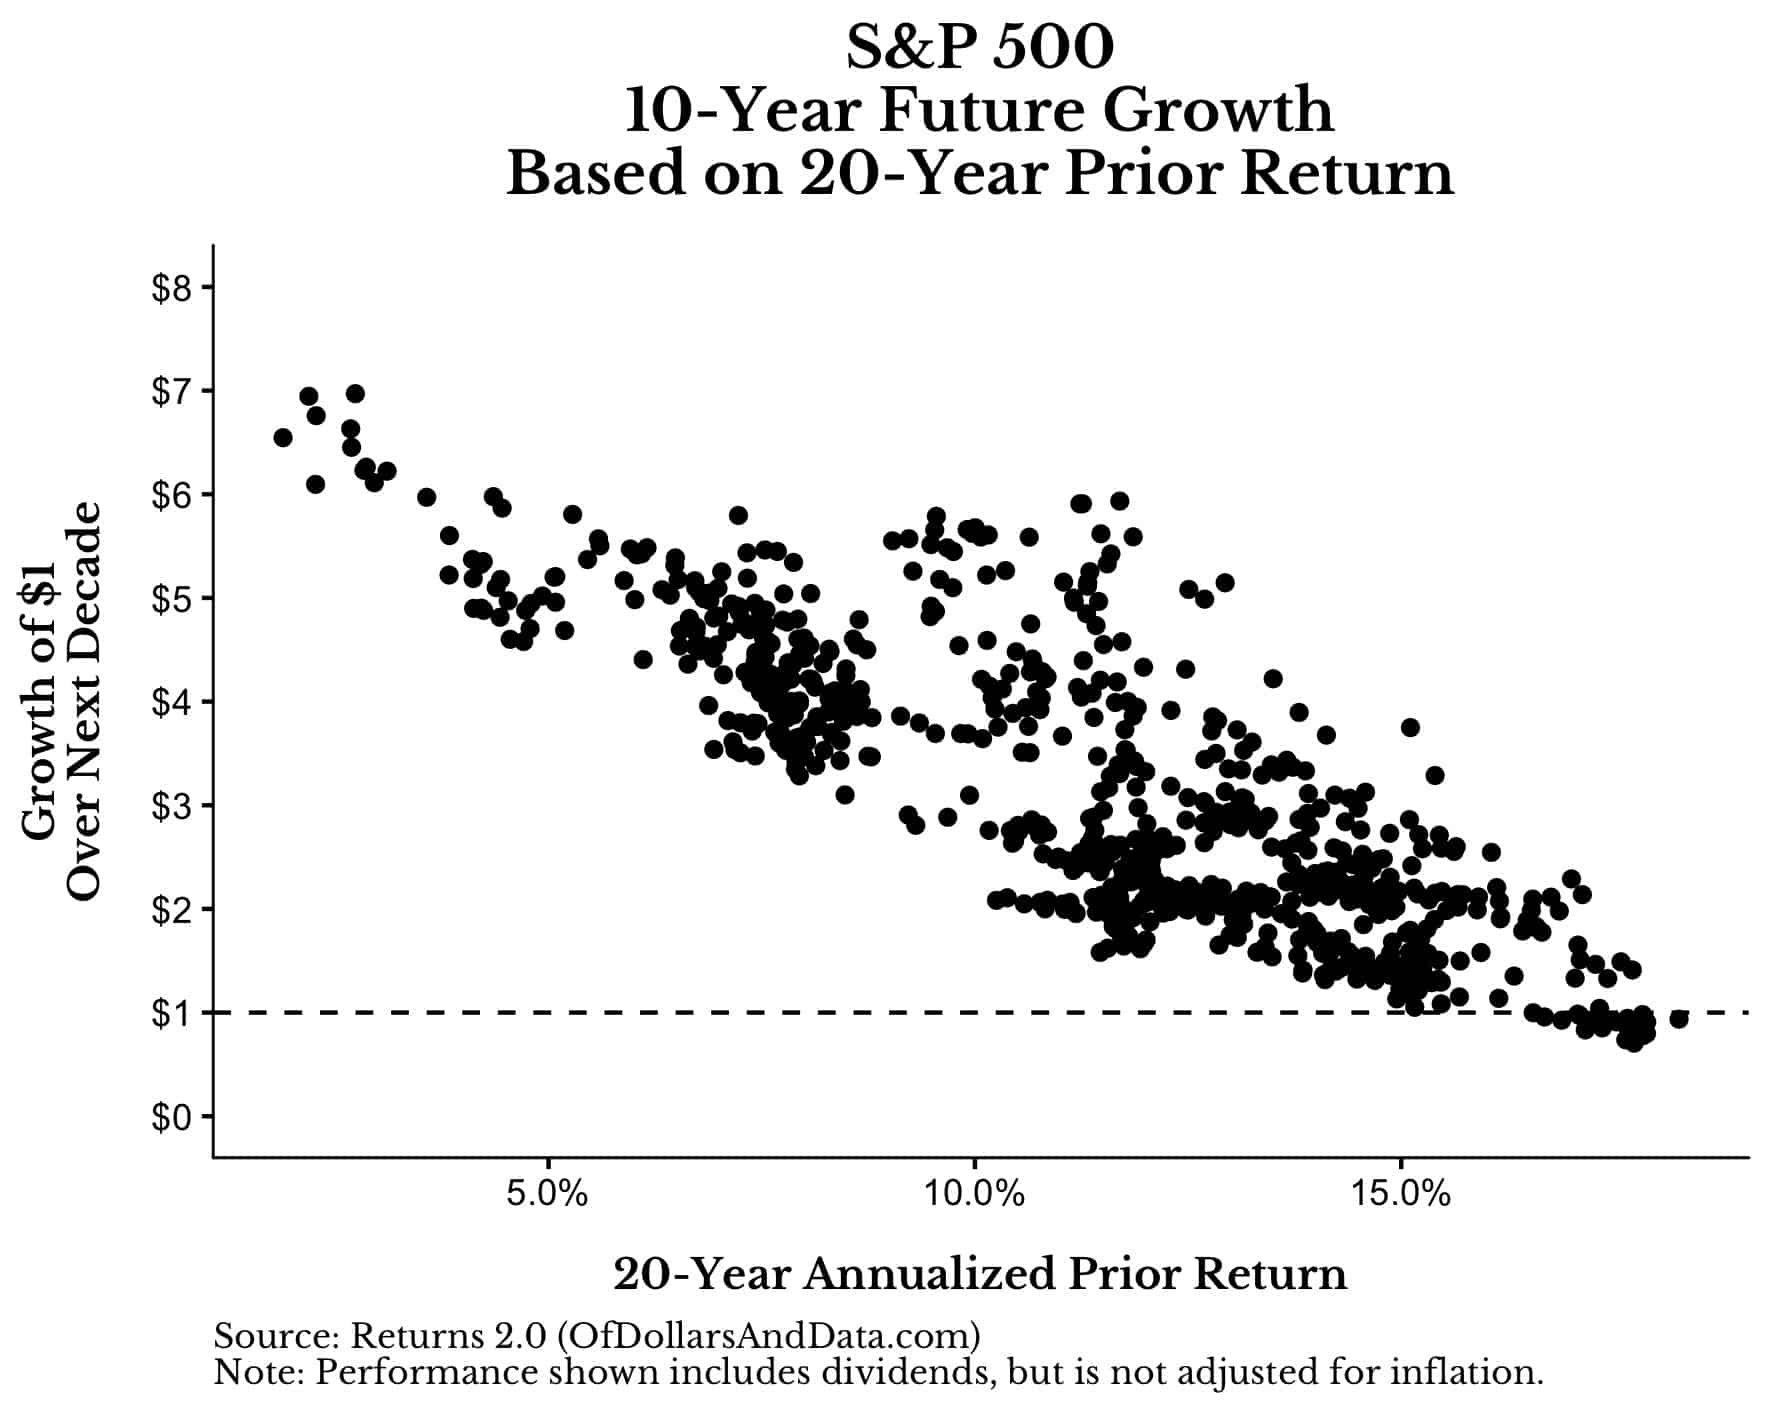
While this relationship might seem like a good predictor for future returns, we have to remember that this analysis is plagued by small sample size. With a limited number of non-overlapping 20 year periods of U.S. market history, it is hard to say anything definitive about future returns based on prior returns.
Nevertheless, you are probably wondering where we are today on the plot above. Well, I will tell you.
From January 2000 to December 2019, the S&P 500 compounded at a rate of about 6.3% (with dividends reinvested). Historically, markets compounding in the 6% to 6.5% range over the prior 20 years went on to grow between 4x and 5.5x over the next 10 years:
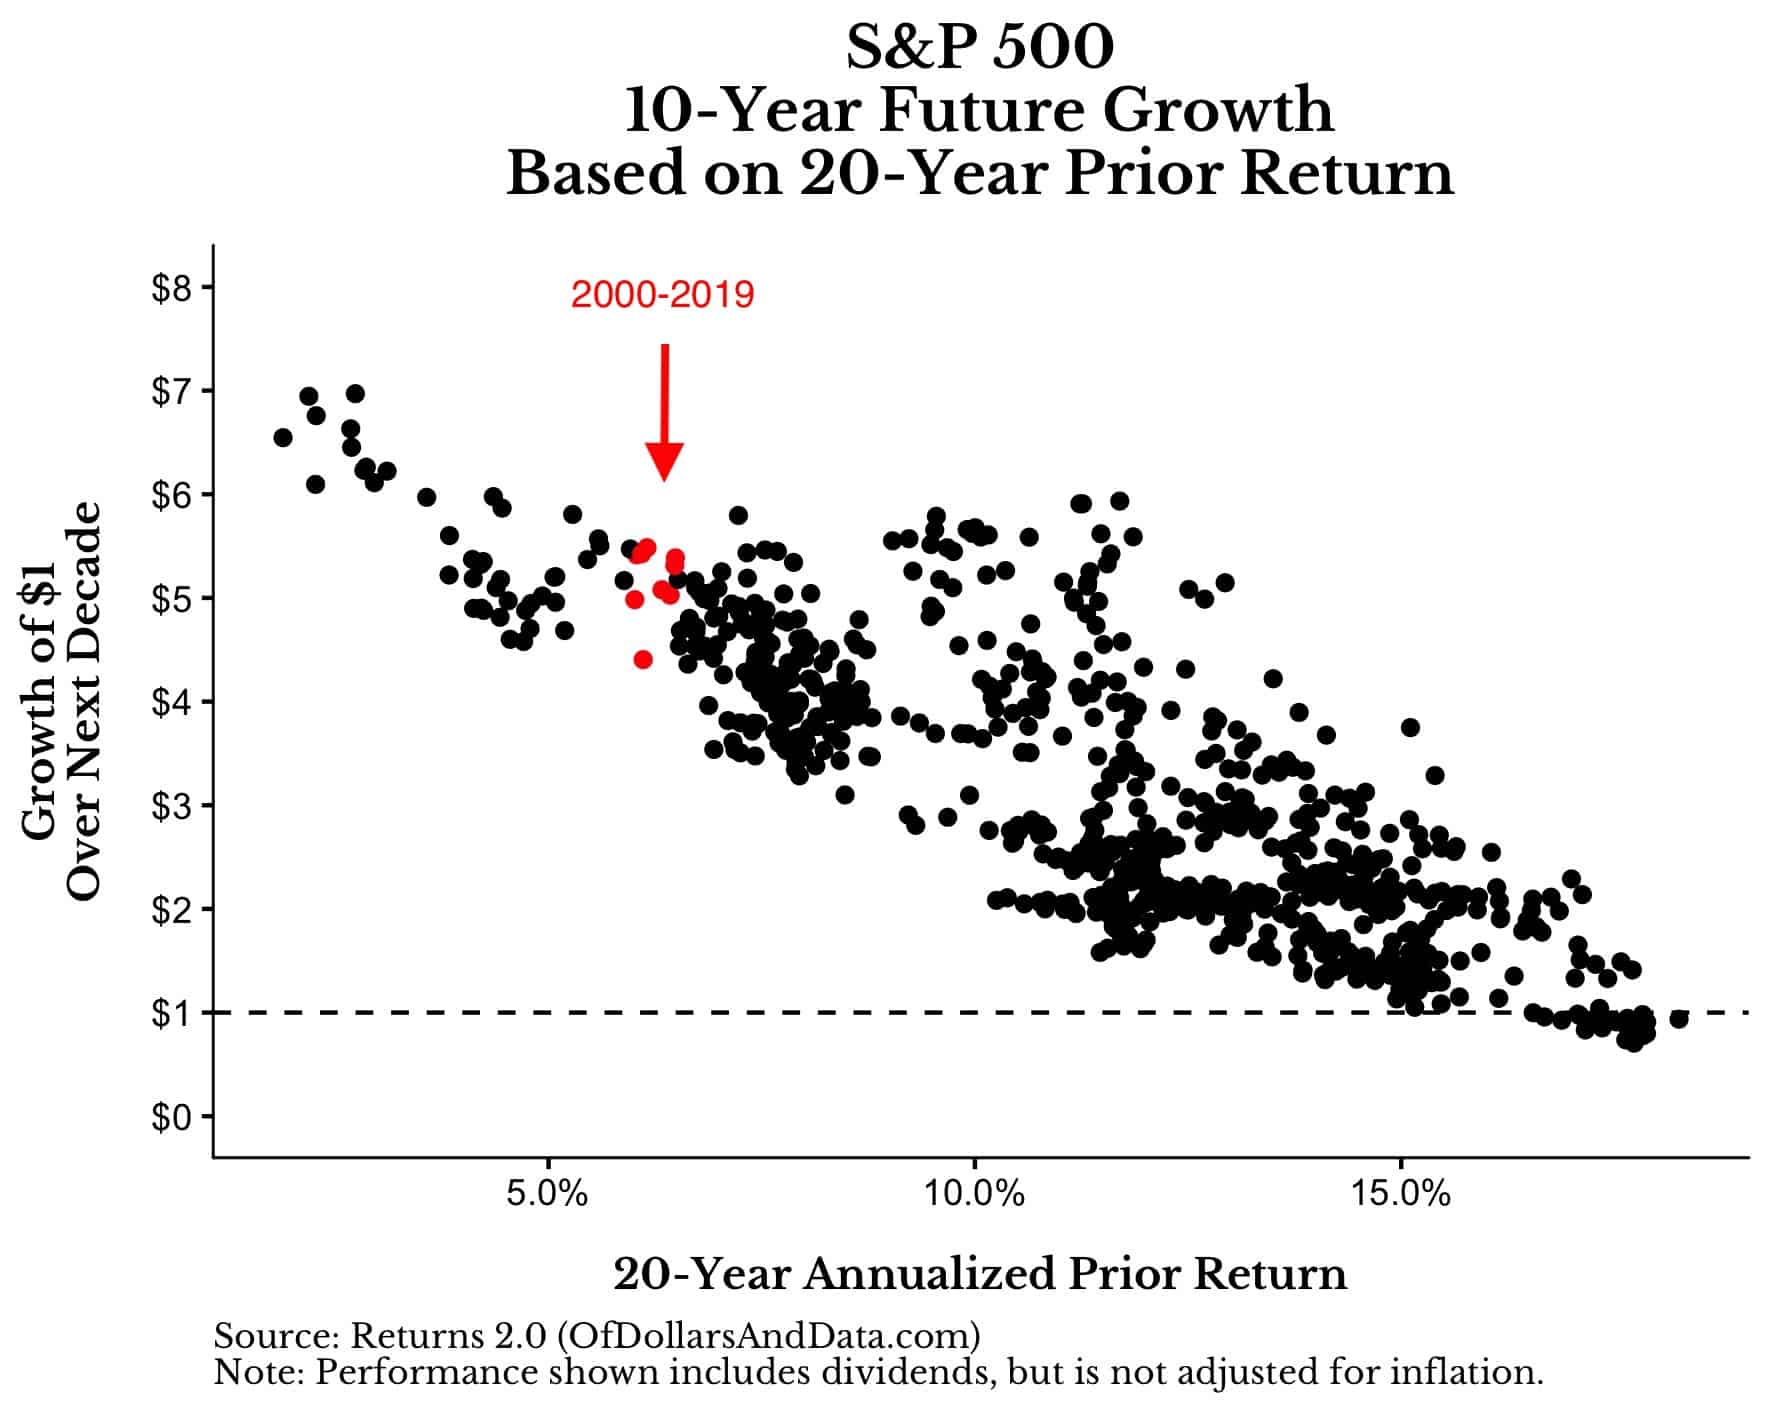
Those red dots above are months in the mid 1940s and the early 1980s. Both of these periods had poor performance over the prior 20 years (i.e. Great Depression, 1974 crash), but went on to have incredible growth over their next 10 years (i.e. Post WWII boom, 1980s bull market).
Of course history doesn’t have to repeat itself in any meaningful way for 2020 and beyond, but if the S&P 500 “only” doubled over the next decade, here is where that point would lie on this plot:
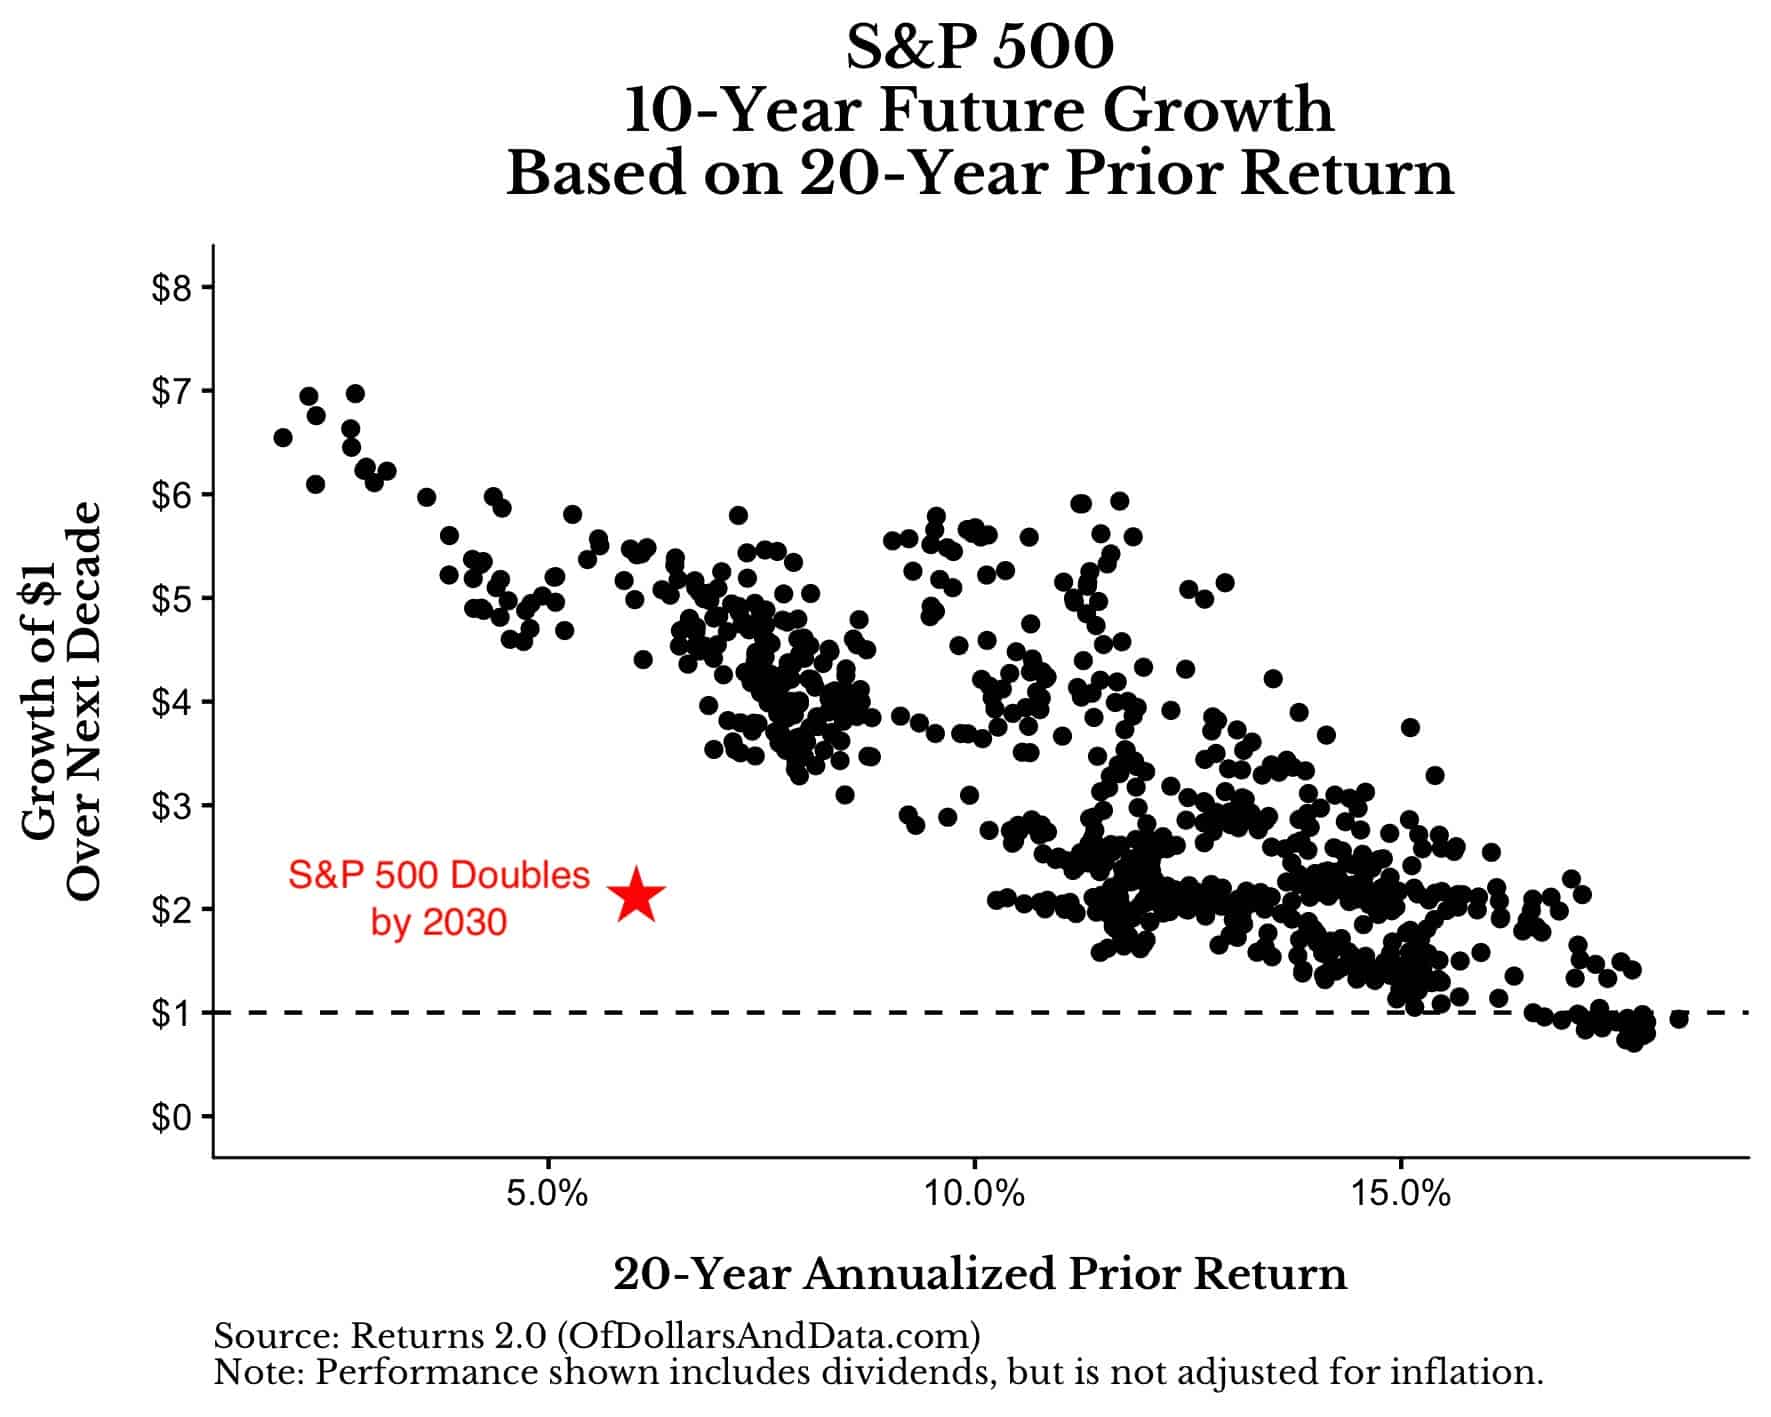
Think about how insane this would be relative to history. If you are expecting anything less than a doubling of the S&P 500 by 2030, then you are suggesting that the red star above will be even lower on the y-axis than where I already placed it.
If this were to occur, it would be unlike anything we have ever seen before in terms of growth over such a long time period.
And the crazy part is that the red star represents “only” a doubling over the next decade. If history were to repeat itself in some meaningful way, the S&P 500 would be 4x higher by 2030 than where it is today.
This statement seems crazy right now, but that’s what has happened historically. I understand that there is no law forcing U.S. markets to follow this trend indefinitely. However, if you are forecasting an awful coming decade for U.S. stocks, I have some bad news for you—the evidence is heavily against you.
While even I believe that future expected returns should be lower than history due to cheap diversification among other things, I also understand the flaw in thinking “this time is different.”
Then again, if I never think “this time is different” then I will be succumbing to the investor’s fallacy as much as anyone else.
Looking Like a Fool…Eventually
Though I am not in the business of making future market predictions, I am bullish on U.S. equity markets over the next decade. The problem with saying something like this is that the naysayers will laugh in your face when you get it wrong. And I will be wrong…eventually.
Maybe it will happen in 2020. Maybe in 2025. Maybe in 2030. Who knows?
But I am not worried about that whatsoever. Because it’s not about being right or wrong, but whether you follow the right or wrong process when making decisions about the future. And though my process is limited by the amount of data that I have, I know that it’s not unreasonable.
Unfortunately, I cannot say the same thing for those investors that have been predicting a crash since 2012 (and still are). One day those naysayers will be right. Until then…thank you for reading!
If you liked this post, consider signing up for my newsletter.
This is post 158. Any code I have related to this post can be found here with the same numbering: https://github.com/nmaggiulli/of-dollars-and-data

