A few weeks ago, a reader asked me to respond to this tweet from Xavier Helgesen which claims that there is a “simple way” to know when the U.S. stock market is overvalued. How so? It tracks Market Cap (non-financial)/Gross Value Added, a measure created by noted permabear John P. Hussman, Ph.D. As the tweet states:
Essentially, this measures the price of the stock market compared to the amount that the businesses contained within sell goods/services for in excess of cost.
And, based on today’s reading of MarketCap/GVA, the projected nominal return for the U.S. stock market for the next 12 years is -4% annually. If we adjust for inflation, MarketCap/GVA would predict -8% per year through 2035.
For some context, the worst 12-year real return in U.S. stock market history was -3.5% per year and occurred during The Great Depression (April 1930-April 1942). This means that Hussman’s measure is predicting that future U.S. stock returns will be over two times worse than what they were during the darkest period in American economic history. So what seems more likely: that we are on the verge of The Great Depression on steroids or that Hussman’s model is wrong?
I don’t have an issue with Hussman’s MarketCap/GVA model in particular. But, I do have an issue with valuation models in general. Because, today, basically all the valuation metrics tell the same story—U.S. stocks are overvalued, therefore, we should expect a major crash as these metrics return to their long-term historical averages. Whether you use Hussman’s measure, the Buffett indicator, or Shiller’s CAPE (cyclically-adjusted price-to-earnings) ratio, the logic is always the same.
But, there’s a huge problem with this logic—there is nothing that says that these metrics have to return to their long-term averages. In fact, I believe the opposite. Valuation multiples are likely to stay above their historical norms for the foreseeable future. Why?
Because investing is much simpler today than it used to be. With the rise of cheap diversification over the last half century, investors today are willing to accept lower future returns (i.e. higher valuations) than their predecessors. This has fundamentally changed valuation metrics and made historical comparisons less useful than they once were. This might seem far-fetched, but let me explain.
Imagine it’s 1940 and you want to build your wealth by owning a diversified portfolio of U.S. stocks. How would you do it?
You first might try to go the mutual fund route to have a professional pick stocks for you. Though the first mutual fund was created in 1924 and the industry grew in the 1930s, many of these early funds had high load fees. These were fees that you had to pay anytime you bought (or sold) shares in the fund. Load fees varied, but could be up to 9% of your total investment.
So if you invested $1,000 into a mutual fund with a 7% load fee, you would actually only start with $930. Then you’d pay an annual management fee each year you were invested and then another load fee when you sold out of the fund. It’s fees all the way down.
If you wanted to avoid such fees, your next best option would have been to create a diversified portfolio by hand. Unfortunately, this would have meant doing research to figure out which stocks would do well over time and which ones wouldn’t. This task would have been even more difficult and time consuming than it is today given the lack of access to information.
And, once you picked your stocks, you would then need to monitor them periodically to determine which ones to hold onto and which ones to sell. As we know today, 50% of public companies disappear within a decade, and it’s likely that some of your stocks would as well.
More importantly, you would be picking stocks during a time when it wasn’t obvious that owning stocks was the right thing to do. After all, it’s 1940 and America just came out of the worst economic crisis in its history. Are you sure that stocks aren’t just a gamble? We can answer this question with a definitive “no” today because we have historical evidence that shows otherwise. But this historical evidence wouldn’t have been readily available in 1940.
This is what I call the privilege of knowledge, or the idea that we are able to make certain decisions today that our ancestors couldn’t make because we have more information than they had. For example, it’s easy to say “Just Keep Buying” in 2023 because we have so much data to back it up. But, 1940 this wasn’t true.
Now think about this process as a whole. Think about how emotionally and financially taxing it would have been. You’re getting nickle and dimed with fees, you’re facing the emotional turmoil of trying to be a stock picker, and you don’t even know if stocks are a good bet in the first place. It’s insane to think that people invested at all during these times (especially following The Great Depression). Therefore, those who did invest wanted to be highly compensated for doing so.
Now compare this with what you have to do today to get a diversified portfolio. You open an account and buy the index fund of your choosing. Fees? There are almost none. Diversification? It’s included. Your time? Well preserved. Evidence that it works? It’s overwhelming.
Investing today is far simpler and cheaper that it was nearly a century ago. This begs a question: how much annual return would you be willing to give up in 1940 to have all the investment innovations that we have today? I bet it’s at least a few percentage points. And, if this is true across investors in general, then we would expect stock prices to be bid up accordingly over time.
And this is exactly what we’ve seen over the past few decades. If you look at Shiller’s P/E (price-to-earnings) ratio going back to 1920, you can see that this ratio has been mostly increasing over the last century:
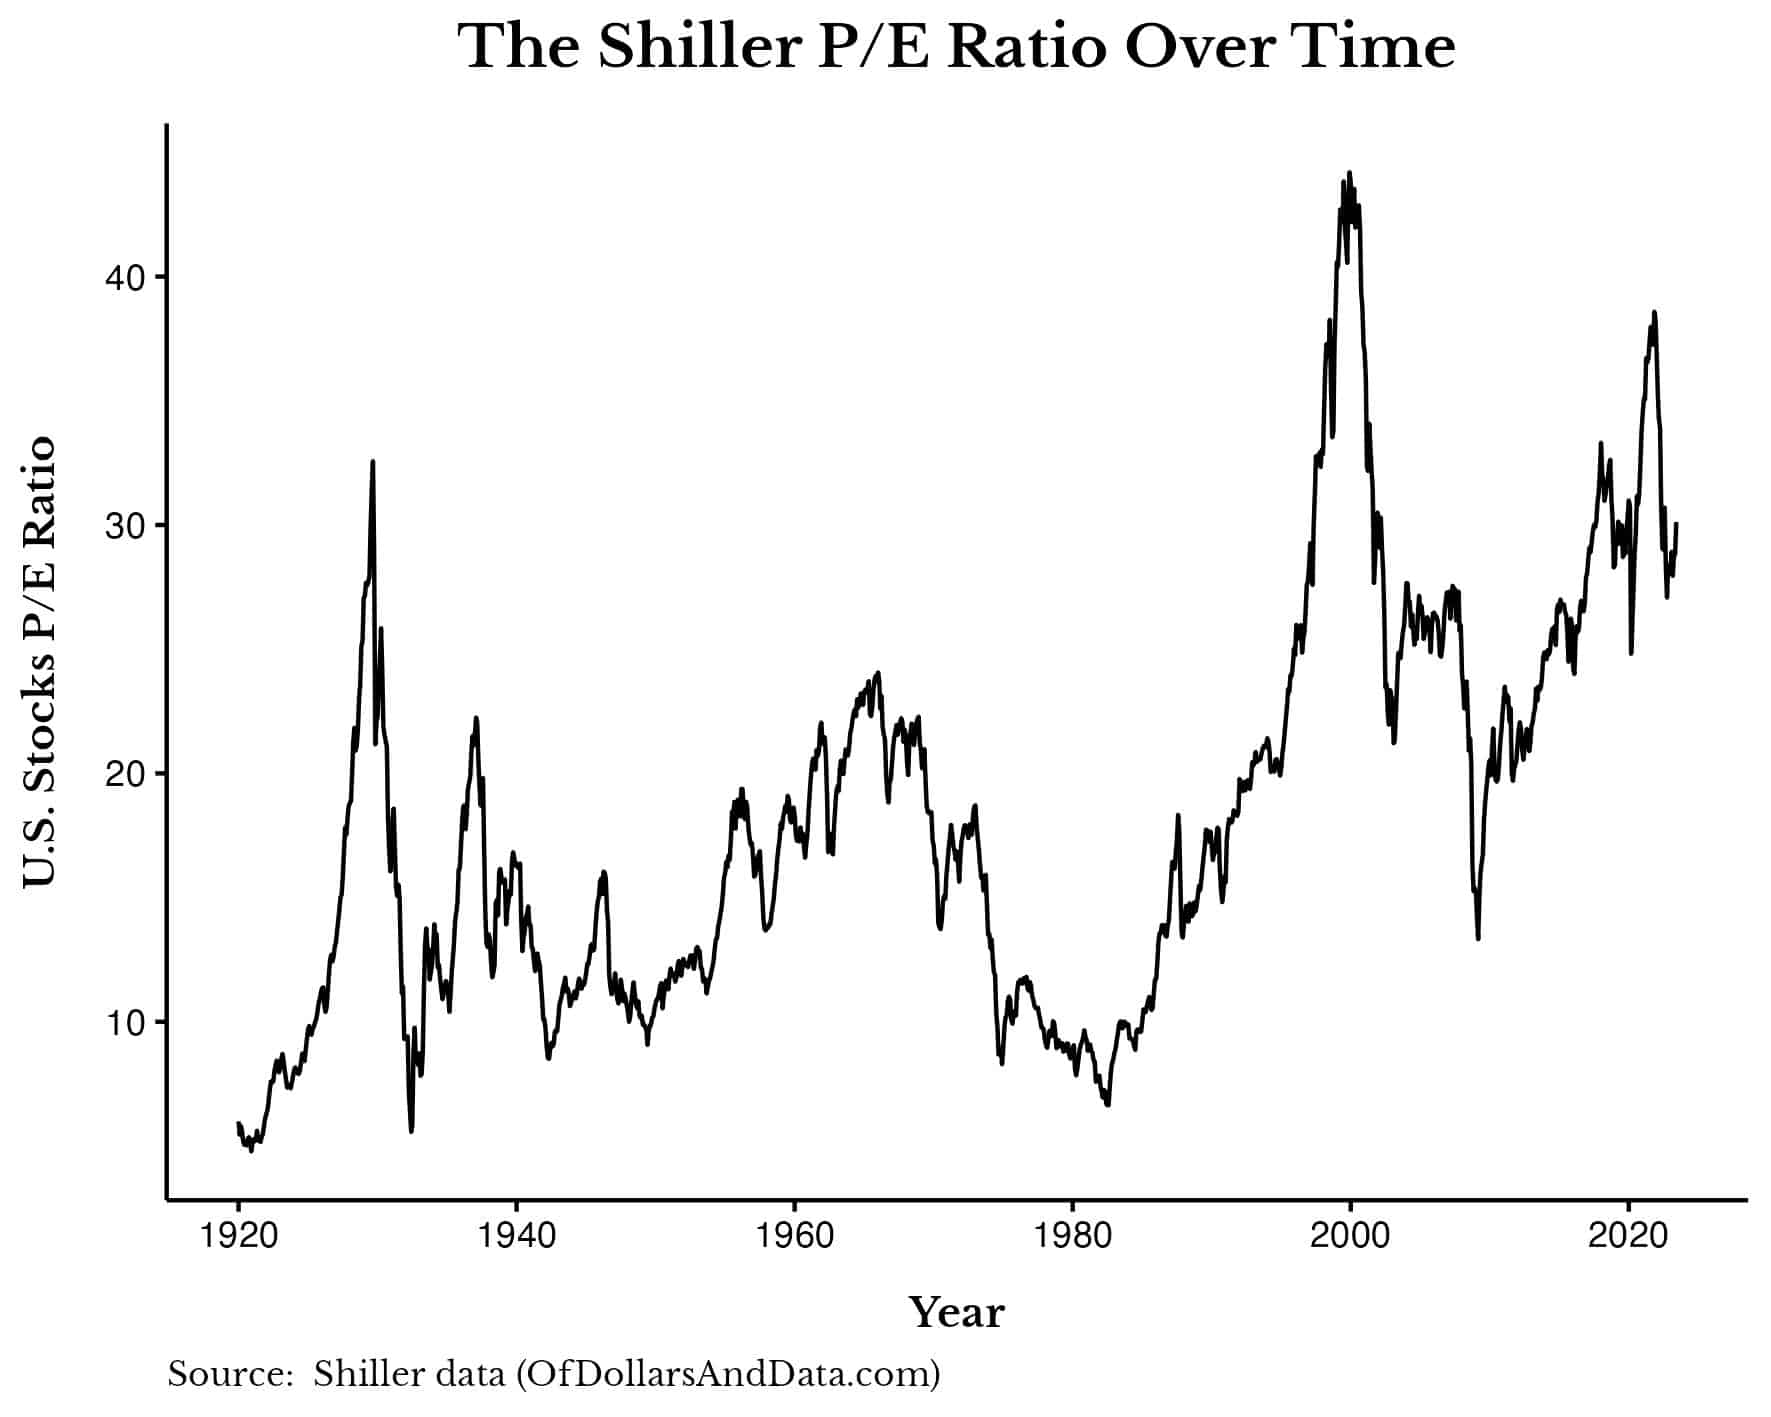
In fact, before 2000, the average Shiller P/E ratio was 15.5 and since then it has been around 27. This is evidence that investors are willing to bid up prices (and, thus, accept lower returns than their predecessors). Even in March 2009, when things looked the bleakest during The Great Recession, the P/E ratio only briefly dipped below its pre-2000 average (~15) before immediately shooting back upward.
This is why expecting mean reversion in valuation metrics is so misguided. Because the investment industry has changed too much. And investors have responded accordingly. In 1940, a P/E ratio of 15 wasn’t an amazing deal for stocks, but in 2023 it is.
You might argue that this upward shift in the P/E ratio is completely due to lower interest rates, but I would disagree. There were points in the mid 2000s where interest rates were at the same level that they are at today, yet the P/E ratio was still in the mid to high 20s (well above the historical average). If rates explain everything, then U.S. stock prices should have fallen even more in the early-to-mid 2000s.
If my hypothesis is correct, then valuation metrics should not revert back to their historical averages (at least not for more than a few months) because modern day investors would bid them back up if they did. This seems to be what happened in the panics of March 2009 and March 2020, but I can’t prove it.
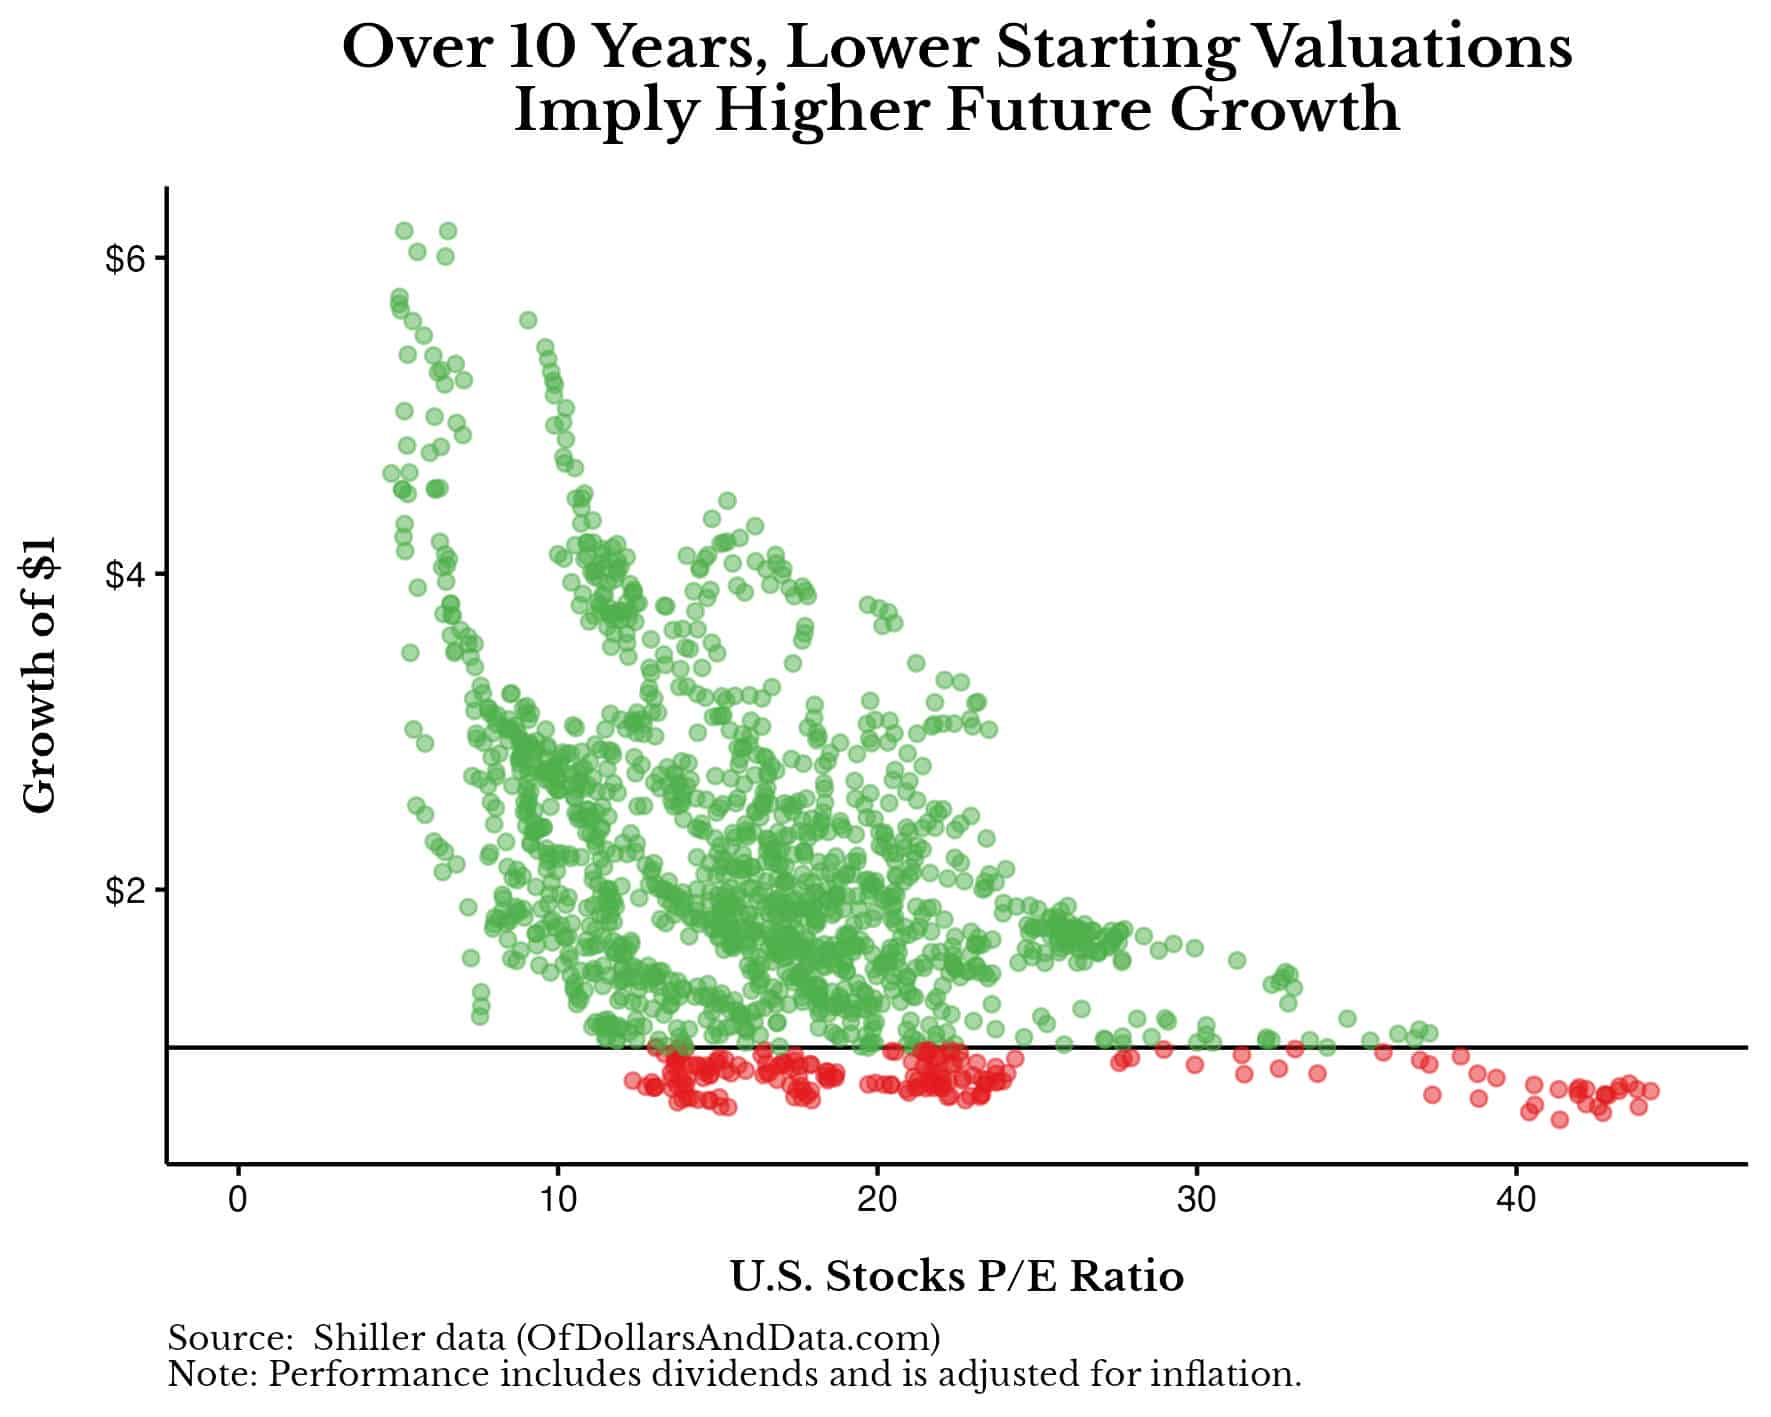
Either way, if we assume that today’s investors are willing to accept higher valuations, then it also means that they are willing to accept lower future returns. This is something that seems quite clear in the data.
We can see this when we plot U.S. stock growth over the next 10 years against Shiller’s P/E ratio going back to 1920:
As you can see, there is a negative relationship between starting valuation and future growth in U.S. stocks. We can see this more clearly once we add a fit line to the plot:
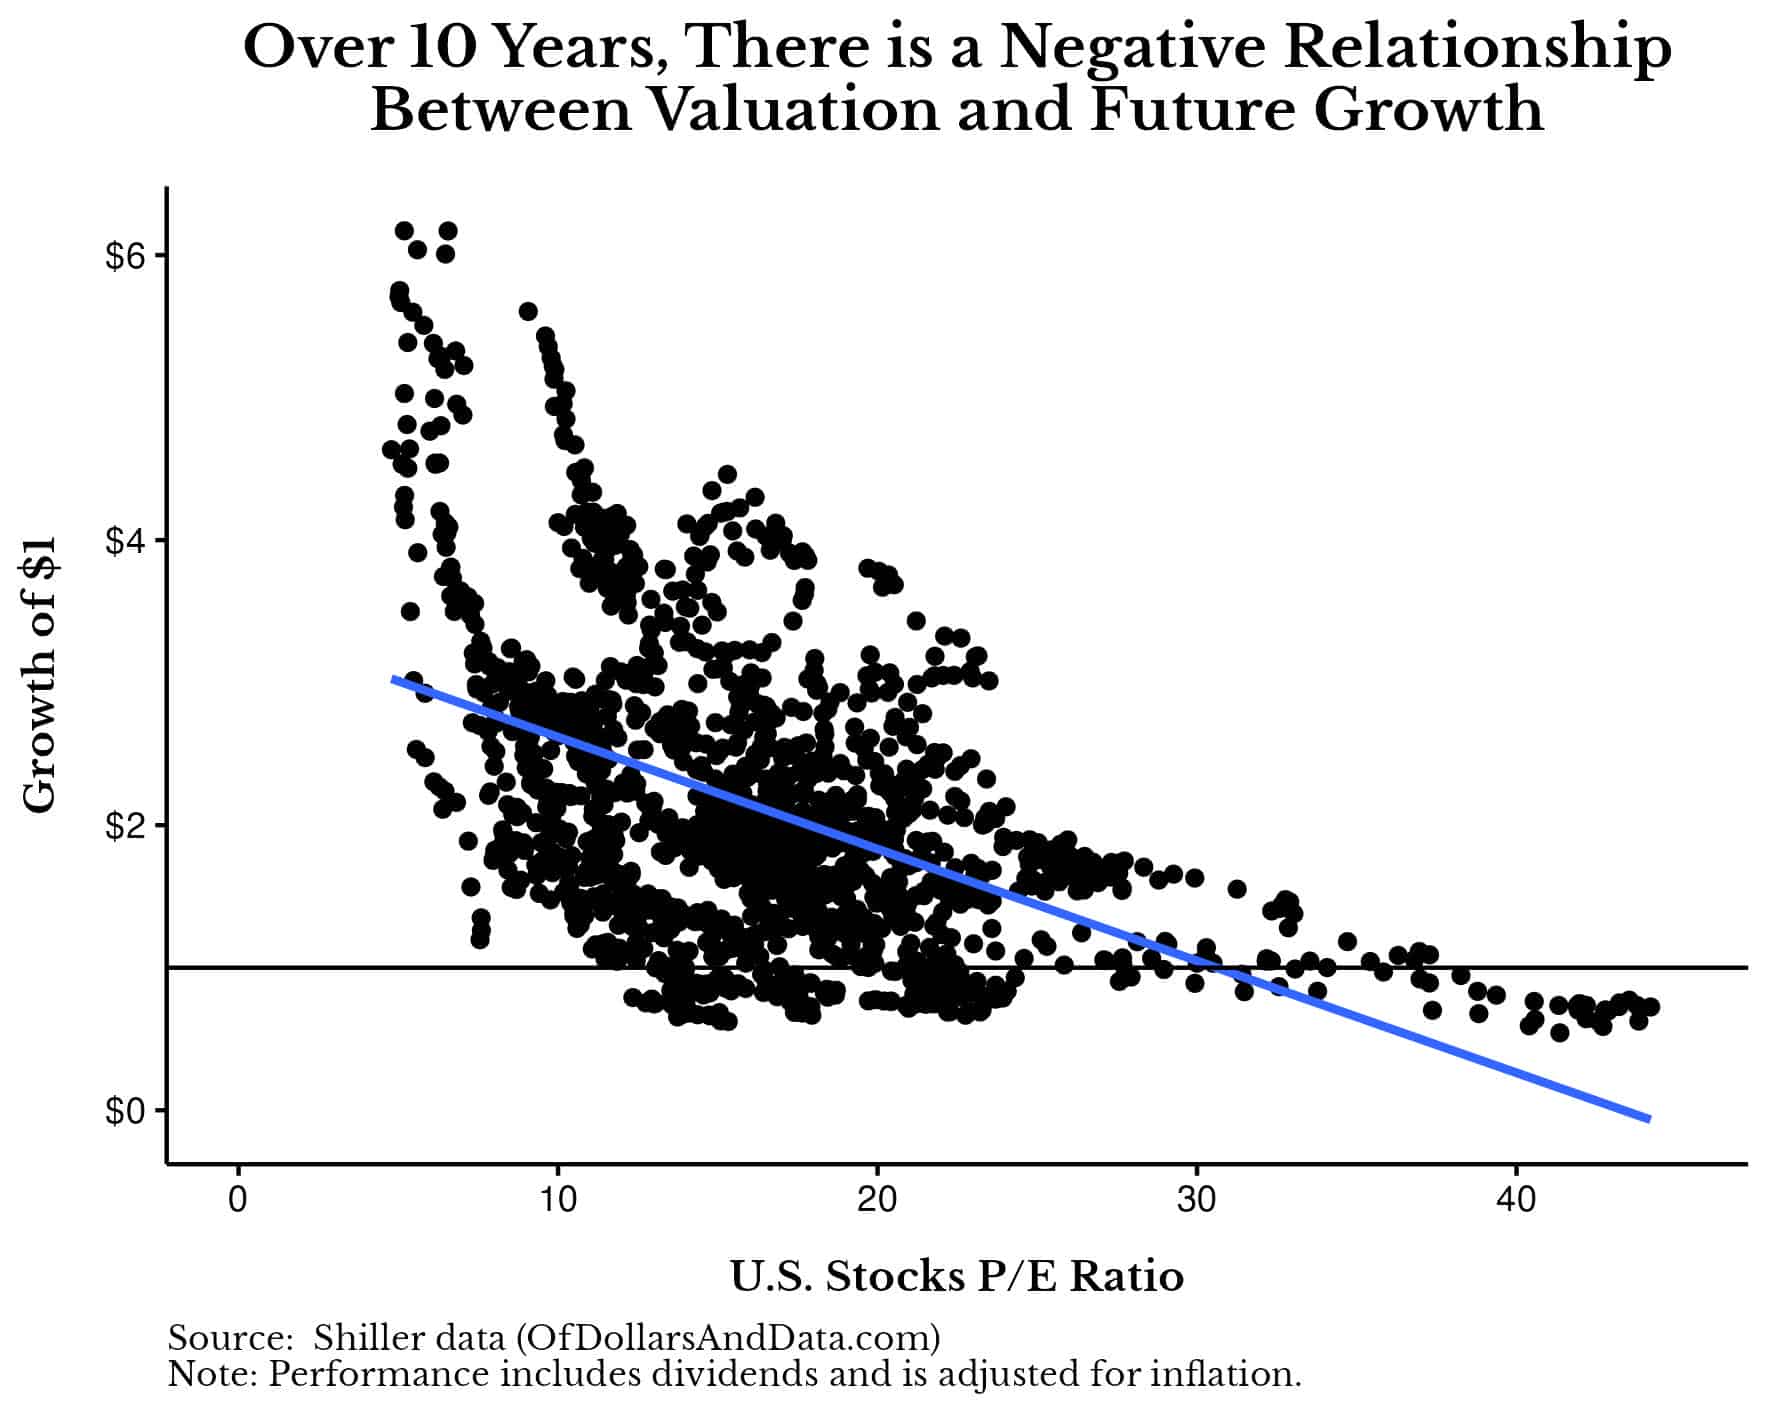
This fit line illustrates that as valuations tend to get stretched, U.S. stocks tend to perform worse in the future. And though this fit line is by no means perfect, we could use it to try and predict future U.S. stock returns based on the current P/E ratio.
And with Shiller’s P/E ratio at 31 today, the fit line implies that every $1 invested in U.S. stocks now will be worth around $1 in a decade (after inflation). You can see this point (starred in red) in the plot below:
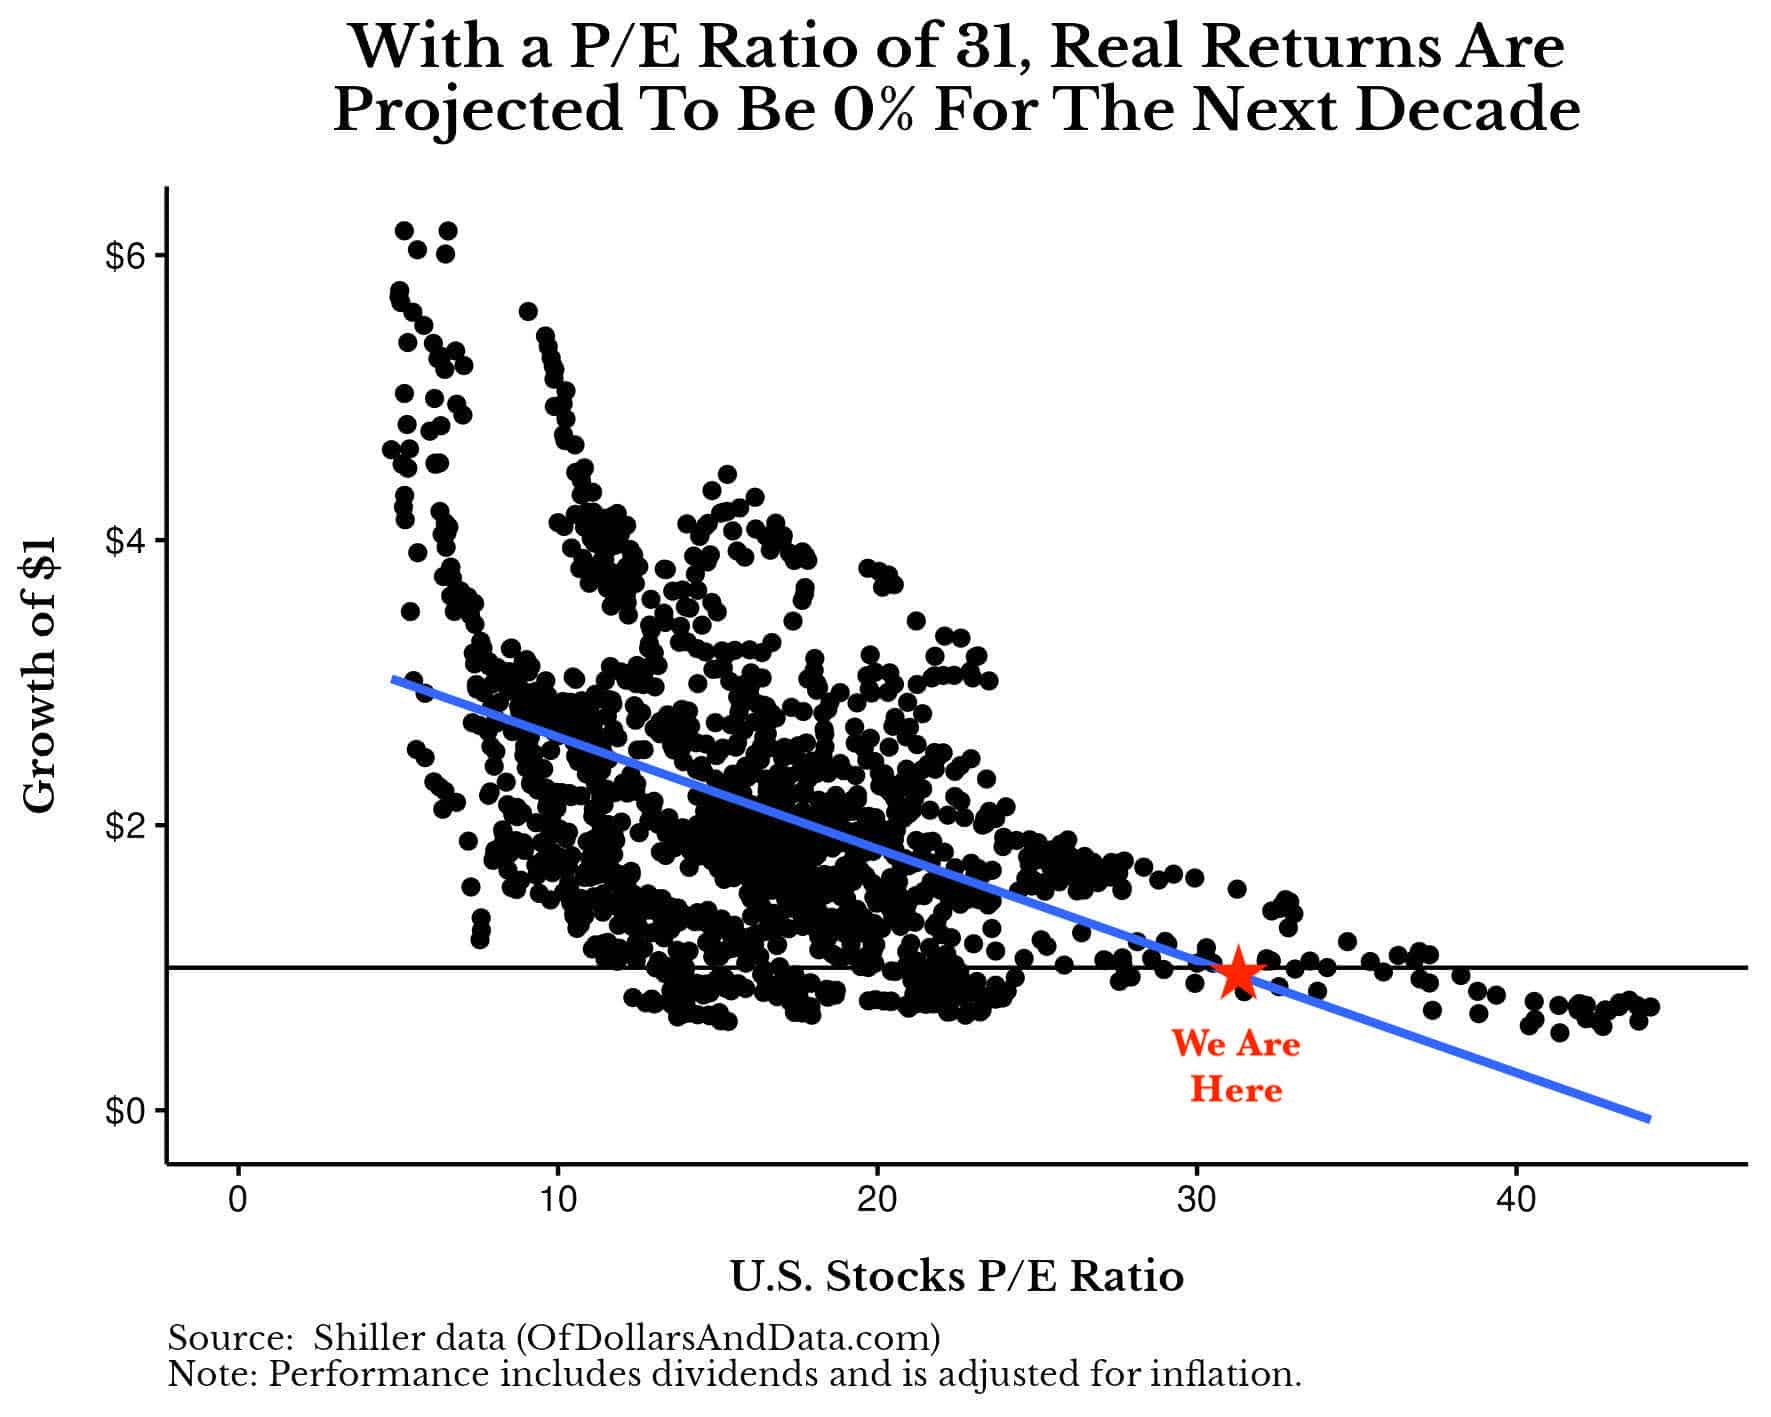
In other words, U.S. stocks are projected to merely match inflation over the next decade rather than generate their historical average real return of 7% per year. Though this is a pretty poor return relative to U.S. stock market history, it’s still much better (and more realistic) than the -8% per year predicted by Hussman.
Nevertheless, this simple valuation model has the same flaws that all the others do—it assumes that underlying conditions are the same in every time period. It assumes that a P/E ratio of 15 in 1940 is identical to a P/E ratio of 15 in 2009. But, as I’ve just demonstrated, they aren’t. Yes, they may look the same, but they definitely don’t feel the same.
Keep this in mind the next time someone sounds the alarm about high valuations. Because while future returns do seem lower, when we will experience them is anyone’s guess. Until then, happy investing and thank you for reading.
If you liked this post, consider signing up for my newsletter.
This is post 356. Any code I have related to this post can be found here with the same numbering: https://github.com/nmaggiulli/of-dollars-and-data

