A few months ago I wrote a piece demonstrating why investing a large sum of money immediately (even in a more conservative portfolio) would typically be better than averaging-in over time. Josh Brown and I even did a video where we got to discuss the nuances of implementing such a strategy.
However, despite my best efforts, I wasn’t able to convince a vocal minority of investors who had many justifications as to why investing a lump sum today would be a bad idea. Between Trump and Brexit and the trade war and [insert your event of choice here], these investors are convinced that investing large amounts right now would be crazy. I mean, with these headlines, how could U.S. stocks keep going up, right?
But, you already know where this logic train is headed. It’s headed down a path that tells you all the reasons why you should sell or stay out of the market. But, what makes this argument compelling is that the same commonly cited piece of data is used to support it—valuation.
The most relied upon valuation metric among investors is the price-to-earnings ratio (P/E) or the cyclically adjusted price-to-earnings ratio (CAPE). These ratios are a measure of how much investors are willing to pay for $1 of corporate earnings. A CAPE of 15 means that $15 will buy you $1 of earnings.
As you can see, a higher CAPE implies that investors are willing to pay more for the same $1 of earnings. It might seem irrational that investors would pay more for $1 of earnings in one country over another, but taking into account differences in country risk and future growth expectations can cause a divergence in valuations.
The most recent data from Robert Shiller shows CAPE at ~30 for U.S. stocks, far above their long-term historical average of 17. It’s this single data point that prevents more investors from pulling the trigger on investing in the markets than just about anything else. And I understand their fear. U.S. stocks are valued quite a bit above their long-term average and every investor knows what tends to happen when this occurs. Higher valuations (CAPE) imply lower future expected returns.
If you look at the starting CAPE for U.S. stocks and the return they have over the next 10 years from 1940-2008, this negative relationship is clear:
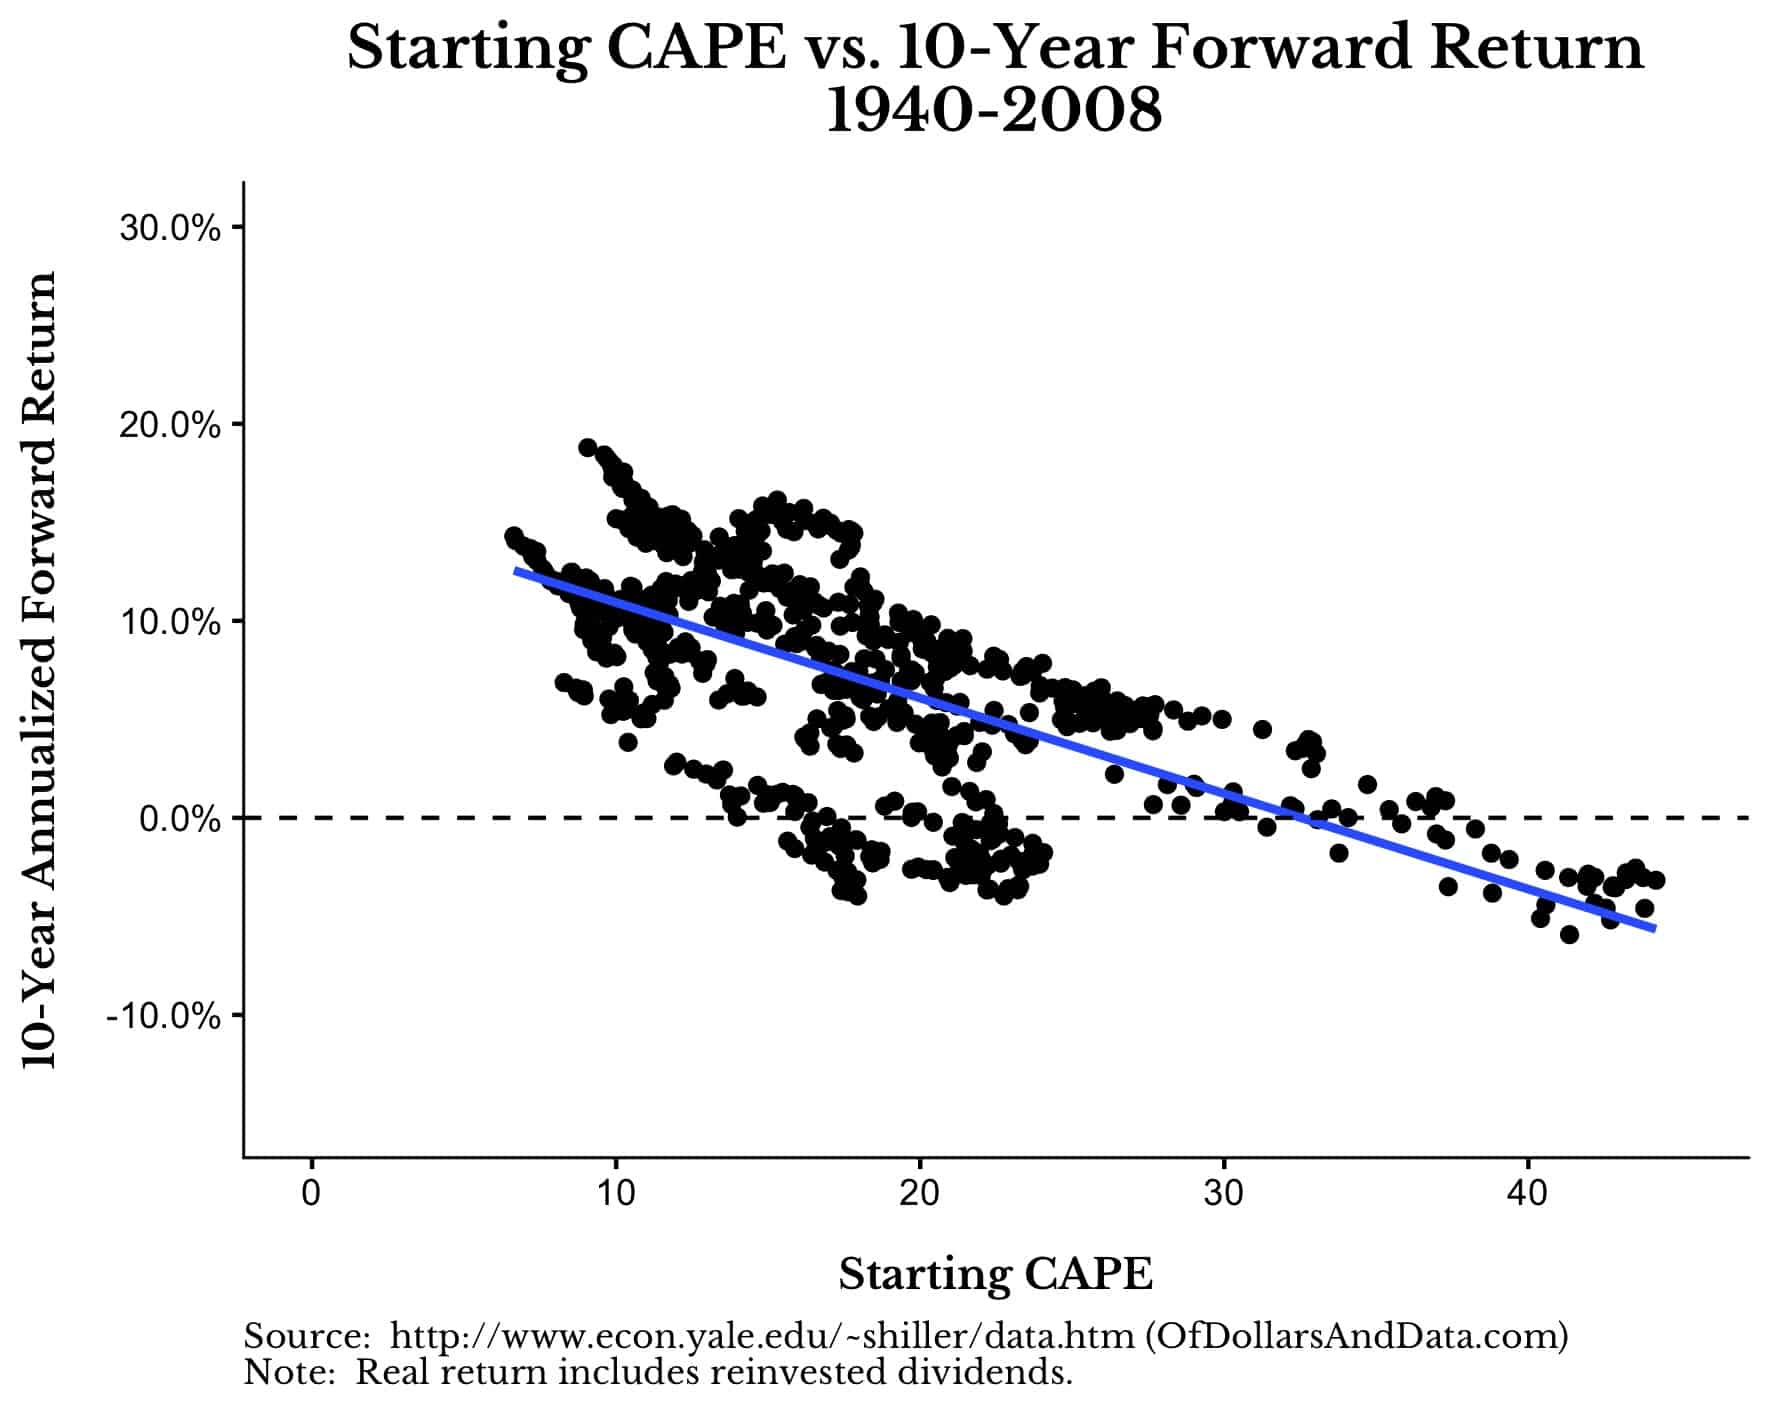
With relationships this striking, how could anyone argue otherwise? Well, there are two causes for concern.
One, there are lots of periods where higher CAPE values (~30) still provided positive annualized returns. And with negative interest rates across much of the globe today, I don’t see how lower expected returns are a problem, assuming these returns remain positive. Given that the main alternative to investing in stocks (i.e. bonds), yields near zero (or less) when adjusted for inflation, what other options do you have? I’d rather have some positive return and pay a higher valuations than no return at all.
The second issue with this chart is that it groups together CAPE values and future expected returns from many different market regimes. If you break these periods out over time, you will see that the strength of the negative relationship between starting CAPE and future returns varies over time:
If we look at the period from the mid 1970s to the mid 1990s, the relationship between starting CAPE and future 10-year returns is non-existant:
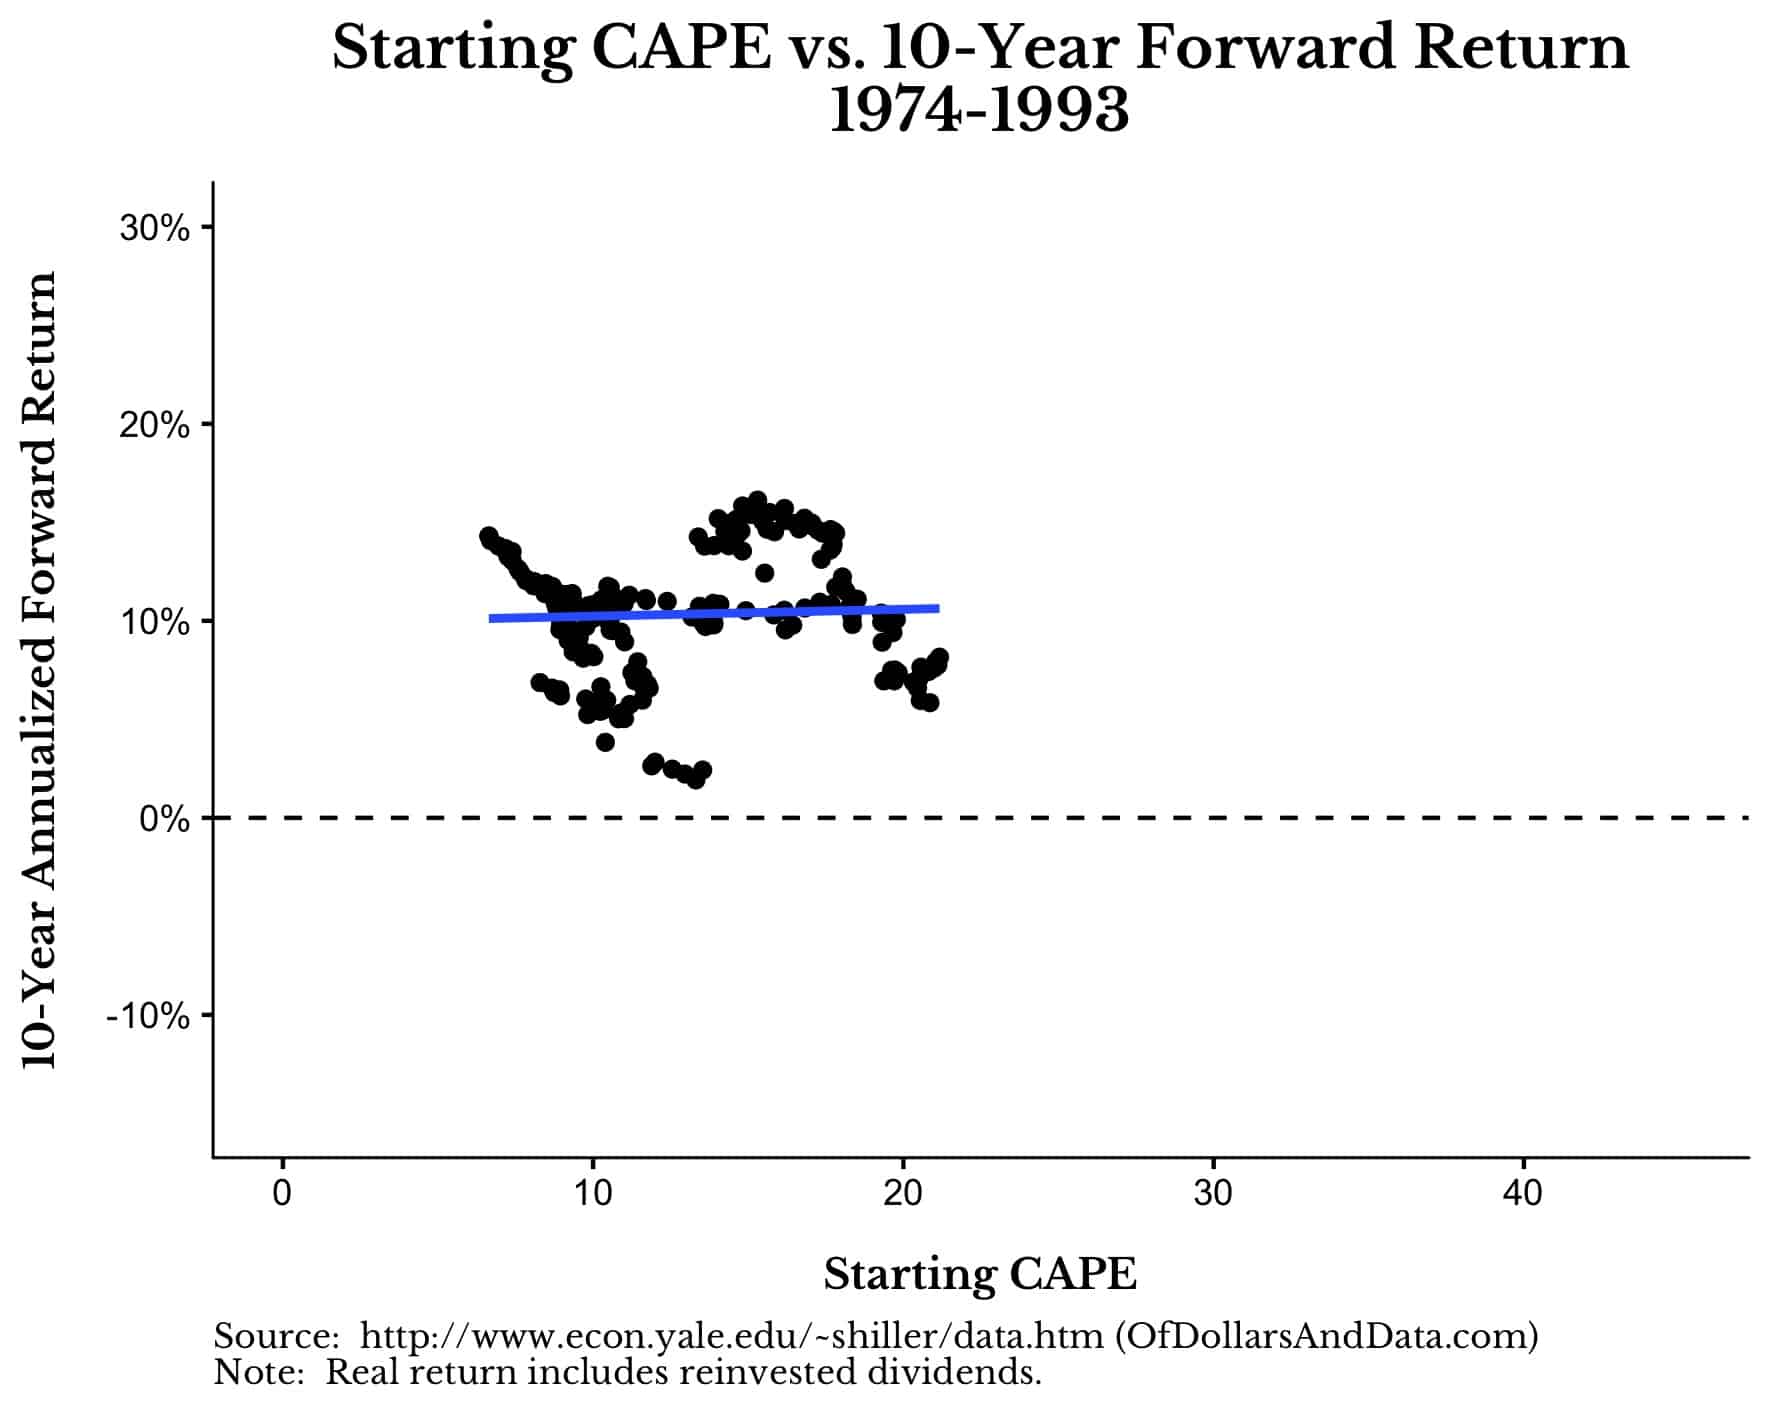
Of course this is just one period of many, but it goes to show that starting CAPE does not always predict future returns. The relationship is strong, but not ironclad.
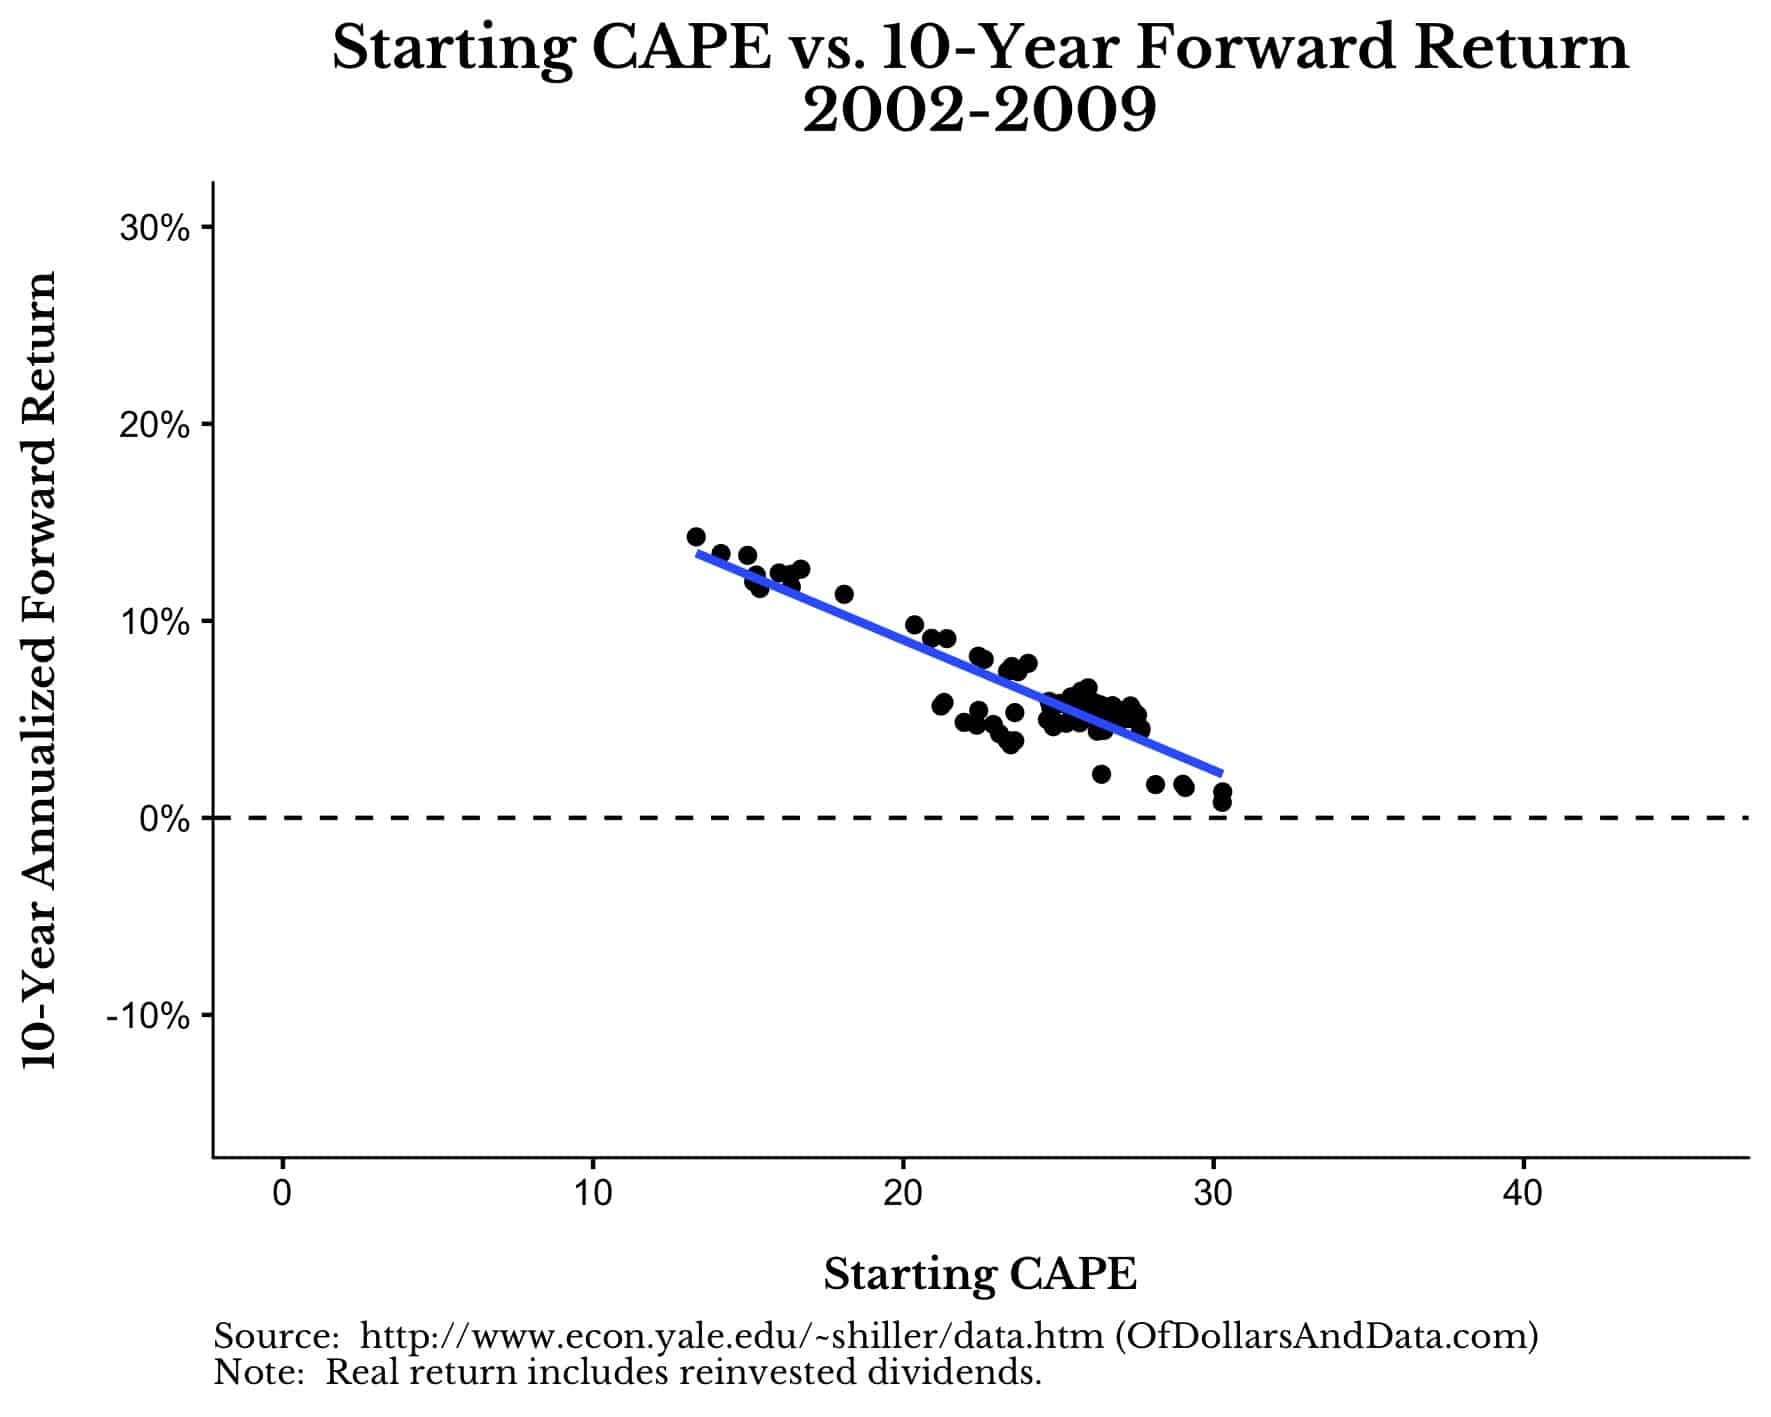
And even when the relationship does hold, as I alluded to before, stock returns are still usually positive. For example, if we take the period following the DotCom bubble, all valuation levels led to a positive 10-year return:
So what are you going to do? Are you going to continue to believe that valuations are too high at these levels? Maybe you are right. But, how high is high? CAPE hit 24 back at the end of 2013 and, since then, U.S. stocks are up an inflation-adjusted 61% (including dividends).
“But Nick, stocks are overvalued now, so that 61% gain won’t last.” Maybe. But even if U.S. stocks were to drop 30% from today’s levels, you still would have been 12% better off had you bought back in late 2013 when CAPE first passed 24.
You can apply this same logic when deciding whether or not to buy U.S. stocks today. But, before you shun U.S. equities, answer the following:
- Are you willing to possibly miss out on even further gains?
- What valuation level would U.S. stocks have to reach before you decided to invest?
- If the CAPE on U.S. stocks remains elevated (>25) over the next decade, would you reconsider your beliefs on valuation?
If you are sitting on lots of investable cash, you should know exactly how you would answer these questions. Because if you don’t, then what are you doing?
Data Isn’t Everything
I know the value of valuations. I’ve previously written about their importance in investing. And while I don’t deny the usefulness of CAPE, I also don’t revere it as the be-all and end-all of our industry. As someone who looks through data constantly, I know the value of a good metric and a good story that accompanies it. But, data isn’t everything. Sometimes relationships break down. Sometimes we can be fooled by randomness, seduced by patterns that aren’t there.
It’s this trait that makes us so good and so bad at investing at the same time. Analyzing trends and recognizing patterns helped us to master our environment, but these same tendencies can also lead us astray. Valuations are just one area where blindly following data can be misleading. Because valuations are always a relative measure.
For example, is a CAPE of 20 high or low? It isn’t either. It’s just high or low relative to what people have paid historically. That’s it. If investors collectively decide that they want to pay more for the same amount of earnings going forward, then what used to be considered “high” is now normal. As economic circumstances change, so will peoples’ willingness to pay more (or less) for stocks.
So you can either invest now, or continue to demonize high valuations as your sCAPEgoat. Your move. Thank you for reading!
If you liked this post, consider signing up for my newsletter.
This is post 148. Any code I have related to this post can be found here with the same numbering: https://github.com/nmaggiulli/of-dollars-and-data

