Previously I’ve written about why buying the dip can’t beat dollar cost averaging, even if you were God. However, I feel like that article was a bit too extreme. Buy the Dip was defeated in one fell swoop. It never had a fighting chance. There was no last meal, no departing words, and no funeral procession that followed.
But today, I’m going to change all that. Because today I’m going to give Buy the Dip the proper burial that it deserves and demonstrate without a reasonable doubt why it is a terrible investment strategy.
To start, let’s imagine that you are dropped somewhere in history between 1920 and 2000 and you have to invest in the U.S. stock market for the next 20 years. You have 2 investment strategies to choose from:
- Dollar-cost averaging (DCA): You invest $100 every month for all 20 years.
- Buy the Dip: You save $100 each month in cash until the market dips below a certain amount from its all time high (i.e., 10%, 20%, etc.) Once the market dips enough, you invest all of your saved up cash and continue investing $100 each month until the market hits another all-time high. At that point you go back to stockpiling cash until the next dip of the same size occurs. Rinse and repeat throughout the entire 20 year period.
The only other rule in this game is that you cannot move in and out of stocks. Once you make a purchase, you hold those stocks until the end of the time period. So what would you choose? DCA or Buy the Dip?
Before you answer that question, let’s review how Buy the Dip works so you can see it in action.
How Buy the Dip Works
To visualize how the Buy the Dip strategy works, consider following it from 1970-1990 with a drawdown threshold of 40%. What this means is that you will save up cash and only buy once the market is 40% below an all-time high. After this 40% dip occurs, you then keep buying each month until a new all-time high is reached. At the new all-time high, you repeat the process and start saving cash once again, waiting for the next 40% dip to occur.
You can see this in the chart below which shows the Buy the Dip cash balance over time (green line) and when it makes purchases (red dots):
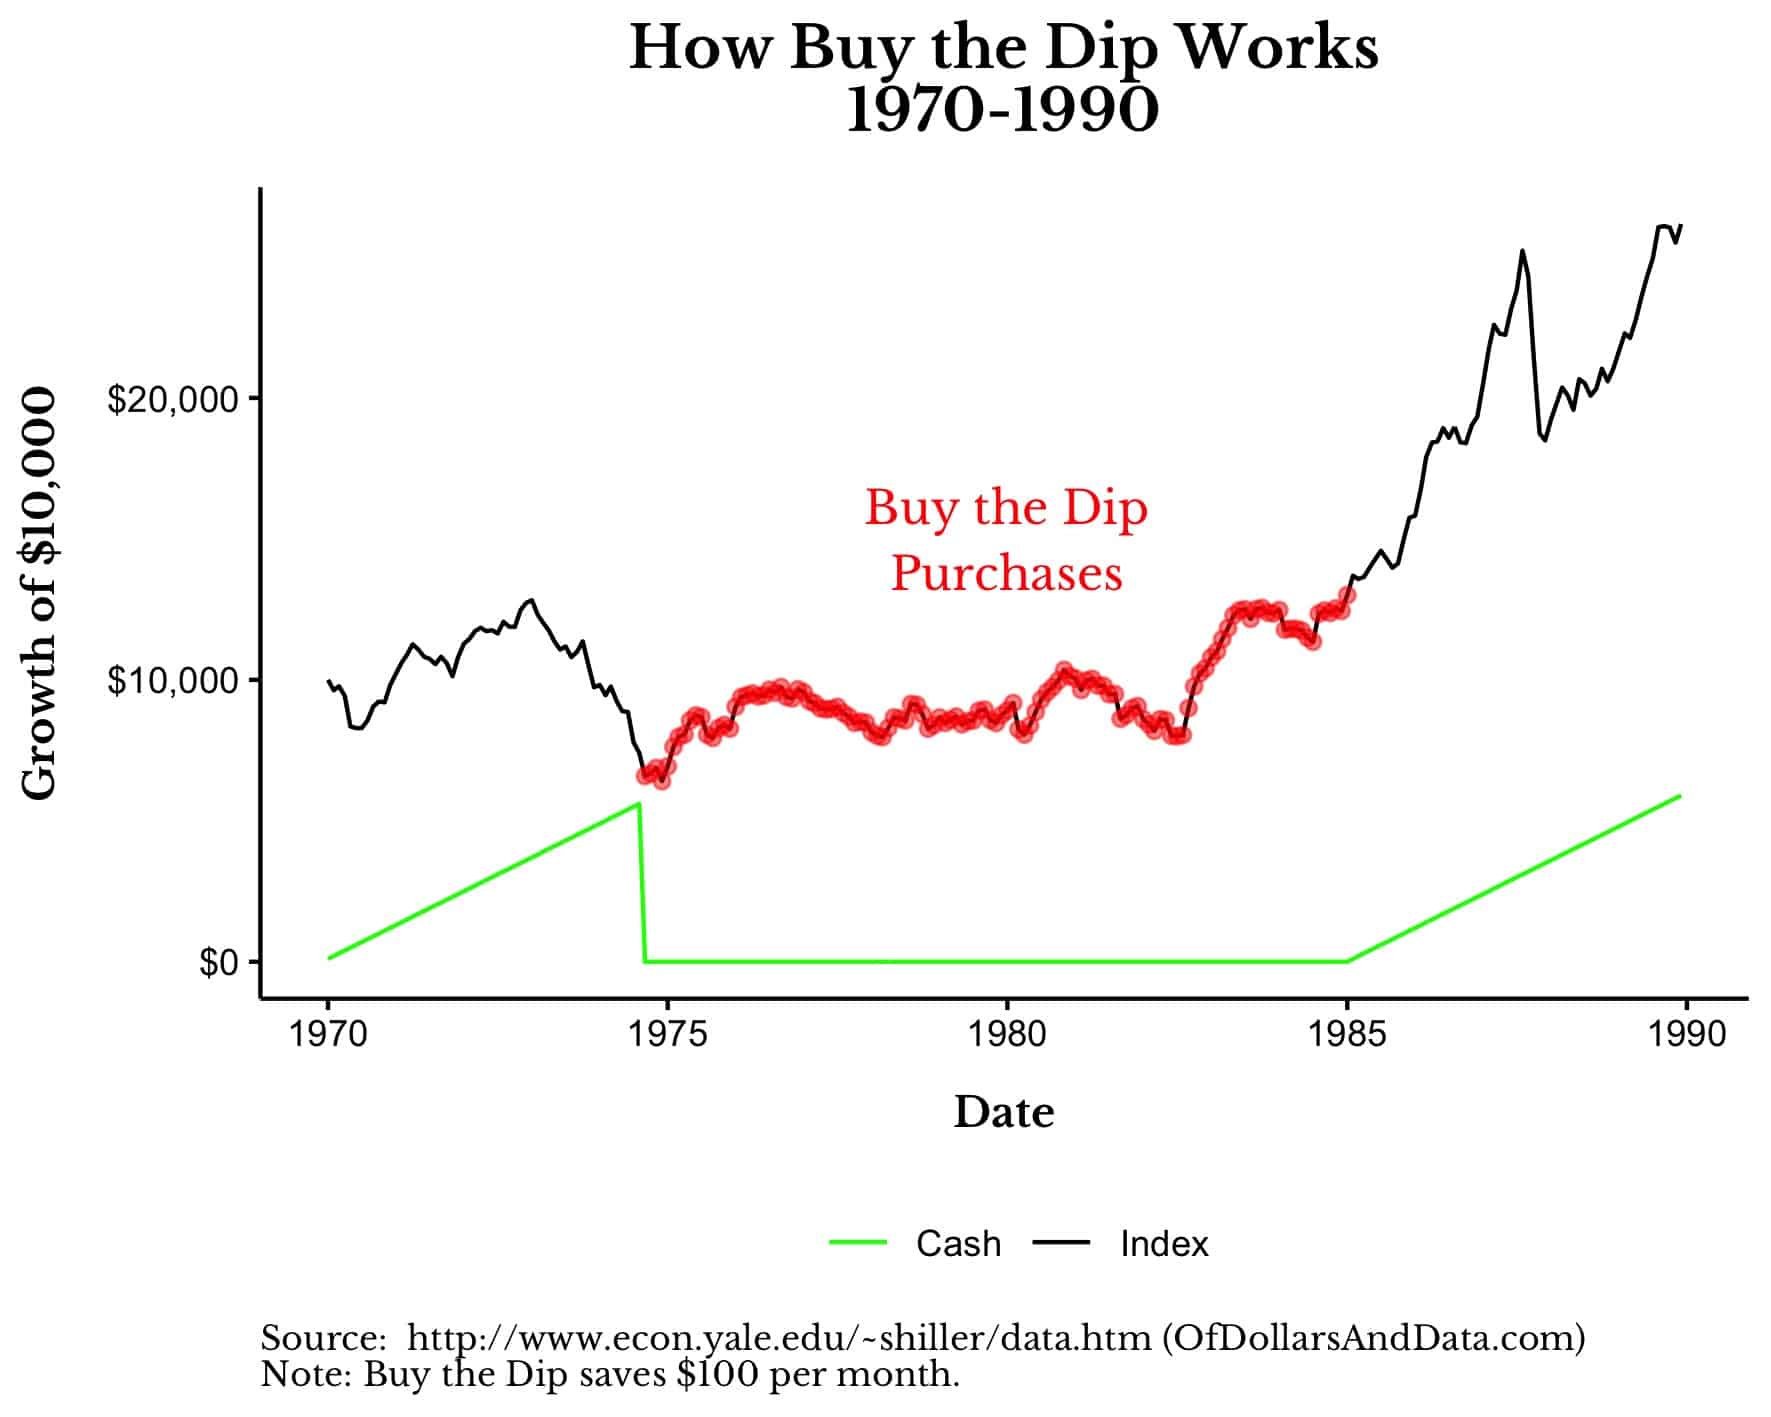 What this shows is that from 1970-1974 you are saving cash until the market is 40% below its all time highs. It’s at this point when you finally invest that cash following the 1974 crash. You then keep investing $100 every month (just like DCA) until 1984. It’s at this point when the market eclipses its all-time high from December 1972 and you go back to saving up cash again.
If we were to visualize how Buy the Dip compares to DCA (i.e. buying every month) over this time period, we would see that Buy the Dip portfolio would win out over time:
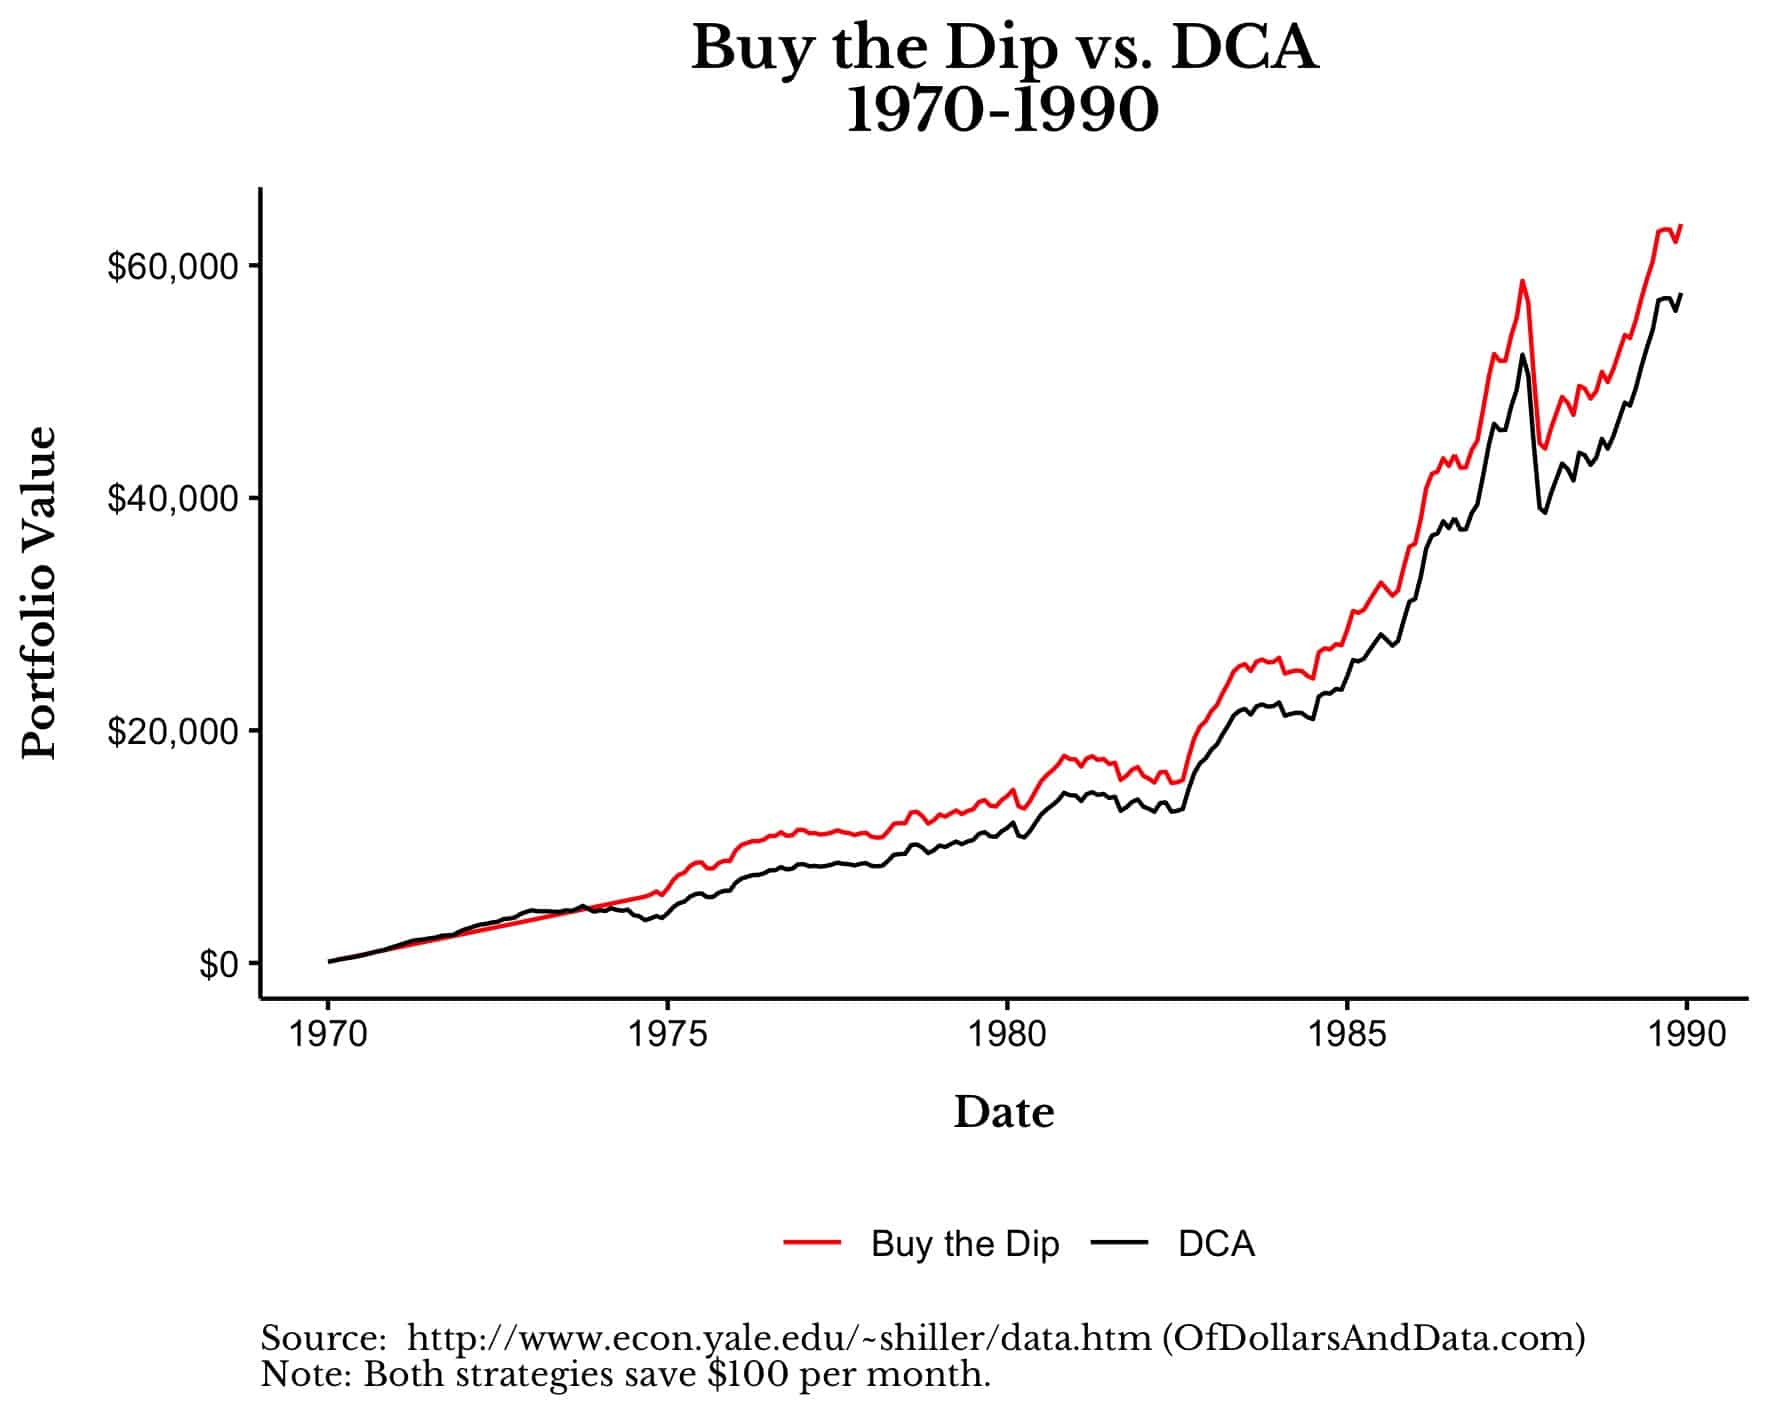
As you can see, Buy the Dip starts outperforming DCA as the market starts to decline in the early 1970s. Buy the Dip then gets invested after the 1974 crash and retains that lead for the rest of the time period.
Why Buy the Dip Wins By A Little and Loses by A Lot
As good as the 1970-1990 time period was for Buy the Dip, it’s best performance relative to DCA occurred from 1963-1983. It was during this period when Buy the Dip outperformed DCA by 29% in total, as shown in the chart below:
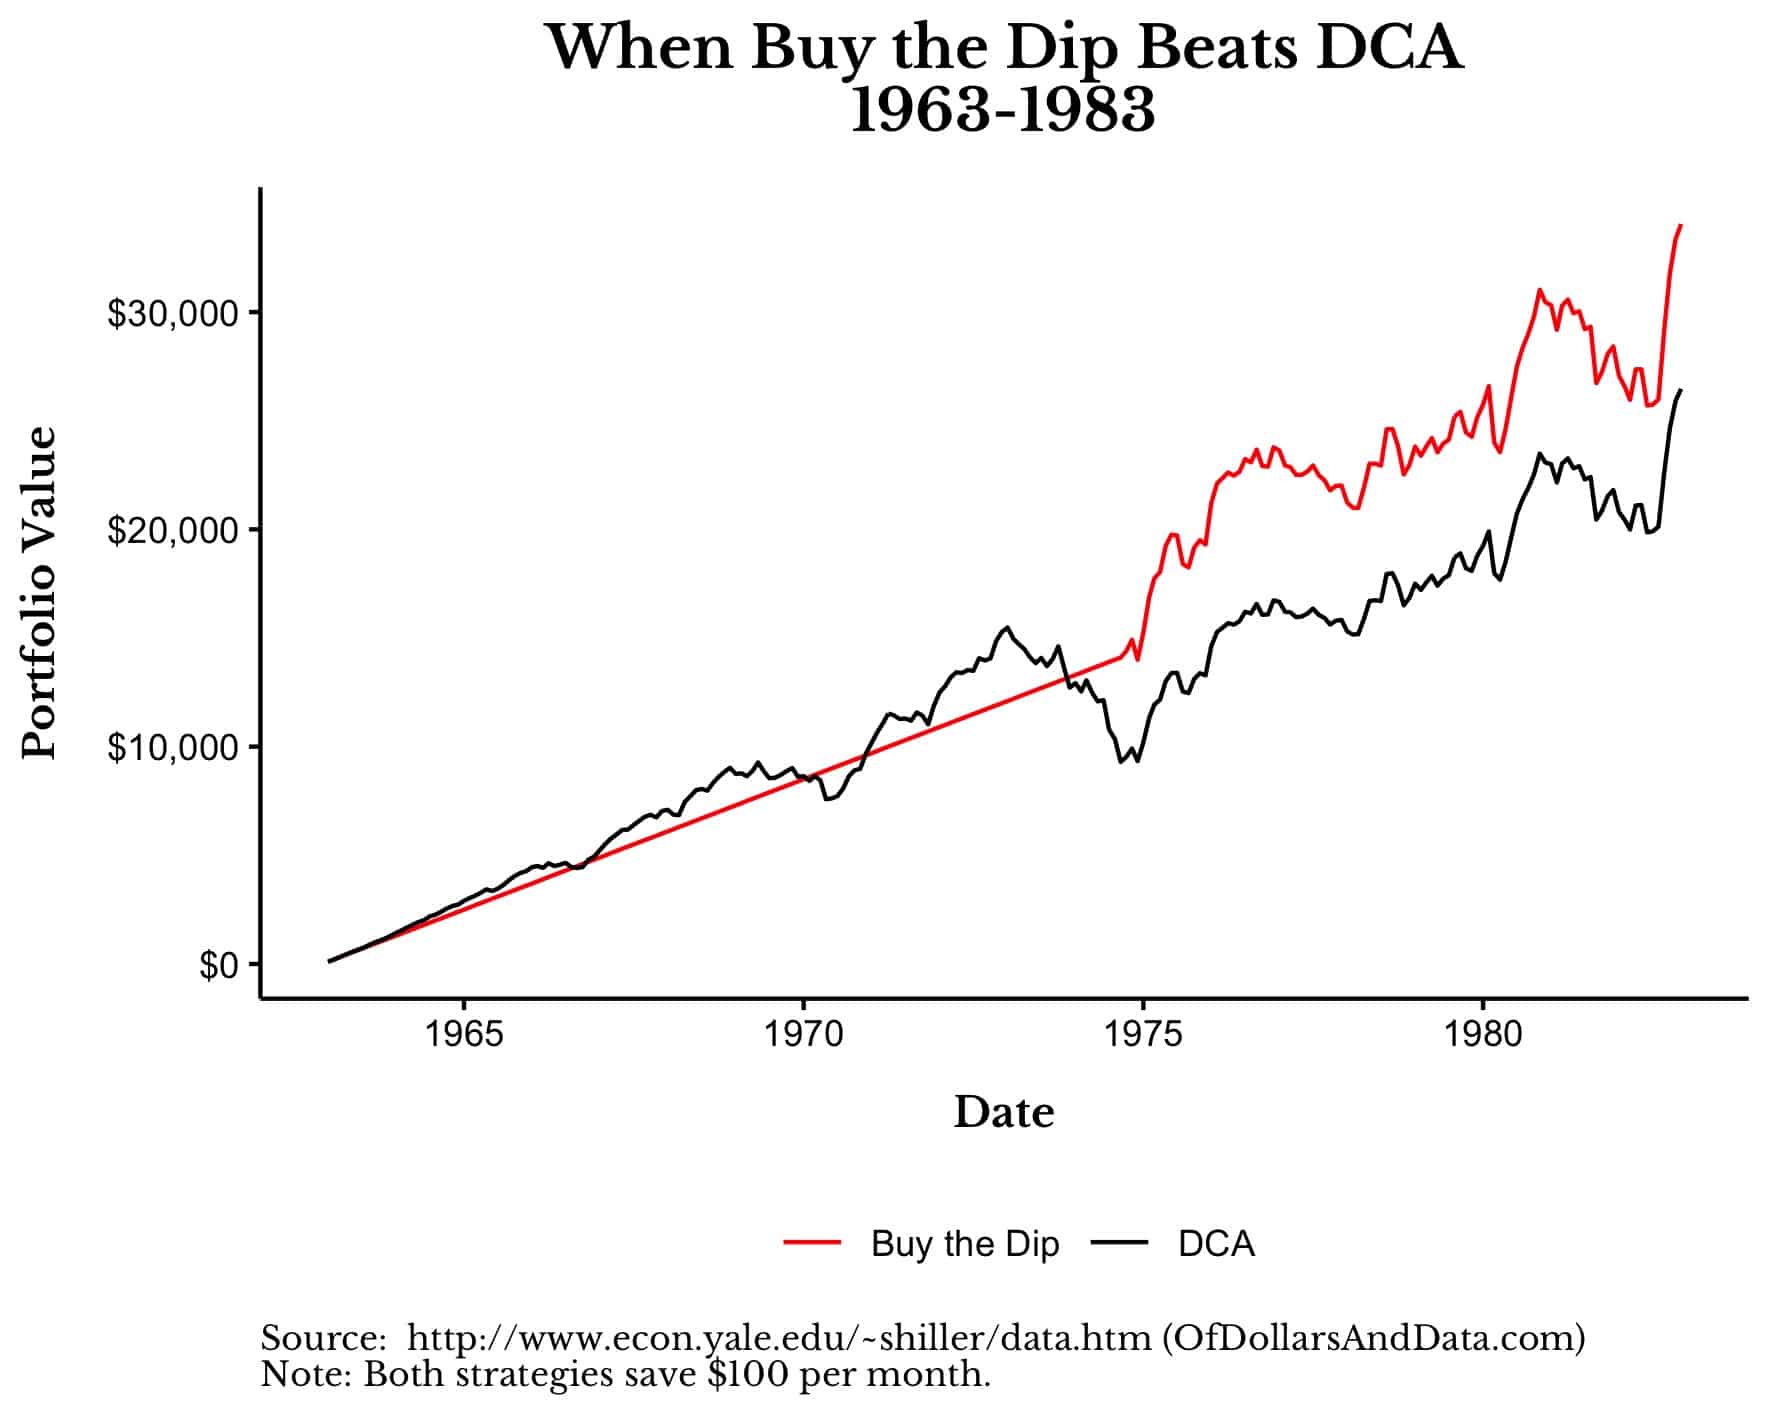
Similar to our previous chart, Buy the Dip starts saving cash in 1963 and only gets invested in the market during the decline of 1974. It’s at this point when Buy the Dip takes a lead over DCA that it never gives up. While this might seem like I am arguing for the Buy the Dip strategy, I’m not. This just happens to be one period where that strategy would have performed quite well.
Unfortunately, there are many more periods where Buy the Dip doesn’t perform quite so well. For example, if you had followed Buy the Dip from 1980-2000 with a 50% drawdown threshold, you would have sat in cash for the entire 20 years while the market ripped upward:
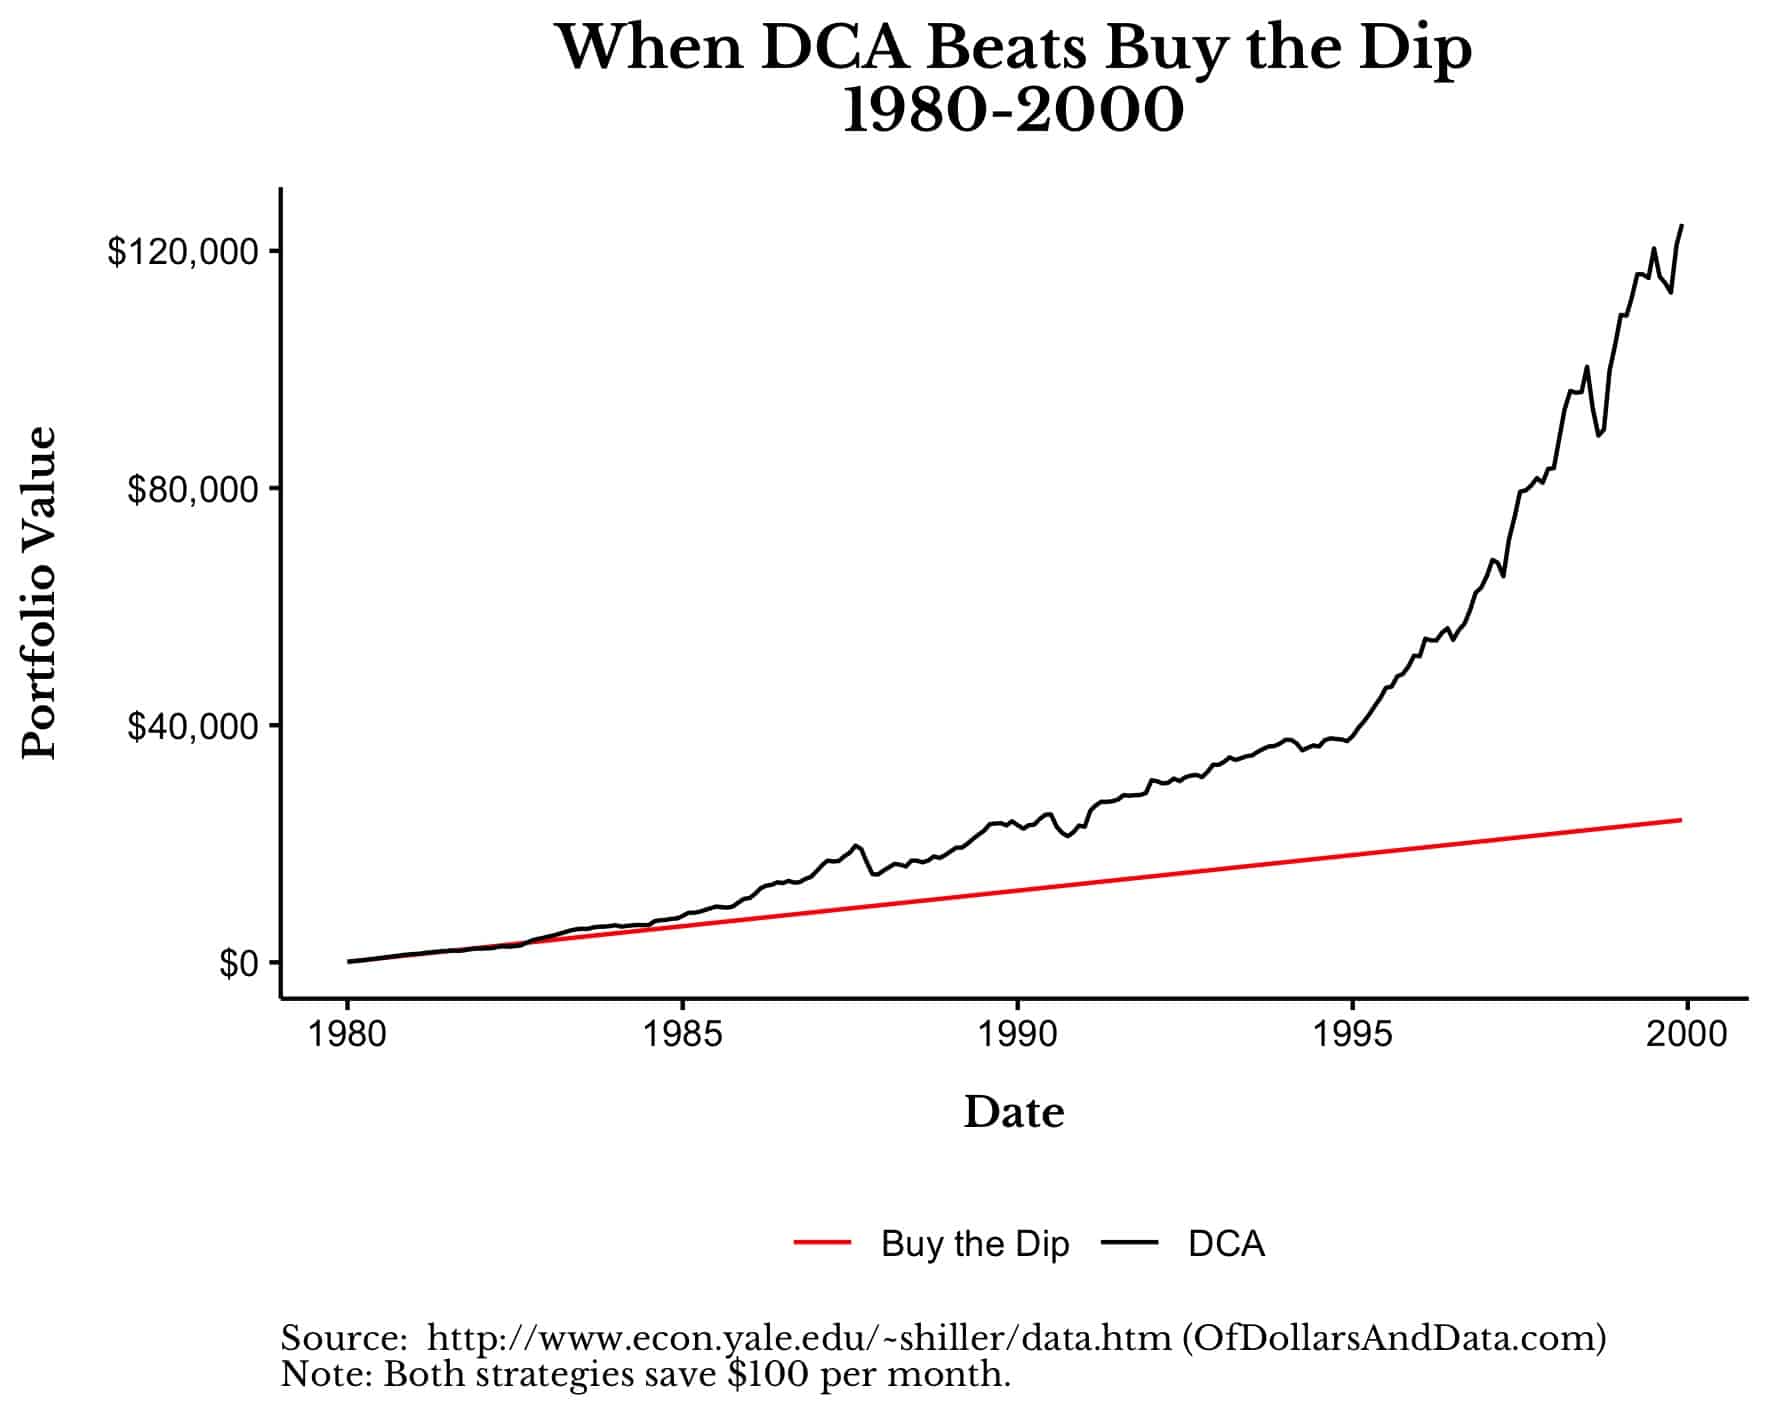
Why does Buy the Dip sit in cash for the entire 20 years? Because there are no 50% dips to buy during this time period! As a result, Buy the Dip never gets invested. And because it never gets invested, DCA ends up outperforming it by 5x ($120,000 vs. $24,000) over 20 years! That’s a massive amount of underperformance.
While this is an extreme example, it highlights the primary issue with Buy the Dip—it sits in cash for far too long.
And while it sits in cash, the market tends to go higher. As a result, you end up buying at much higher prices than if you just bought from the outset.
For example, imagine deciding not to buy until there is a 20% dip in the market. Now imagine that the market doubles without any such dip. Even if the market were to immediately dip 20%, prices would still be 60% above where they were when you started investing. Therefore, when you buy the dip, you end up buying not at a 20% discount, but at a 60% premium!
This is why Buy the Dip is such a terrible investment strategy. Because when it wins, it tends to win by a little, but when it loses, it can lose by a lot.
This asymmetric performance profile is what makes it such a subpar investment strategy. And if we look across a variety of dip buying thresholds, we can see why.
Does Dip Size Matter?
Given what I have discussed thus far, you might be wondering whether the size of the dip you wait for matters for this strategy. For example, is waiting for a 50% dip better or worse than waiting for a 10% dip? Well, it depends on what you mean by better.
Technically, you are less likely to outperform DCA in the long run by waiting for smaller dips than by waiting for larger dips. As the table below shows, the larger your dip threshold, the more likely you are to outperform DCA over some random 20-year period between 1920-2020:
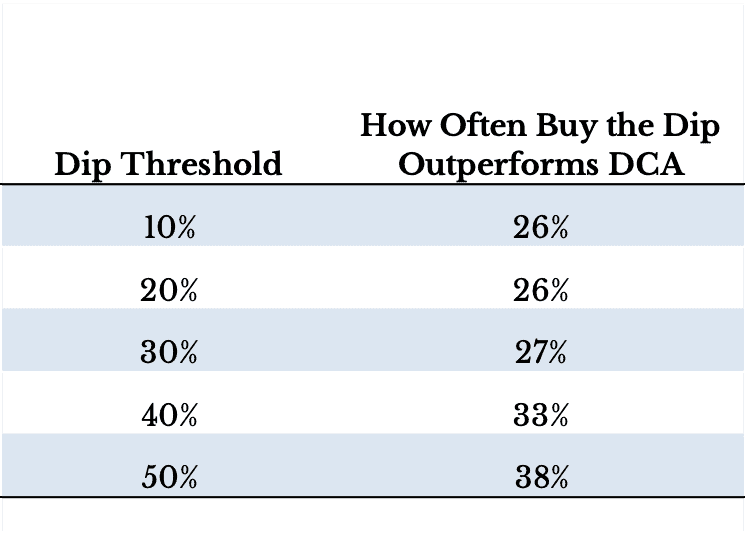
This chart shows that there is roughly a one in four chance of beating DCA when using a Buy the Dip strategy with a 10%-20% dip threshold. If you were to use a 50% dip threshold, the chance of outperforming DCA increases to nearly 40%. But this doesn’t come without a cost. Because while you are more likely to outperform DCA when using a bigger dip threshold, you also underperform by more (on average) as well.
As the table below illustrates, the median amount of outperformance when using Buy the Dip for 20 years ranges from -5% to -13% depending on which dip threshold you use (Note: negative outperformance is the same as underperformance):
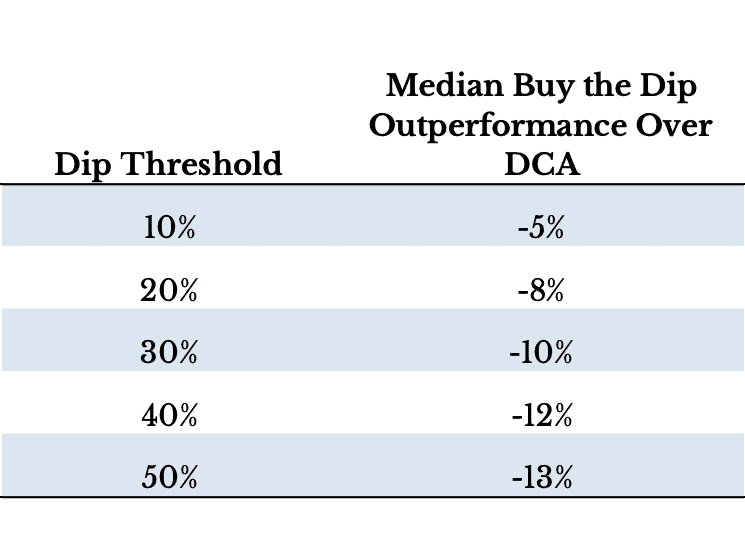
What this means is that if you looked at all 20 year periods from 1920-2020 and followed Buy the Dip with a 10% dip threshold, you would likely underperform DCA by about 5% in total (i.e. the median outcome). If you used a 50% dip threshold, you would likely underperform DCA by about 13% in total.
If you look at the distribution of relative performance by dip threshold, we can get better view of what is going on. The chart below shows how much Buy the Dip outperforms DCA (in total) for each dip threshold specified across all 20 year periods in the data.
So imagine we compare Buy the Dip to DCA from 1920-1940 using a 10% dip threshold. Then we do this for 1921-1941, 1922-1942, and so forth through 2000-2020. After that, we do all of those simulations again for a 20% dip threshold, 30% dip threshold, and so forth up to a 50% dip threshold.
Finally, we plot the distribution of the performance of Buy the Dip compared to DCA over all these simulations:
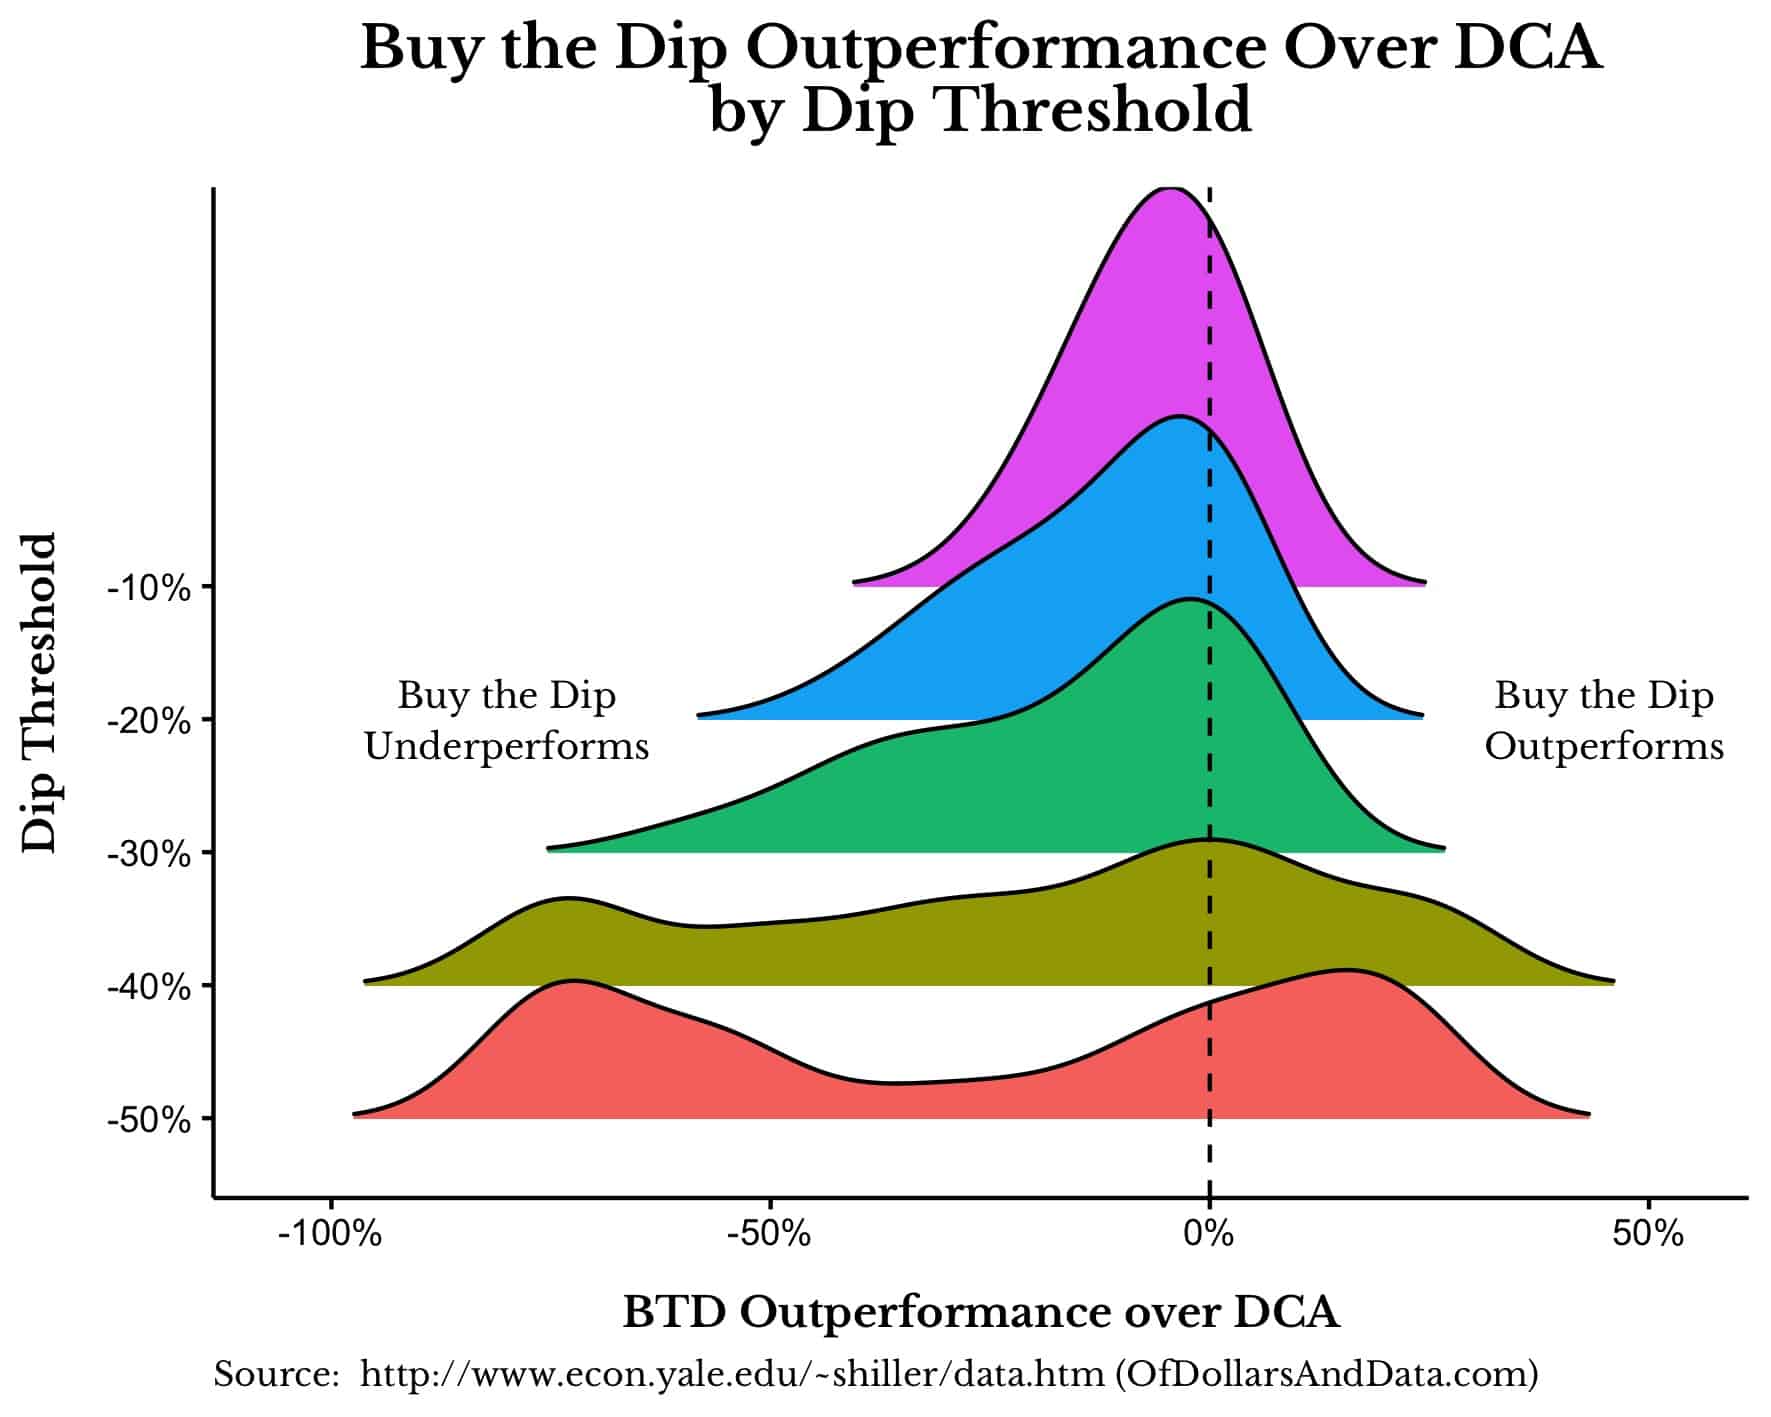
As you will see, while a smaller dip threshold is less likely to outperform compared to a larger dip threshold, the size of its underperformance will usually be smaller as well.
What this chart illustrates is that what dip threshold you use determines the likelihood and the size of your outperformance (or underperformance) relative to DCA. As the dip threshold gets bigger, the outperformance curve flattens with the middle of the distribution moving leftward (i.e. more negative on average). This means that, when your dip threshold increases, the outperformance is more extreme, but the underperformance is also more extreme as well.
From this plot you can see why it can be worth it to wait for larger dips, but only if you get lucky. Because if you don’t get lucky, be prepared to lose a lot relative to DCA.
The Bottom Line
While it can be intriguing to stockpile cash to buy the dip, the data above suggests that this strategy is unlikely to win out in the long run. If you happened to successfully buy the dip once, take your victory lap then get back to investing as soon as you can. Though you might think you have the ability to market time, I suggest attributing your trade to good luck and then moving on.
The reason why Buy the Dip usually fails is simply because market dips, especially larger dips, are rare. Without dips to buy, Buy the Dip is just an 100% cash strategy, which is a terrible way to invest for the long term. More importantly, while large dips can generate larger returns, predicting them beforehand is near impossible. So be careful before waiting for one because your portfolio is likely to miss out.
Lastly, while the analysis shown here was done on U.S. stocks, you can generalize it to any asset class that is expected to have a positive long-term return. If you want to argue that Buy the Dip beats DCA for some asset class that dips a lot more than U.S. stocks, then have at it. Because, I don’t know about you, but I like to buy assets that tend to go up.
This concludes our memorial service for Buy the Dip today. Happy investing and thank you for reading!
If you liked this post, consider signing up for my newsletter.
This is post 260. Any code I have related to this post can be found here with the same numbering: https://github.com/nmaggiulli/of-dollars-and-data

