A few weeks ago the S&P 500 index dipped below its 200-day moving average for the first time since 2023. For the uninitiated, the 200-day moving average is often used as a price signal for when to sell stocks and avoid a market crash. This is mostly due to this signal’s success at identifying such crashes historically. Anytime the S&P 500 dipped below its 200-day moving average, it usually meant that market trouble was on the way.
Using a price signal (such as the 200-day moving average) to make asset allocation decisions is an investment strategy that falls under “trend following.” And while trend following does sound good in theory, in practice it’s much harder than it looks.
This blog post will explain how trend following works, how it has performed over time, and some of the difficulties of following it. Let’s start by exploring how trend following works in practice.
How Does Trend Following Work?
Trend following is the act of using a price or market signal to determine when to make allocation changes to your portfolio.
One of the simplest trend following strategies uses a moving average to determine when you should be in stocks and when you hold other, less-risky assets. A moving average is an average that changes over time based on the prior values in a data series. These prior values can be on any time scale you want, but the most common ones are daily or monthly.
For example, the S&P 500’s 200-day moving average is the average closing index value of the S&P 500 across the last 200 trading days. If you wanted to use a monthly moving average instead (e.g., the 10-month moving average), you could take the average closing index value of the S&P 500 at the end of the last 10 months.
But that’s just how you calculate the moving average. If you wanted to make this into an actual trend-following strategy, you would need to create some rules about what to do based on that moving average. For example, here is how a simple trend following strategy (using the 200-day moving average) might work in practice:
- Anytime the S&P 500 closes above its 200-day moving average, on the next day, own 100% U.S. stocks (aka the S&P 500).
- Anytime the S&P 500 closes below its 200-day moving average, on the next day, sell all your stocks and sit in cash.
- Alternatively, instead of holding 100% cash, you could own U.S. bonds or put that cash into a money market fund. This way you can earn some yield while you wait for the index to recover and exceed its 200-day moving average once again.
The 200-day moving average is just one implementation of trend following though. In reality, there are an infinite number of ways you could use price signals (or other economic indicators) to determine when to buy or sell assets. For example, you could look at multiple signals at once. You could vary how often you check those signals. You could use an exponential moving average (to up-weight more recent prices). And more.
However you decide to implement a trend following strategy, the purpose is to sell out of risk assets before they enter a volatile period. This is how you can improve your performance. With that being said, let’s review how trend following has performed historically.
How Has Trend Following Performed Historically?
In general, trend following performs well during difficult periods in the stock market, but less well otherwise. This is by design. Since a trend following strategy is meant to avoid volatility, it typically outperforms during volatile periods, but experiences false positives (i.e. exits stocks when it shouldn’t have) in other times. It’s these false positives that create a drag on performance during market booms.
You can see an example of this performance drag by looking at the 200-Day Moving Average (“200-Day MA”) strategy for the S&P 500 compared to a Buy & Hold portfolio from 1999-2000. During this period, which coincides with the end of the DotCom boom, the 200-Day MA strategy severely underperformed Buy & Hold.
However, if you had kept following this strategy, you would’ve outperformed Buy & Hold by the end of the DotCom crash (in 2003) and in the aftermath of the GFC as well:
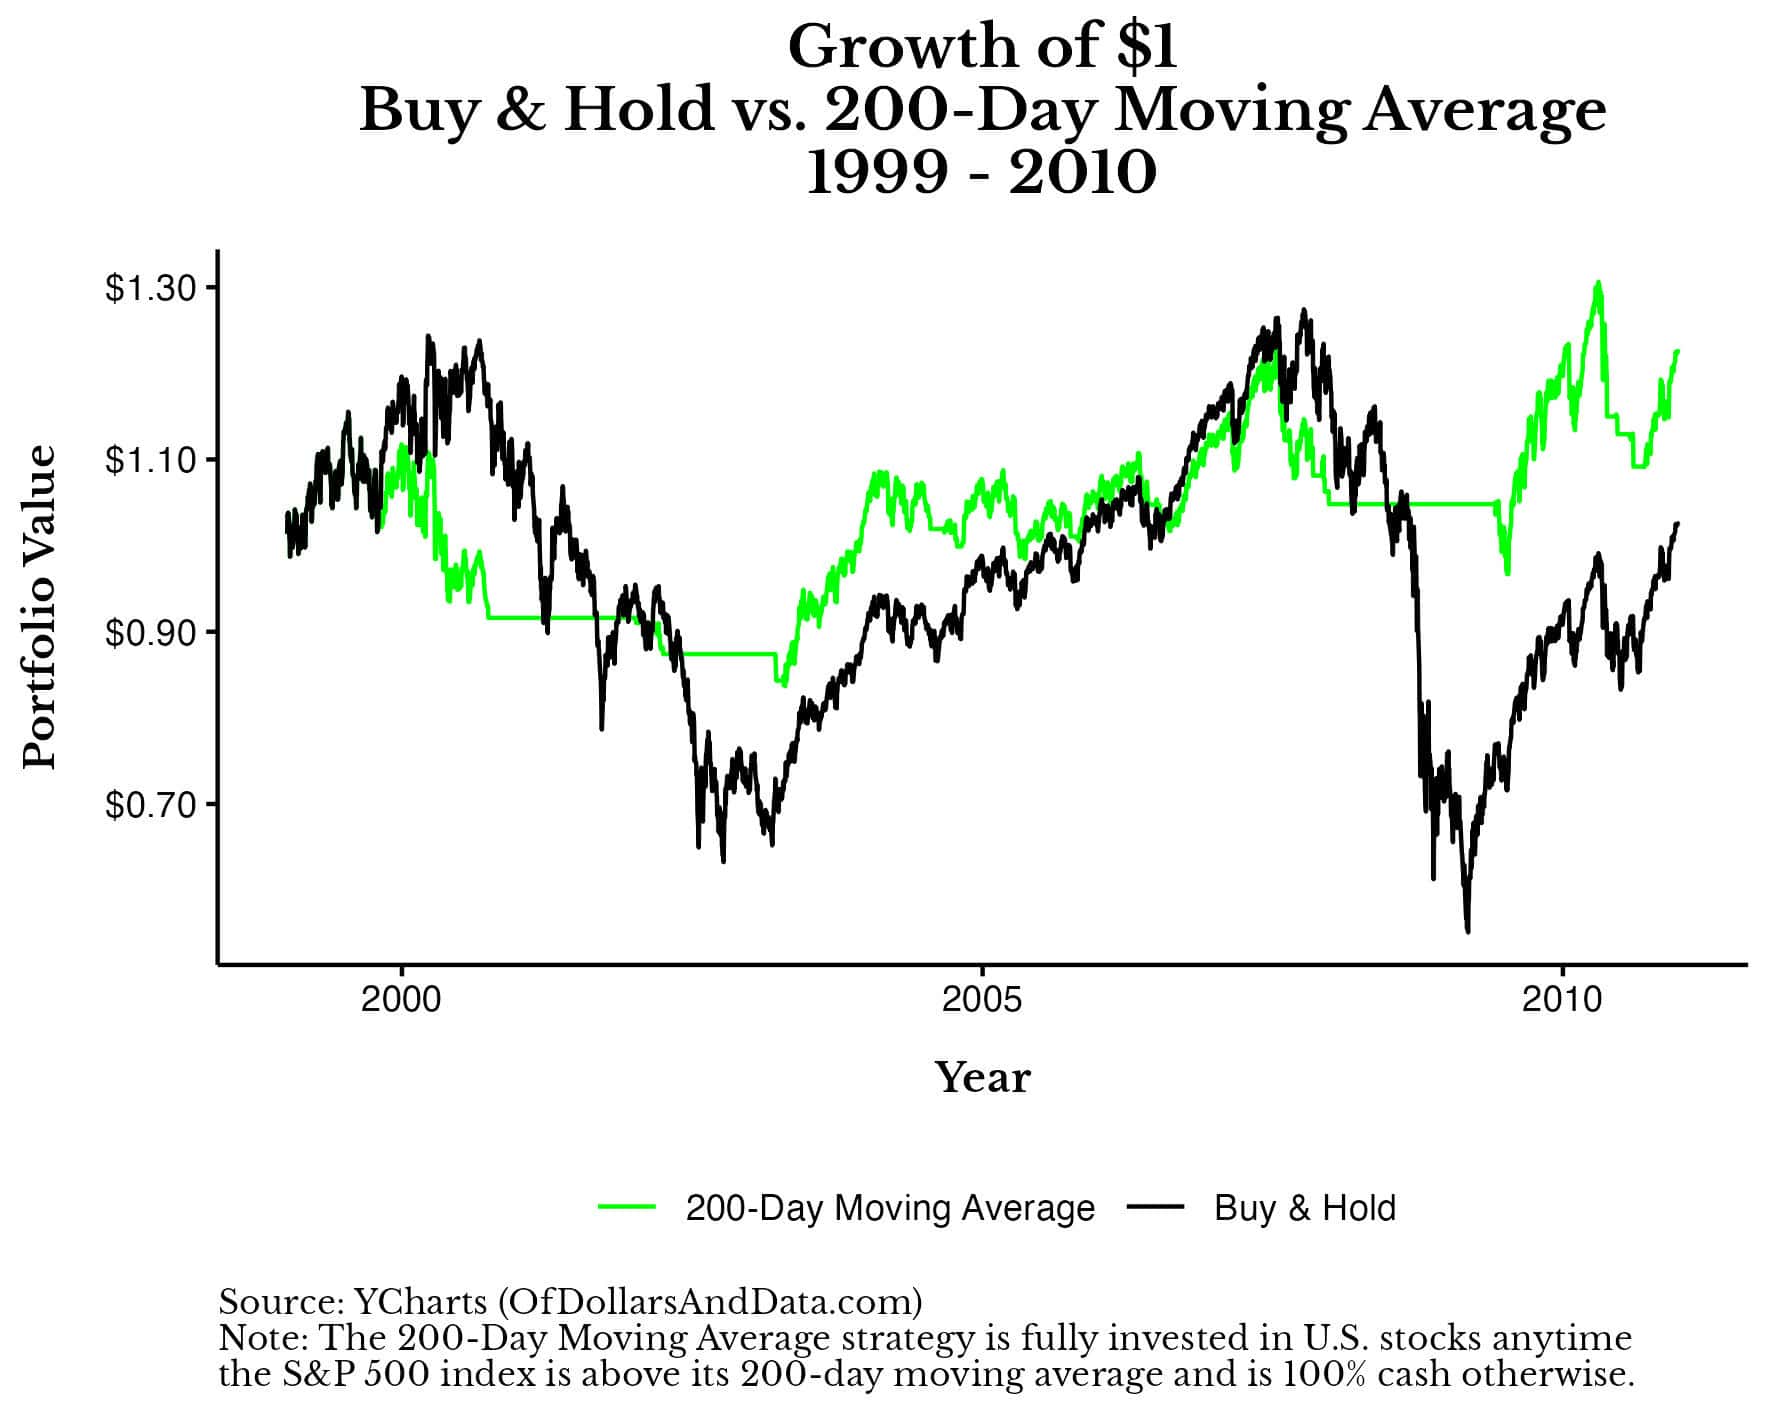
This is the textbook example for when a trend following strategy works. You have two back-to-back market declines where the 200-Day MA made the right call in moving you out of stocks and into cash to ride out the storm.
More importantly, this strategy outperformed while also experiencing lower overall volatility than Buy & Hold. The standard deviation of daily returns for the Buy & Hold portfolio was 1.36% during this period. However, the standard deviation of daily returns for the 200-Day MA strategy was only 0.72%. This means that the 200-Day MA strategy outperformed Buy & Hold while experiencing roughly half its volatility!
Unfortunately, this performance hasn’t repeated in recent years. Though the 200-Day MA strategy performed well from 1999-2010, if you had kept following it through the end of 2024, things wouldn’t have been pretty:
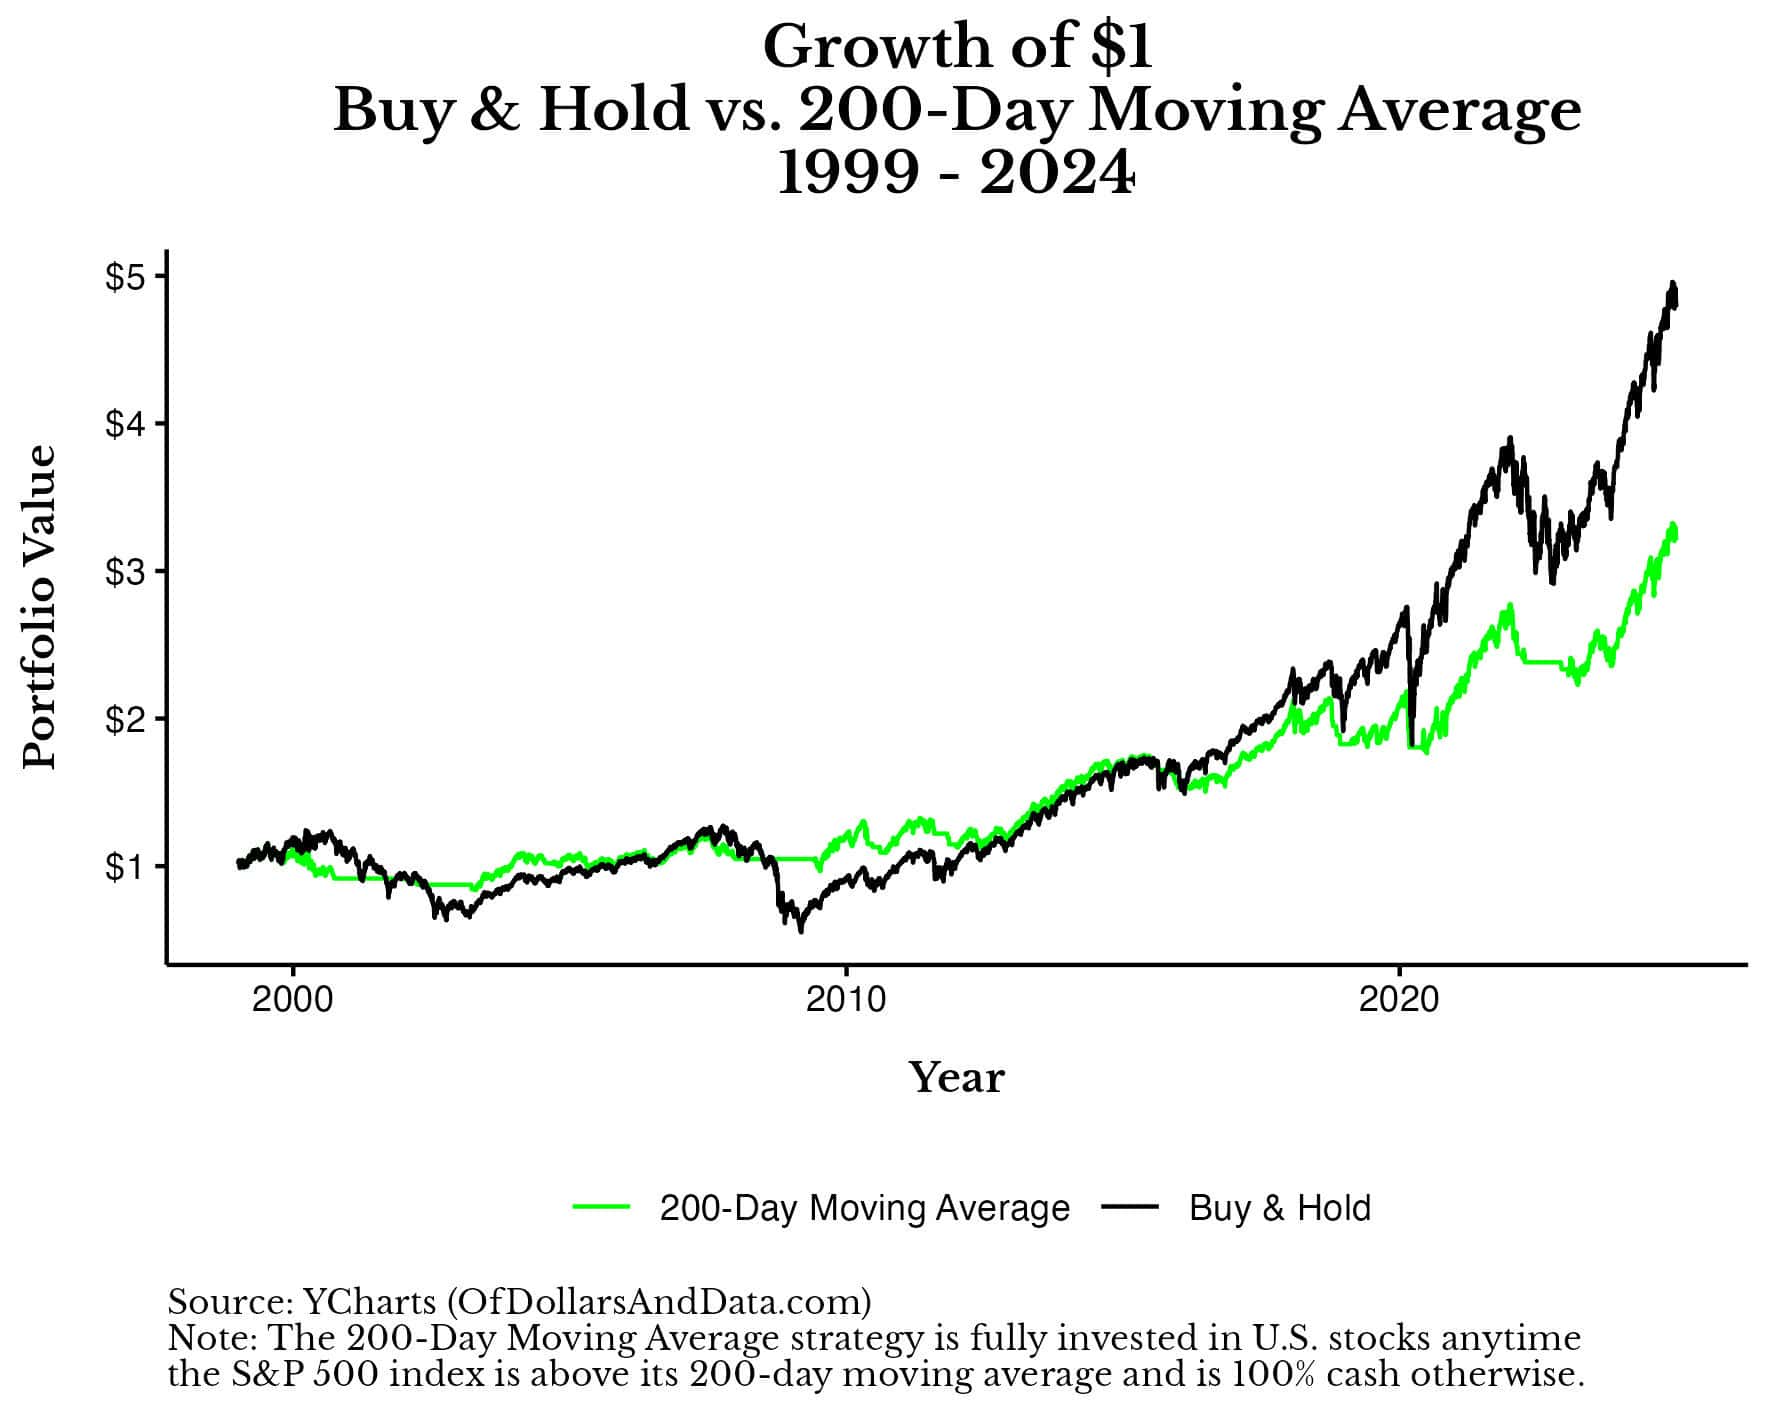
As you can see, what worked throughout the lost decade (2000-2010), failed miserably in the 14 years thereafter.
The reason is simple—there weren’t any long-term declines in asset prices. The longest market decline since the GFC occurred in 2022. And while the 200-Day MA strategy made up some ground relative to Buy & Hold during this period, it wasn’t enough to offset its underperformance throughout every other period since the GFC.
It’s easy to brush this off as a fluke, but, relative to history, it does seem like we may be in a new era for trend following. Because, going back to 1950, the 200-Day MA strategy outperformed Buy & Hold up until after the GFC:
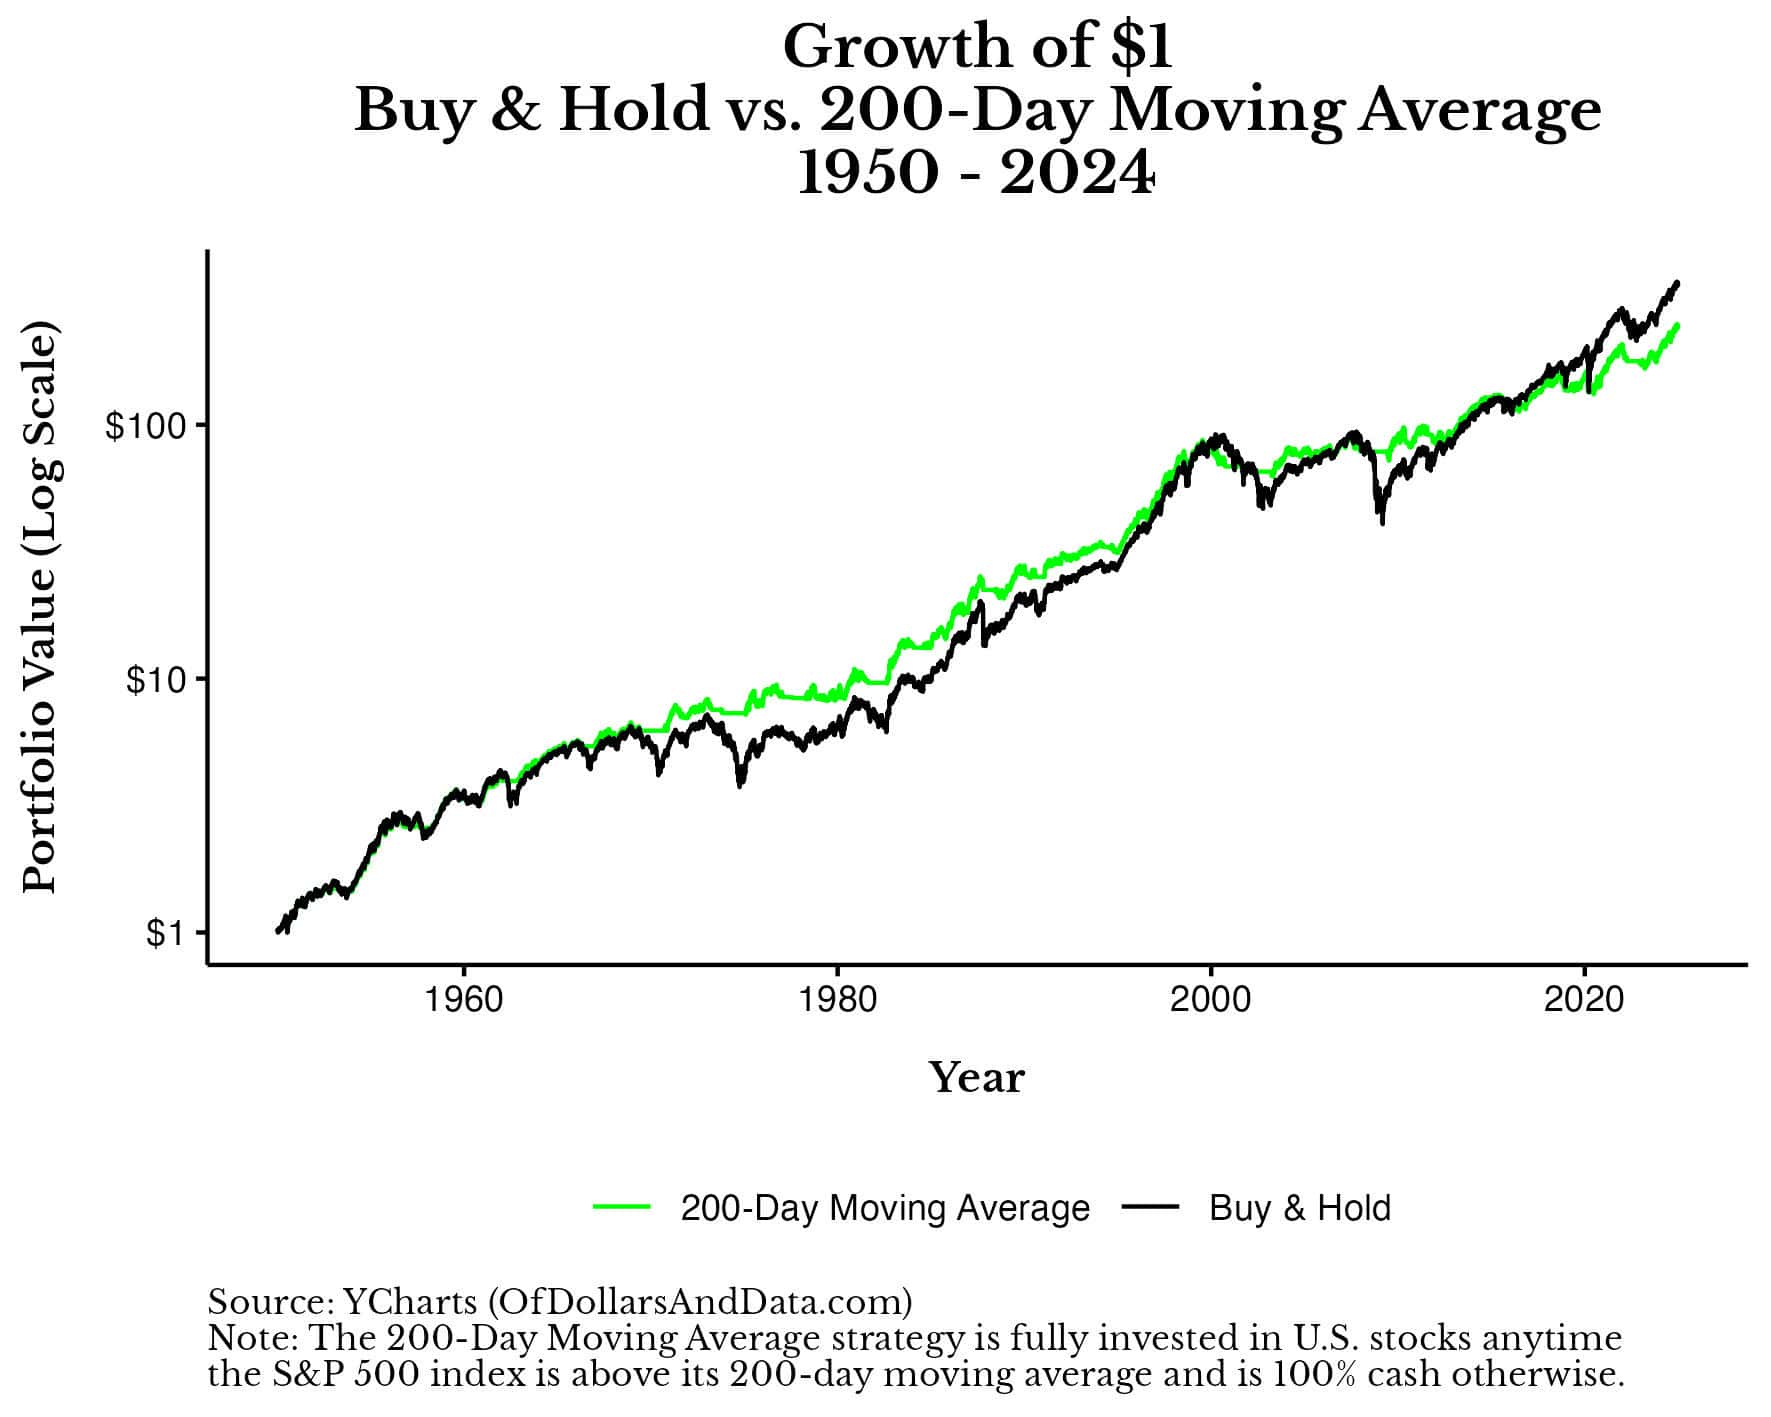
Has trend following stopped working? Or is this just a one-off period that will be reversed in the coming years?
While I don’t know the answer, I do know that even when trend following does work, it’s not as easy as it seems.
The Difficulties of Trend Following
While trend following might look easy in a backtest, in the real world it’s much more difficult to stick to. The reasoning is three-fold: there are false positives, missed recoveries, and delayed outperformance. I will cover each of these in turn.
False Positives
One of the greatest difficulties with implementing a trend following strategy are all the false positives that the strategy experiences. A false positive in this case is when the strategy says to sell out of stocks though you would’ve been better off had you stayed invested.
For example, below is a chart showing every Exit and Re-entry point for the 200-Day MA strategy from 1999-2010. As a reminder, an “Exit” is when the strategy gets out of stocks and the “Re-entry” is when it buys back into stocks:
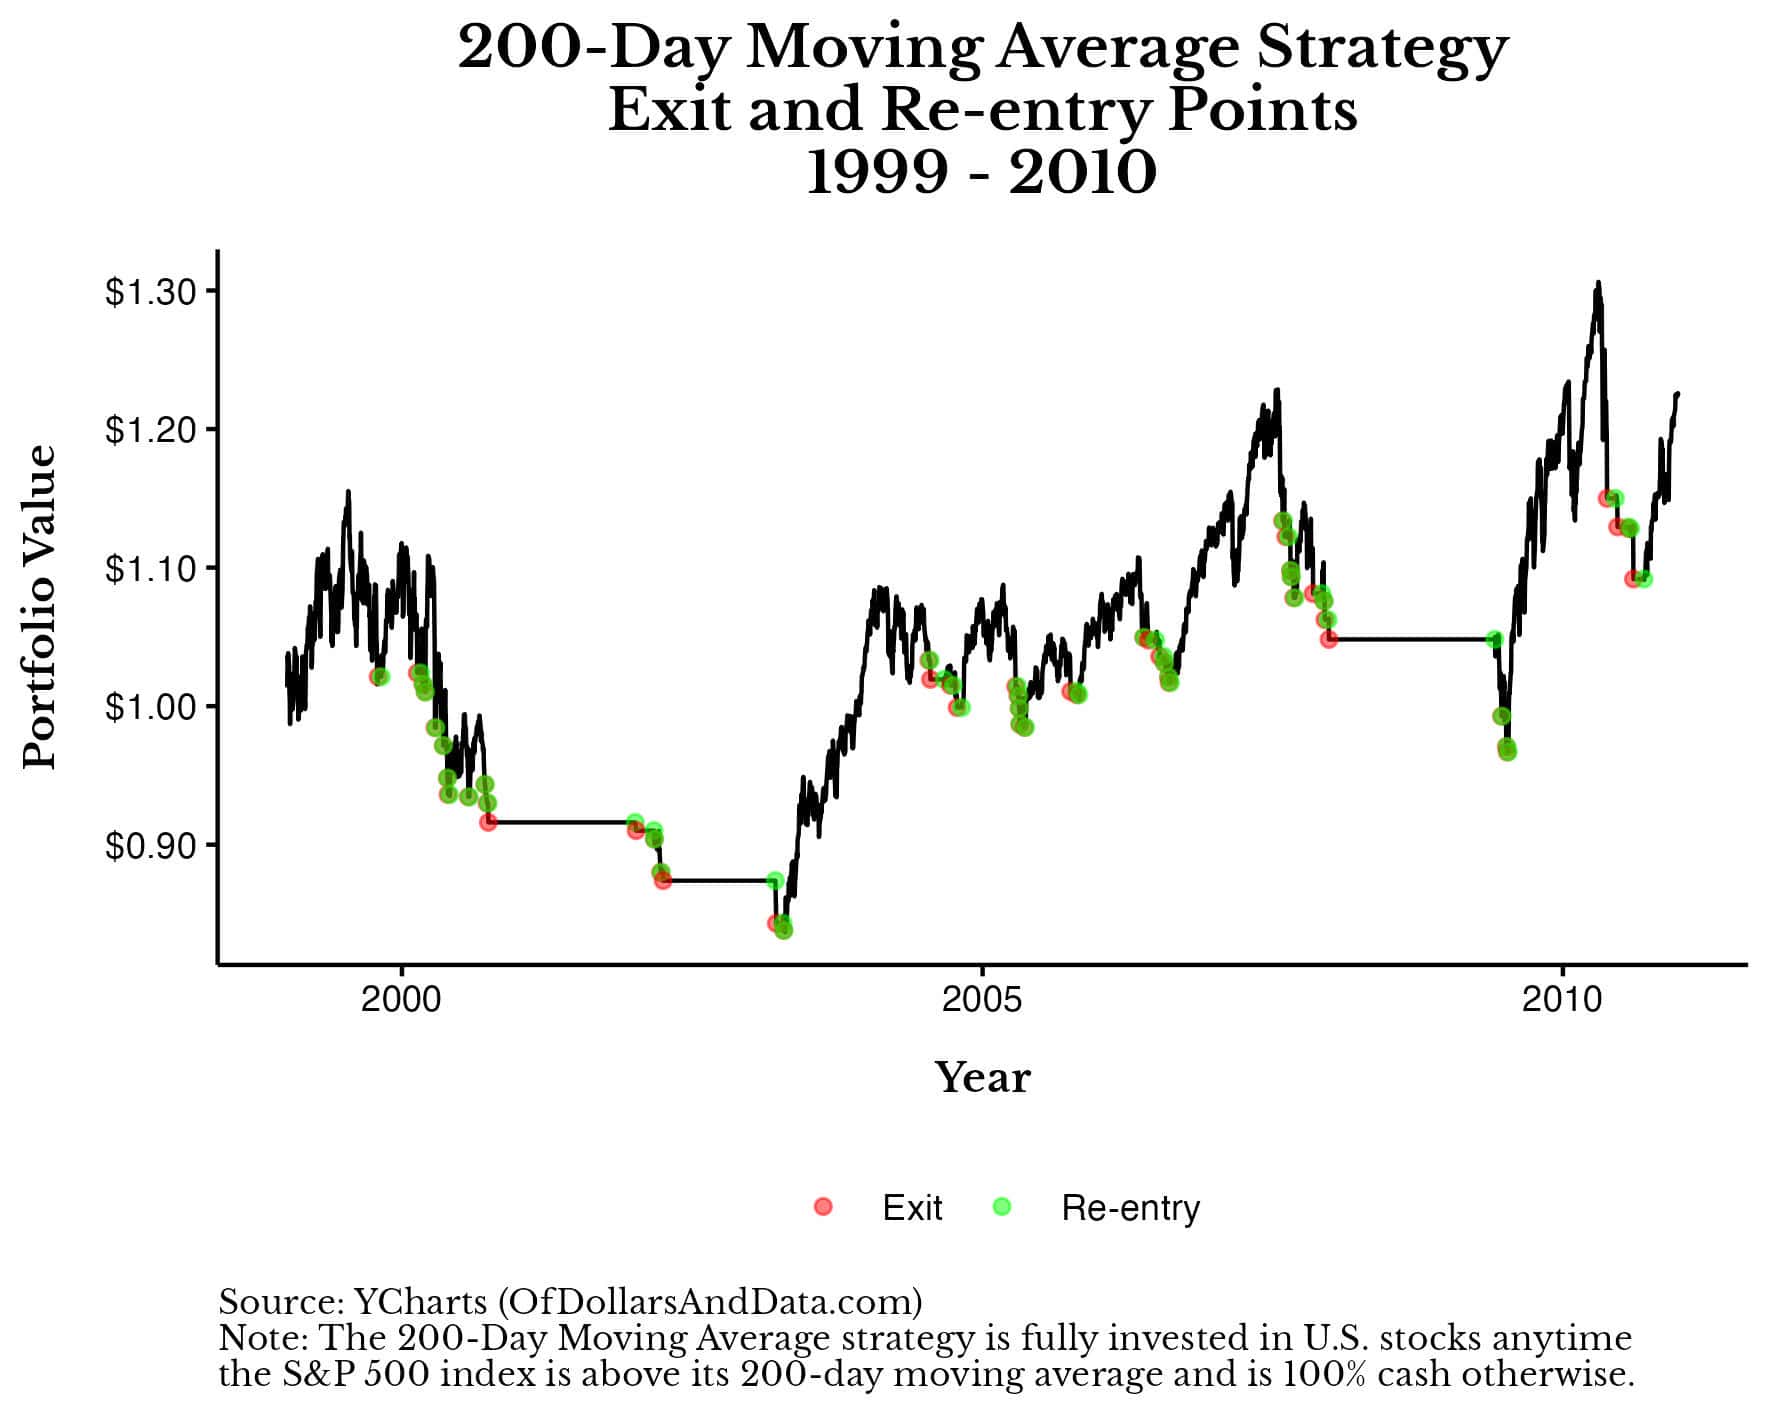
In total, the 200-Day MA exited stocks and re-entered them 47 times throughout this 10-year period. If this strategy didn’t experience false positives, it would’ve only exited stocks twice—once in 2000 and once again in 2007. Technically, every other exit (and re-entry) was a false positive.
This demonstrates how trend following tends to be too skittish when it comes to exiting the market. It leaves at the first sign of trouble, which isn’t always correct. While this skittishness is helpful overall during periods like 1999-2010, it can also lead to many false positives as well.
The true difficulty of these false positives is that they occur both when trend following outperforms and when it doesn’t. So you can’t tell beforehand whether the current exit is legitimate or a fake out.
Some have argued that the solution to false positives is to use a less sensitive moving average (e.g., monthly rather than daily). While this can reduce their frequency, unfortunately, such false positives will still occur.
Even if you are able to stomach the false positives, you may find more difficulty in missing out on the big recoveries.
Missed Recoveries
One of the other issues with utilizing a trend following strategy is the missed recoveries. During periods of high volatility, stocks tend to have their largest down and up days. So after you exit the market, by the time you get back in you could’ve missed a lot of the upside. This isn’t just conjecture though, there is data to back it.
From 1950-2024, the median 1-year return for the S&P 500 when the 200-Day MA was out of the market was 12.8% compared to 9.4% when it was fully invested. This goes to show that during periods of volatility, the market can recover quite well.
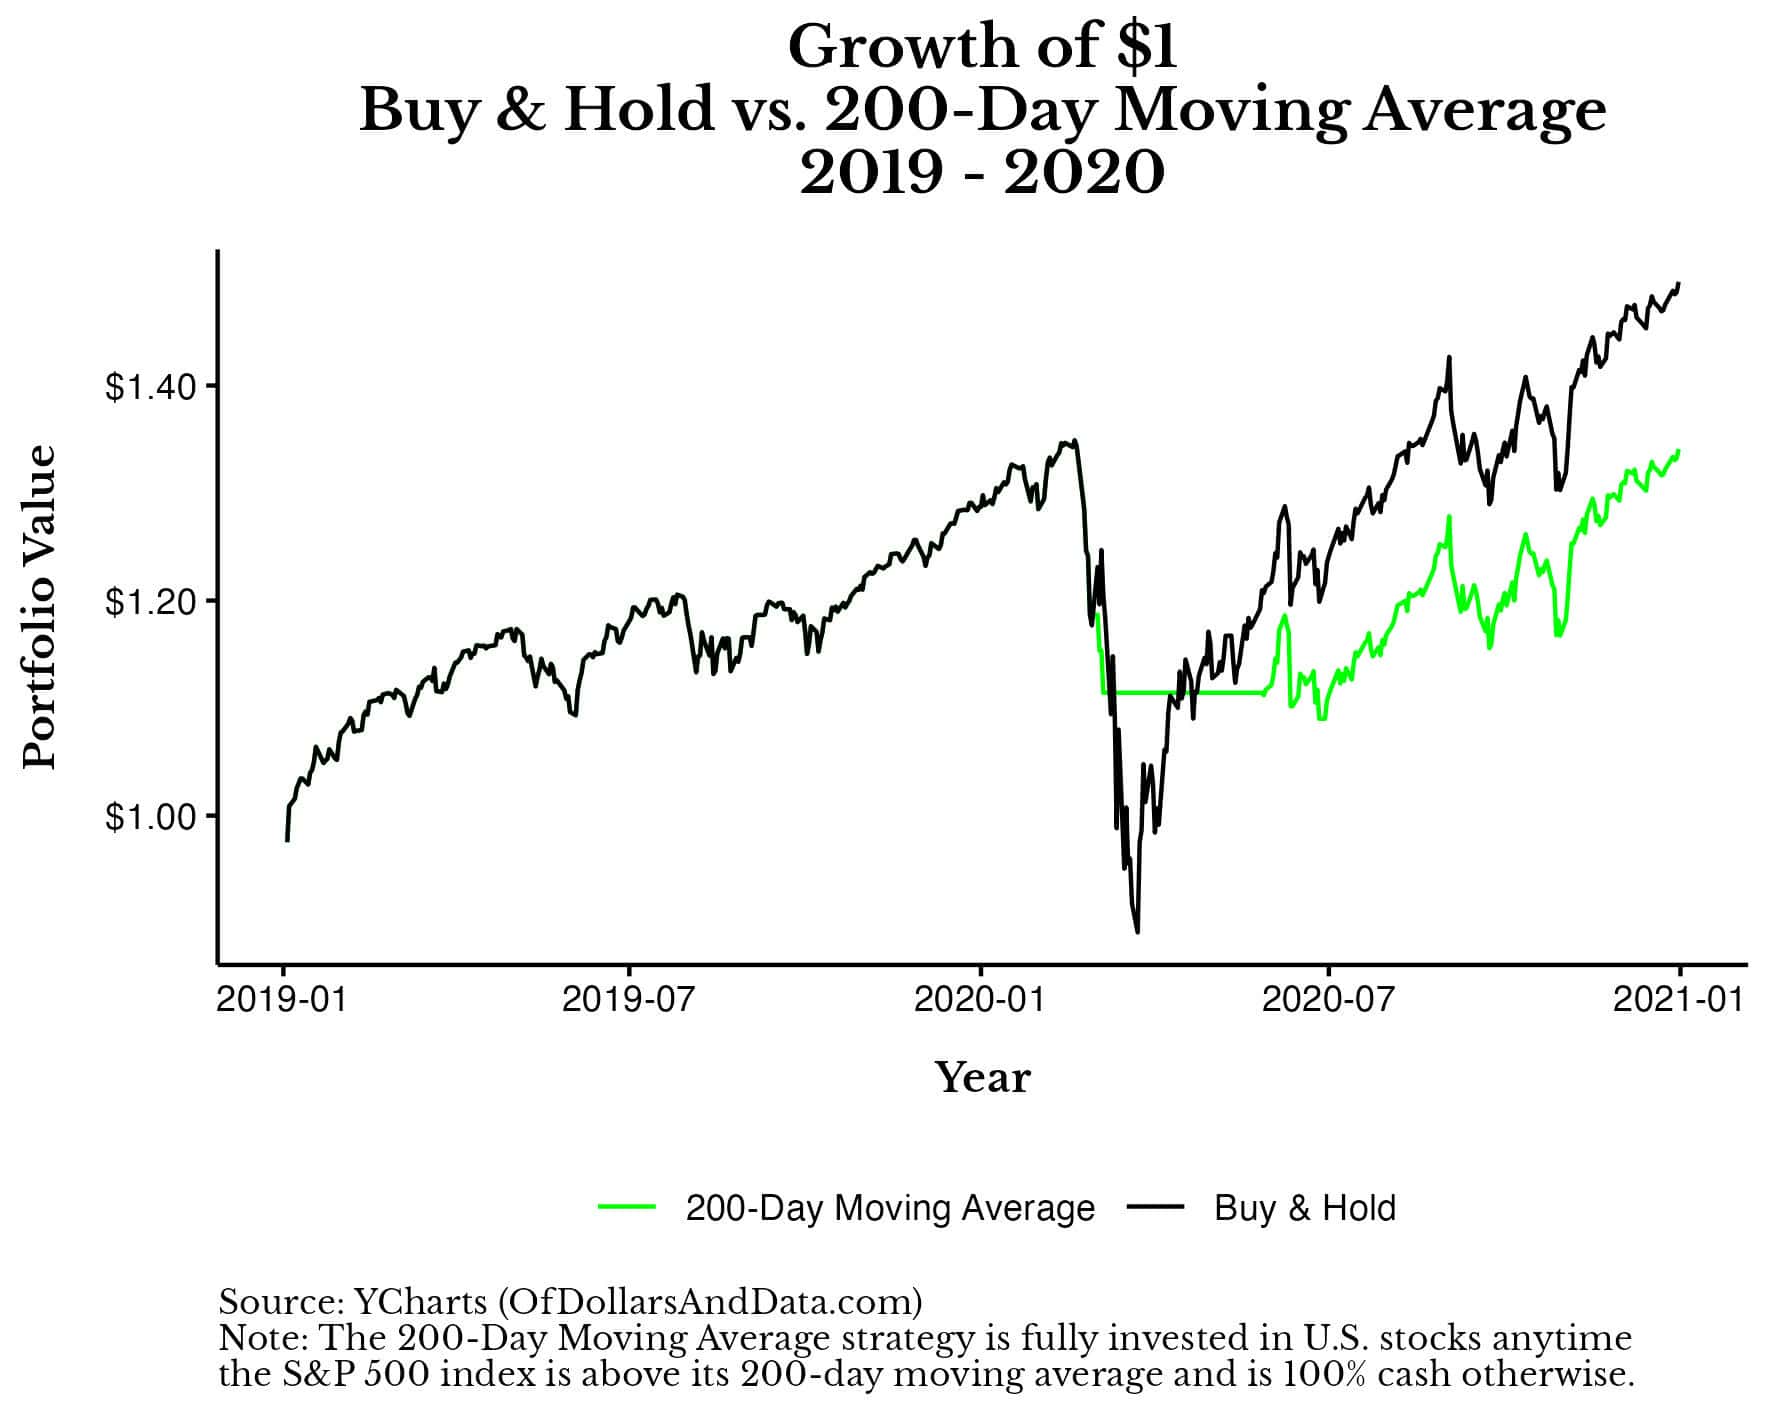
Visually, we can see an example of this during the recovery from the March 2020 COVID crash below. The 200-Day MA strategy exited the market during this crash, but it didn’t get back in until the market had already experienced a significant recovery.
So while it missed the downside, it missed the upside as well. The result was underperformance by the 200-Day MA strategy (relative to Buy & Hold) through the end of 2020:
Anyone following a similar strategy over the past few years knows this pain well. The 2020 crash and recovery was unlike anything we’ve seen recently in terms of its speed. As a result, many trend following models that had been successful historically dropped the ball during COVID.
If it’s true that markets are pricing in information more quickly than ever before, than many of the slower trend following strategies will miss out on future, quick recoveries. The only solution to this is to use a trend following strategy that re-enters more quickly, but this may could increase false positives as well.
Unfortunately, there is no silver bullet when it comes to trend following as solving one problem may produce another. But of all the issues I have with using a trend following strategy, the delayed outperformance is by far the worst.
Delayed Outperformance
Even if false positives and missed recoveries don’t bother you, waiting for your outperformance just might. This is the primary reason why I couldn’t rely on a trend following strategy with most of my money—you have to wait for your outperformance.
Let’s look back at the 1999-2010 period with the 200-Day MA strategy to see what I mean:
In this chart there are two periods where you had to wait to outperform a Buy & Hold portfolio. One occurred in 2000 as the DotCom Bubble was still collapsing and the other occurred in 2007, before the 2008-2009 decline.
Now imagine following this strategy from 1999-2000. Over this period you’ve experienced false positives and have lost a lot of money (relative to Buy & Hold). And then in late 2000, the strategy tells you to go to 100% cash. If you had done so, it would be 18 months before it was clear that this was the right choice.
A similar thing happened with this strategy in 2007, however, it only took about 9 months before that decision was vindicated.
Either way, this goes to show how difficult it can be to utilize a trend following strategy even during a period where it outperforms Buy & Hold. Now imagine following this strategy during a period where it doesn’t outperform (e.g., 2019-2024). You are sitting in cash as the market leaves you behind.
This is how you drive yourself crazy as an investor. Because when following this strategy in real time, you won’t know whether it’s 1999 or 2019. And that uncertainty can drive some investors to abandon the strategy during one of these periods where you are waiting to outperform.
The Bottom Line
Trend following is not for the faint of heart. While it can reduce the overall volatility of your portfolio during extended declines, it can also create anxiety and stress with its constant false positives, missed recoveries, and delayed outperformance. Whether such a strategy fits into your portfolio and lifestyle is up to you.
Of course, this is just one implementation of a trend following strategy. You can find many others that perform better or may be a better fit for your risk tolerance.
Either way, I don’t think anyone should have 100% of their money in a trend following strategy. Though it can be useful as a behavioral crutch for some of your money during periods of high volatility, it has many flaws that make it difficult to follow indefinitely.
Though trend following works well in backtests, it’s far more challenging in the real world. Both psychological factors and how markets have evolved over time have made this so. If you want to follow this strategy with some of your money, be my guest. Just know that the hardest part of this strategy is sticking with it when it doesn’t seem like it’s working.
Happy investing and thank you for reading!
If you liked this post, consider signing up for my newsletter.
This is post 443. Any code I have related to this post can be found here with the same numbering: https://github.com/nmaggiulli/of-dollars-and-data

