Imagine it is January 1, 2020 and you are talking with a friend who’s portfolio has been 100% cash since 2017. You ask them whether they want to buy some stocks and they reply that “prices are too elevated” and mumble something about the CAPE ratio.
Now fast-forward to late March 2020. Equity markets have experienced their fastest selloff ever with stocks down 30% (or more) off their highs across all the major indices.
You re-approach your friend asking whether it is now the right time to buy stocks. Despite being flush with greenbacks, your panicked friend responds, “Oh no. I am going to wait for the dust to settle.”
12 trading days later, the Dow is 26% above its March 23 lows, yet your friend remains in cash.
At this point, the question you really want to ask (but don’t) is:
Has the dust settled yet?
The unfortunate part of this story is that it isn’t imaginary. It actually happened to someone I know.
Nevertheless, it highlights some of the thoughts on lots of investors’ minds right now:
Is the end near?
Is the worst behind us?
Has the dust actually settled?
With the recent decline in new coronavirus hospitalizations in NY state and the 26% rally in the Dow from March 24 to April 8, it’s hard not to be optimistic at this point.
But before you bring out the champagne, let’s consider what the record of history can teach us about such unprecedented market rallies.
Since 1915, the Dow has had eight non-overlapping periods when it rose by 20% (or more) within the course of 12 trading sessions:
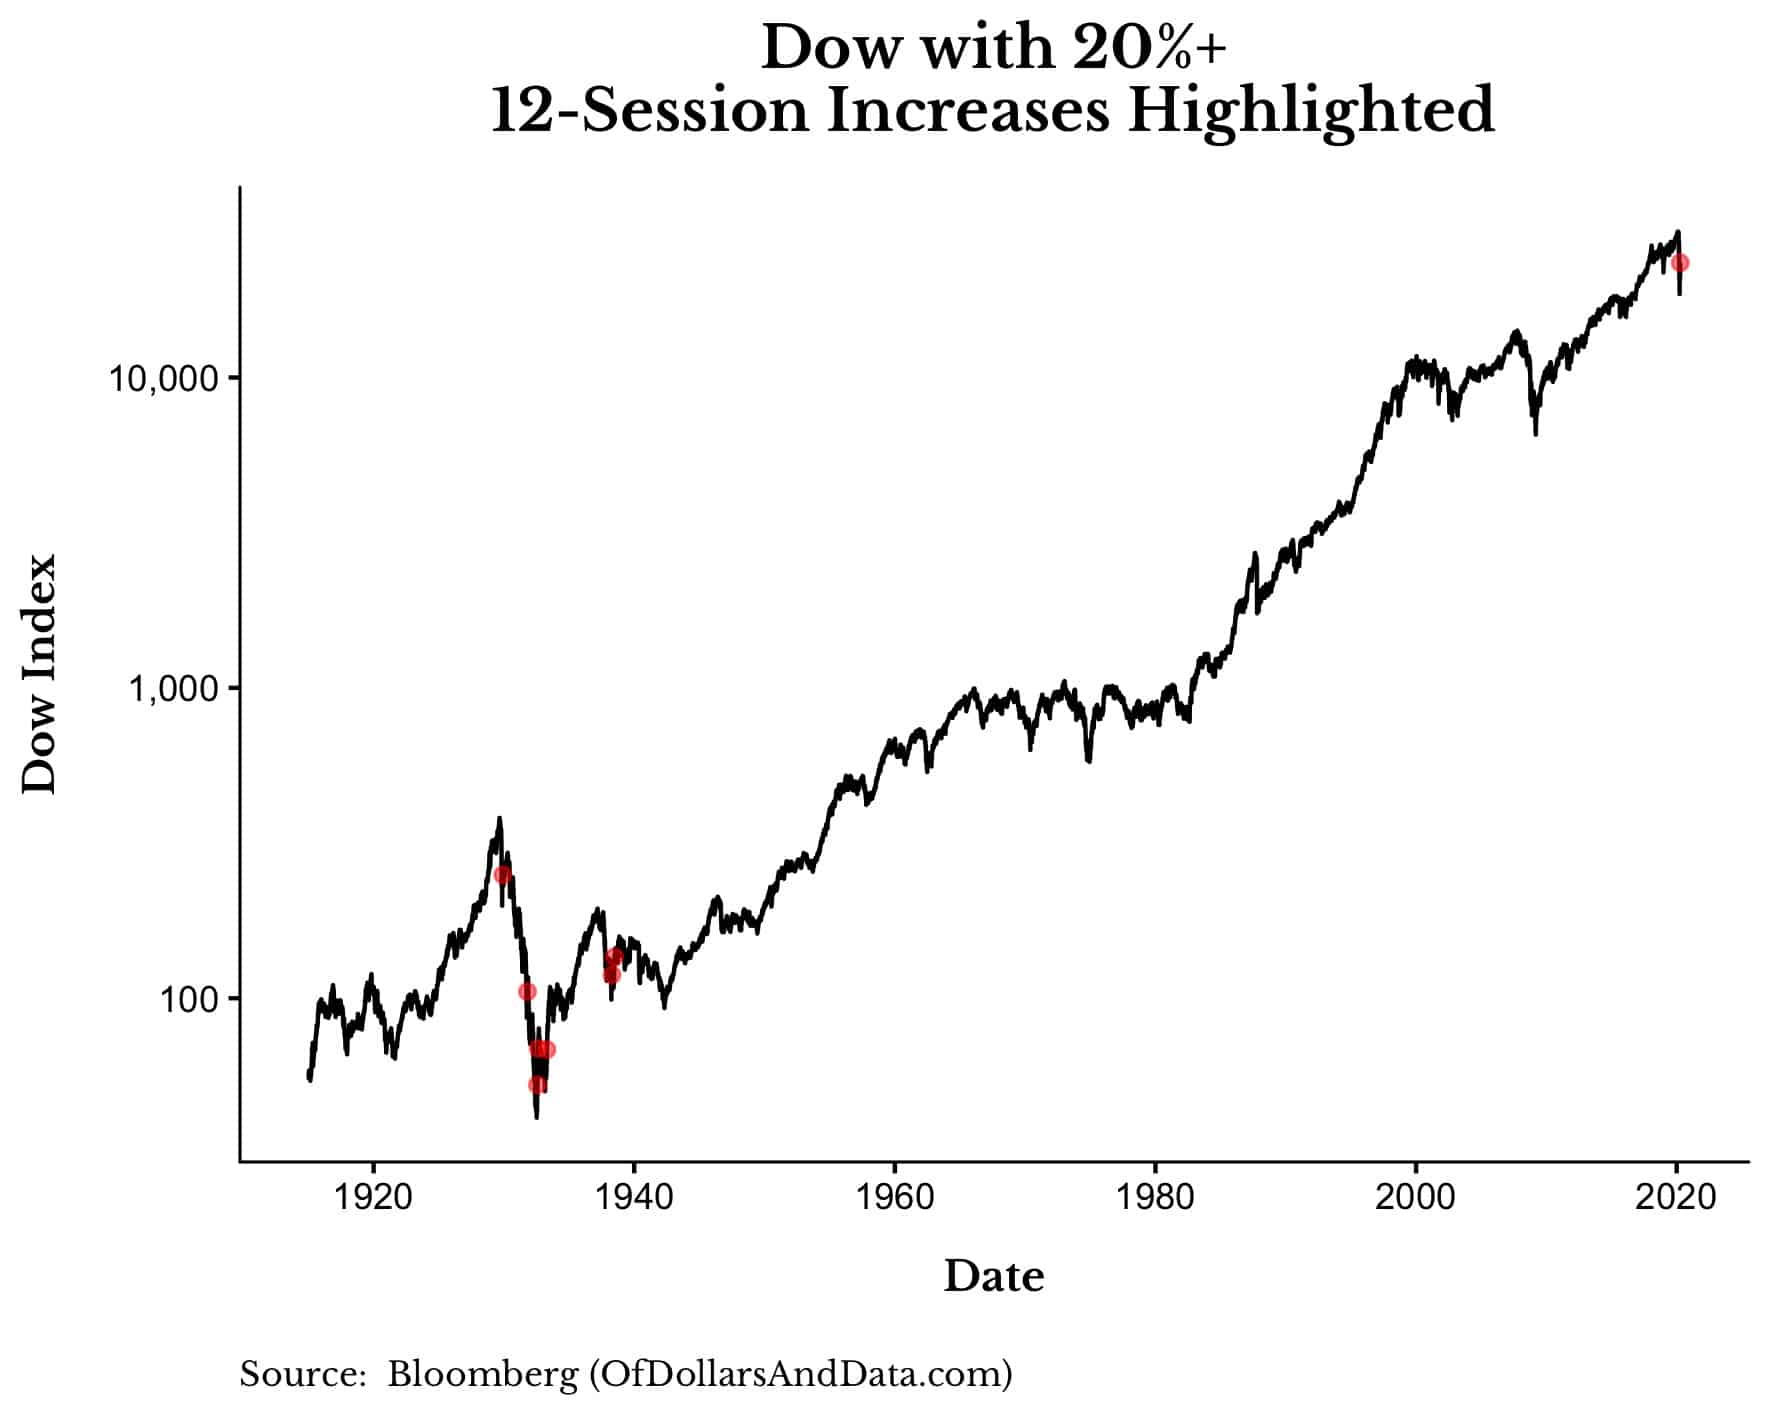
Besides our most recent rally, the other seven rallies occurred in the 1930s [technically one occurred in late 1929, sue me].
This means that a rally of this speed and magnitude is unheard of among today’s investors. Naturally, you might be wondering what comes next after such a sudden rise in markets.
Well, in the one year (i.e. 250 sessions) following a 20%+ rally, the market was up by 15% on average:
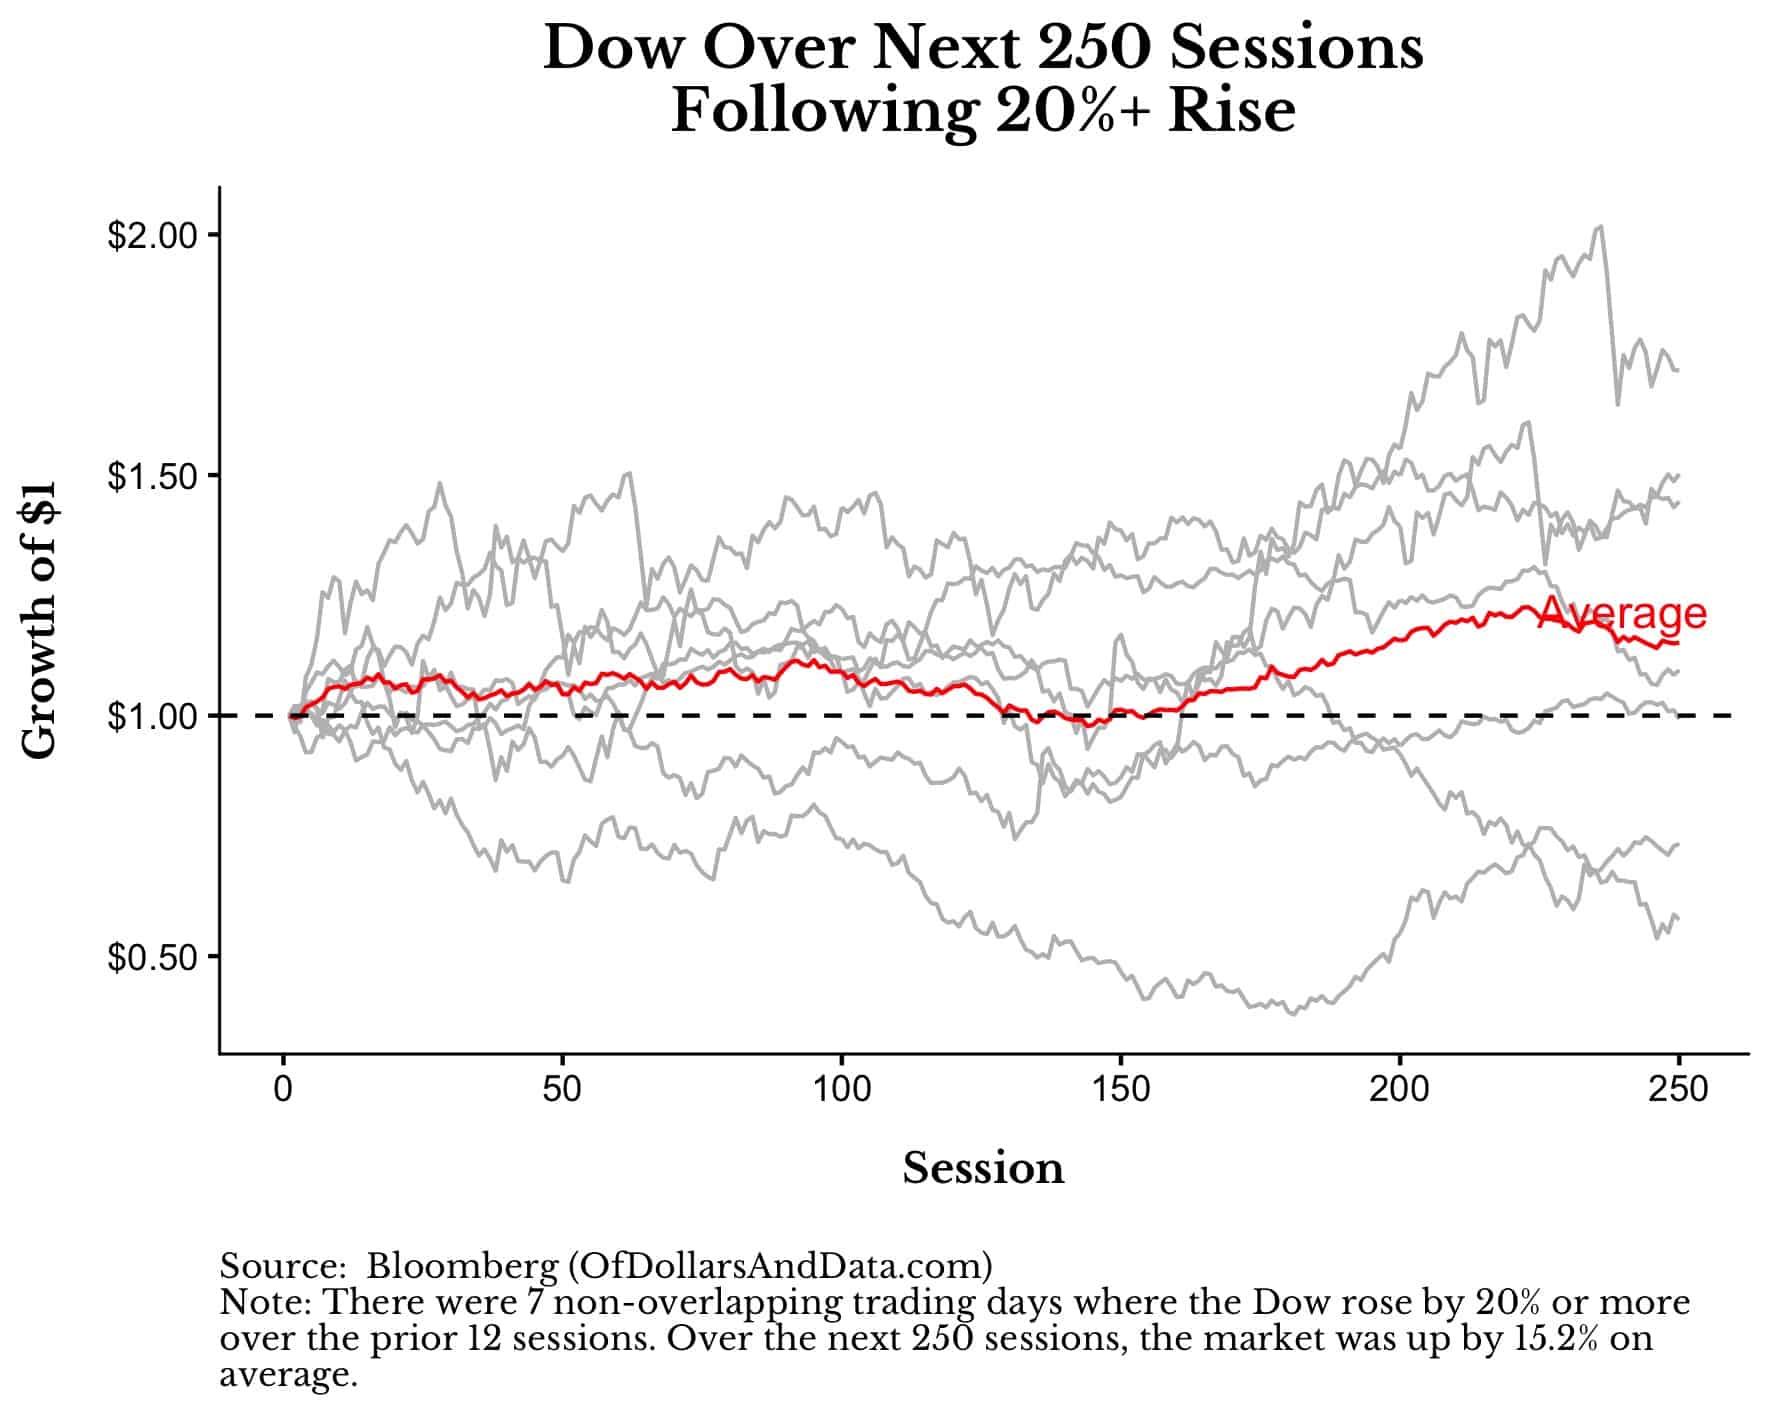
Despite how bullish this may sound, the sample size of this analysis is only seven, with all seven of these post-rally periods occurring in the 1930s!
However, even when we lower the rally threshold from a 20%+ gain to a 15%+ gain over 12 sessions, our sample size only increases to 20:

And, once again, this data series is completely dominated by the 1930s, with only about one in five of these rallies occurring outside of this decade.
More importantly though, the average 1-year performance following 15%+ market increases is slightly worse than the average 1-year performance following 20%+ increases:
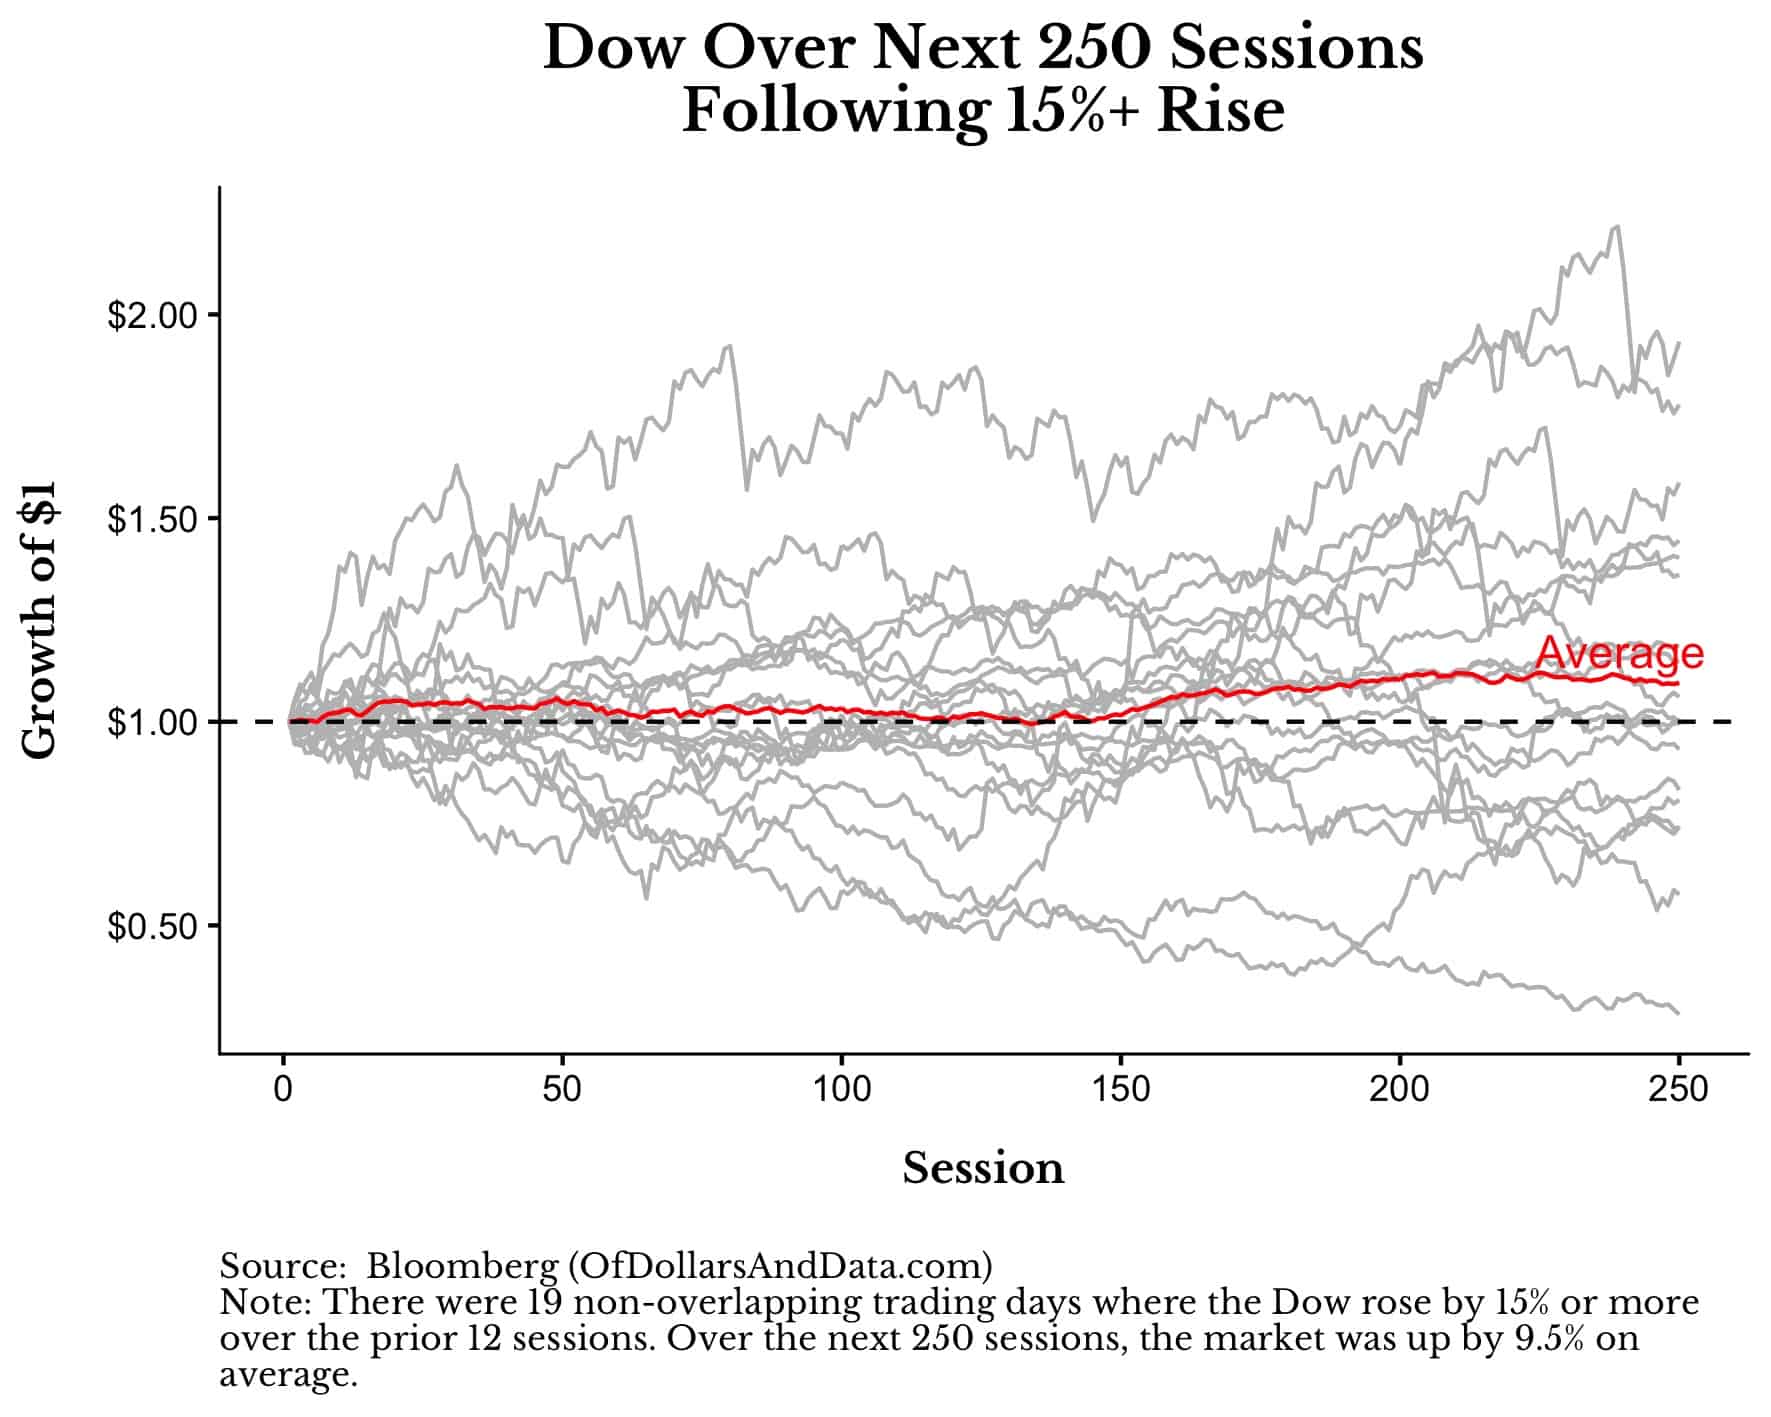
And though the average result is positive, the chance of you being on the upper half of this chart is only slightly better than a coin flip.
But all of this performance analysis is based on a lump sum investment. What if we added money to the market over time after such a rally? Could dollar-cost averaging (DCA) help us in this situation?
Not really.
Even if you had put in $1 every trading day for one year (250 sessions) following any of these rallies, there is a 45% chance that your investment would be underwater by the end of the period:
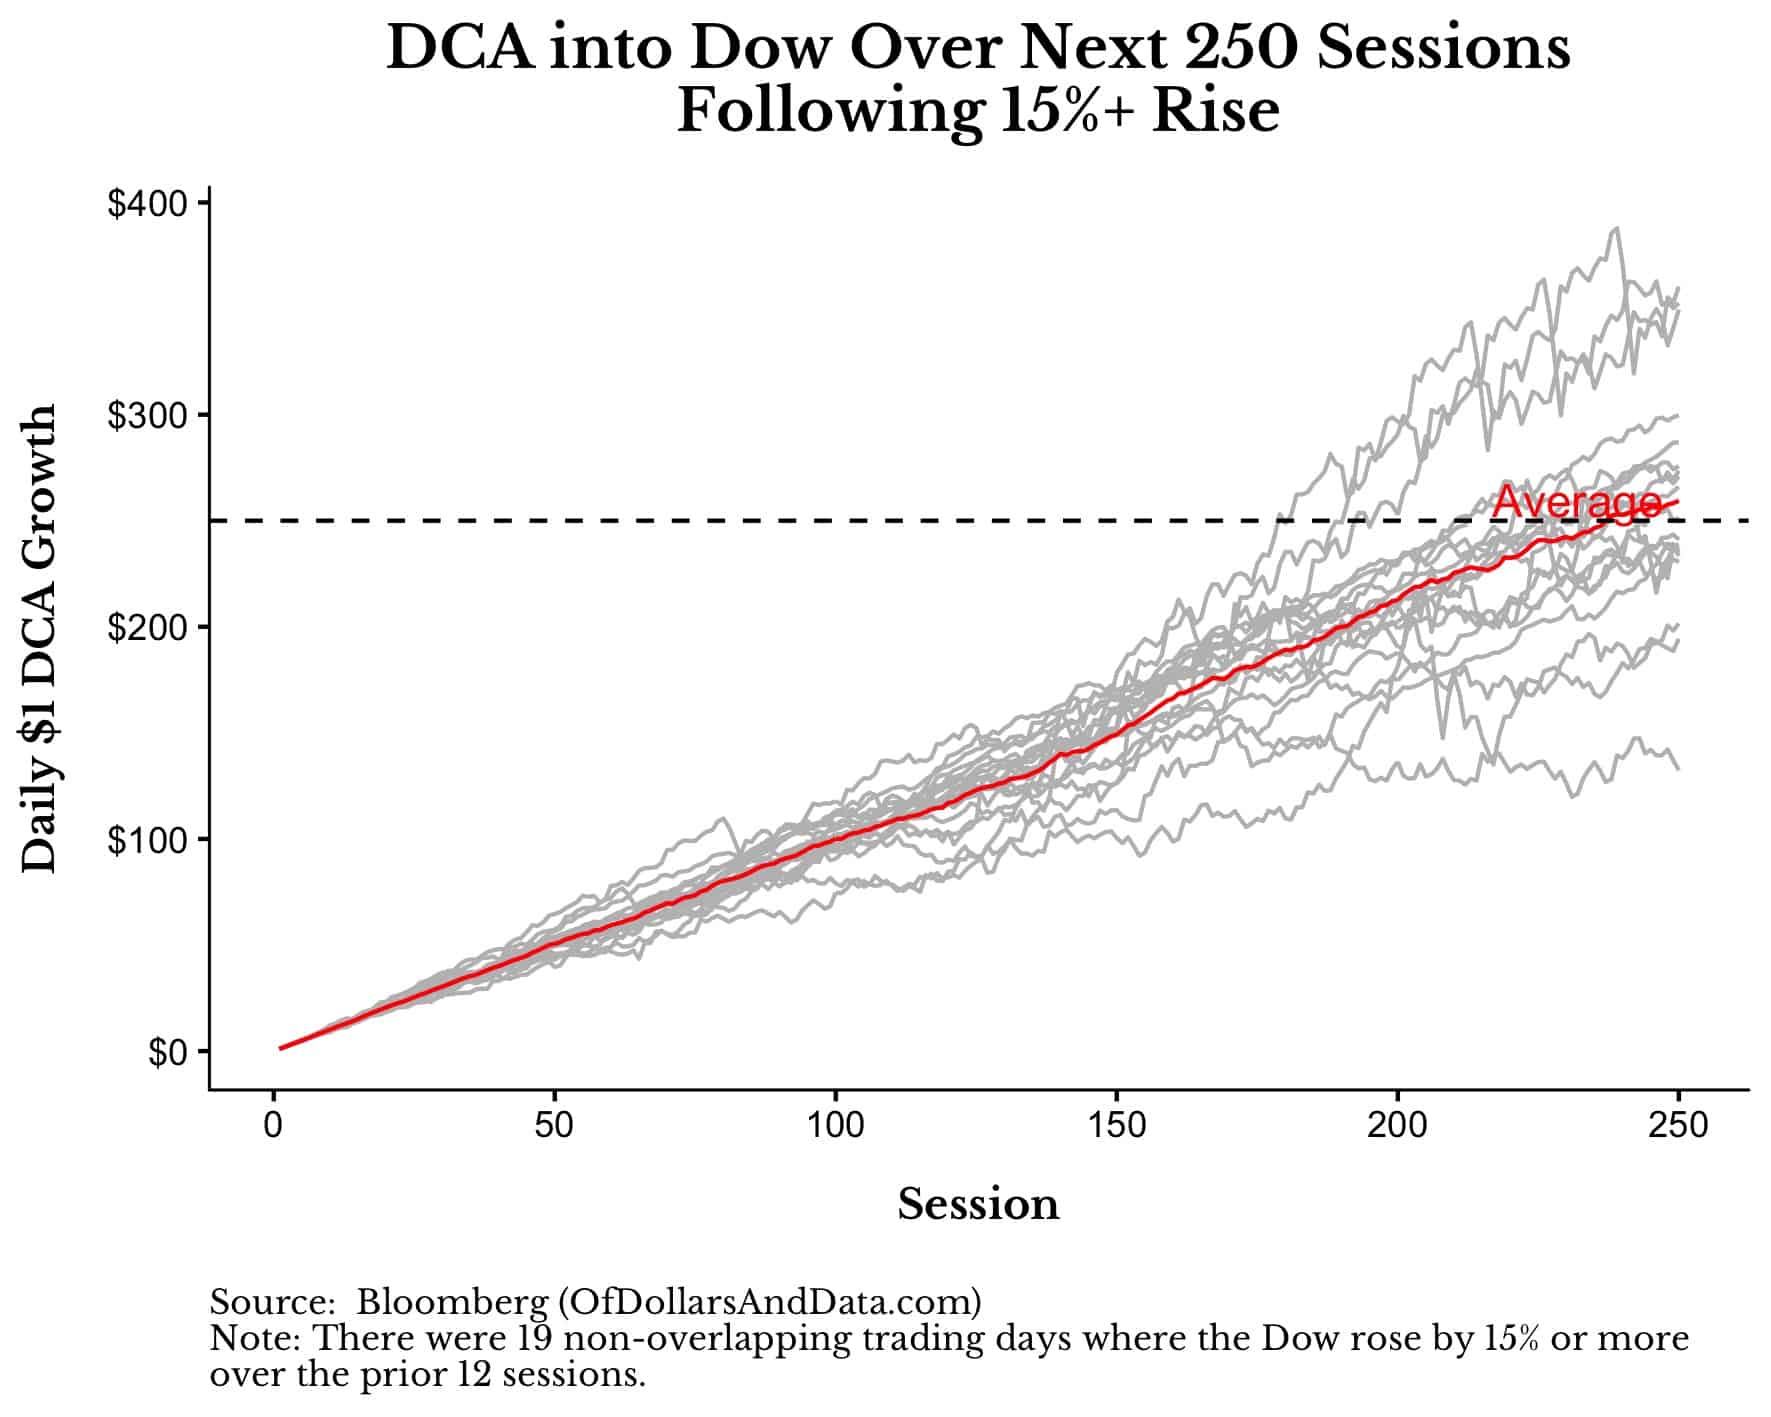
I don’t show you this chart in order to scare you, but to remind you that big rallies don’t mean that the coast is clear. At least not yet.
As William Bernstein said in a recent discussion with Ben Carlson:
One thing that we learned from market crisis whether it’s the early 1930s or the more recent global financial crisis is that big up days, 6%, 8%, or 10% up days (like in 2008 or 2009) that’s volatility. And volatility is volatility, and it’s bad.
And I completely agree. Large, sudden market gains can seem good now, but they only happen in markets brimming with uncertainty, markets that can turn south (again) on a dime.
It is this seesaw between fear and greed that makes me hesitant to be bullish right now.
Because while the Dow is 26% above its March 23, 2020 low, it is still 20% below its February 19, 2020 high. We aren’t back in Kansas yet, folks.
And when will we be?
I don’t know.
I understand how unsatisfying this answer is, but “I don’t know” is the most truthful response I can provide.
When I see something as bullish, I say so. When I see something as bearish, I say so.
Unfortunately, the data in this instance isn’t as clear cut, so “I don’t know” it is. Final answer.
But, one day the dust will settle for the market. And when it does, what might it look like?
I think it will look like nothing. Small, forgettable price movements. Behavior unlike last month. This would be the signal to look out for. This would be a return to normalcy.
Until then, our only hope is to analyze history for some semblance of tomorrow. As Marshall McLuhan once said:
We look at the present through a rear-view mirror. We march backwards into the future.
McLuhan’s car analogy is an apt one for the market as well.
Because, just like a car speeding away into the distance, remember that, by the time the dust settles, the car is long gone.
Thank you for reading!
If you liked this post, consider signing up for my newsletter.
This is post 177. Any code I have related to this post can be found here with the same numbering: https://github.com/nmaggiulli/of-dollars-and-data

