The S&P 500 recently hit its 50th all-time high of the year and it’s only August. That’s the second most for any year (through August) since 1950. Given this information, many investors are currently wondering: are we in a melt-up?
For the uninitiated, a melt-up is a “sustained and often unexpected improvement in the investment performance of an asset or asset class.” Unfortunately, it’s not just the S&P 500 that seems to be melting up. Real estate prices are through the roof (no pun intended) and used cars are now being considered an investable asset class.
All jokes aside (or not), how crazy is this market in the context of history? Are we actually in a melt-up? And if so, how early (or late) is it? Let’s find out.
What Does a Real Melt-Up Look Like?
To start, I want to examine what an actual melt-up looks like. The most recent environment that could be categorized as a “melt-up” for U.S stocks occurred during the DotCom Bubble. The bubble started around 1995, peaked in 2000, and bottomed in 2003.
From the start in 1995 to the peak in 2000, the S&P 500 went up by 233% (266% with reinvested dividends):
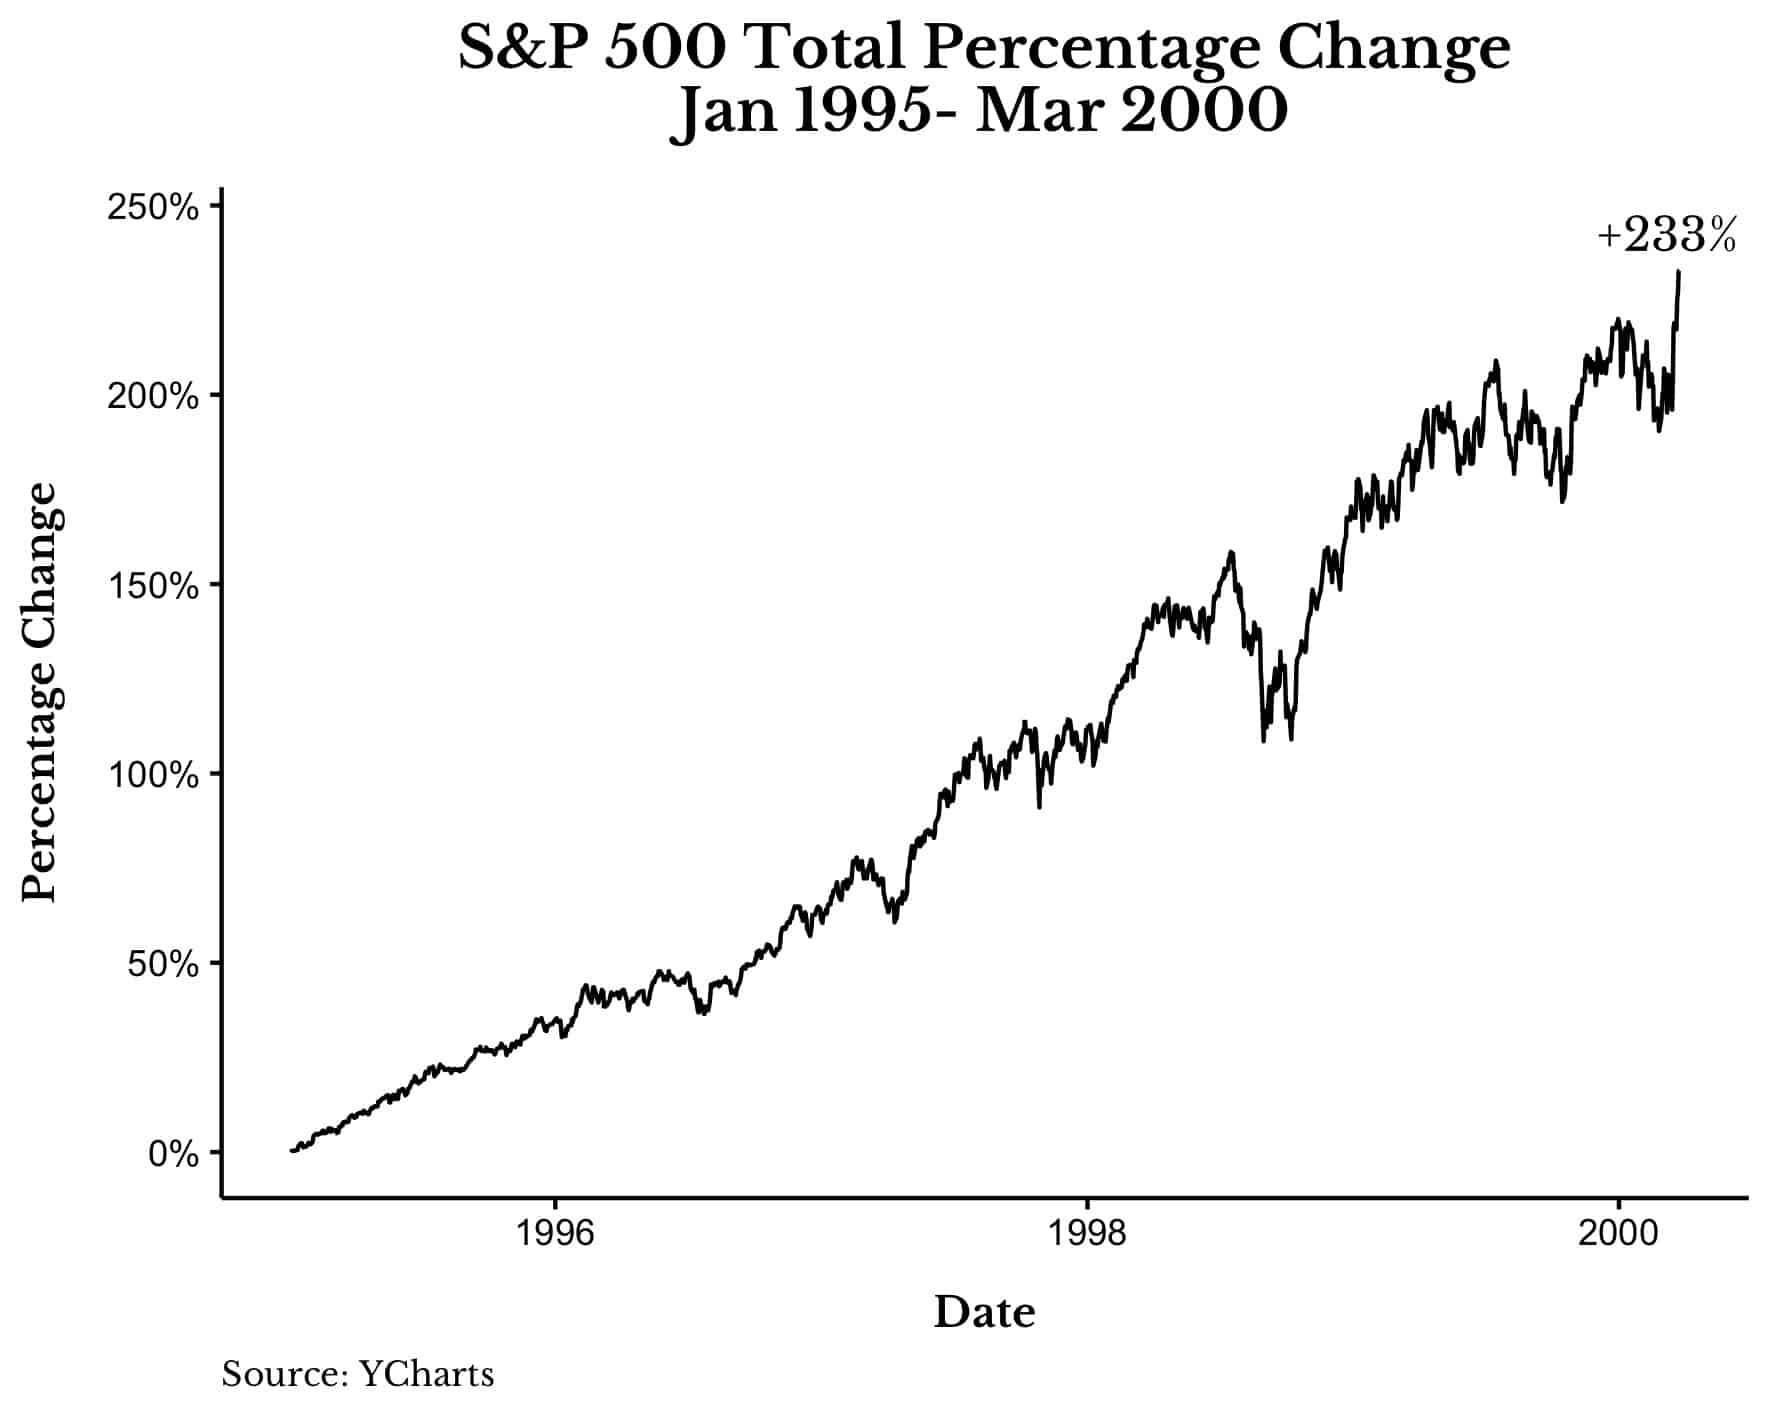
Looking at this chart you can see just how crazy the price action was. The market doubled in three years and then doubled again in the final two years of the melt-up.
More importantly, it did all this while experiencing only one 19% correction and two 10% corrections on the way up:
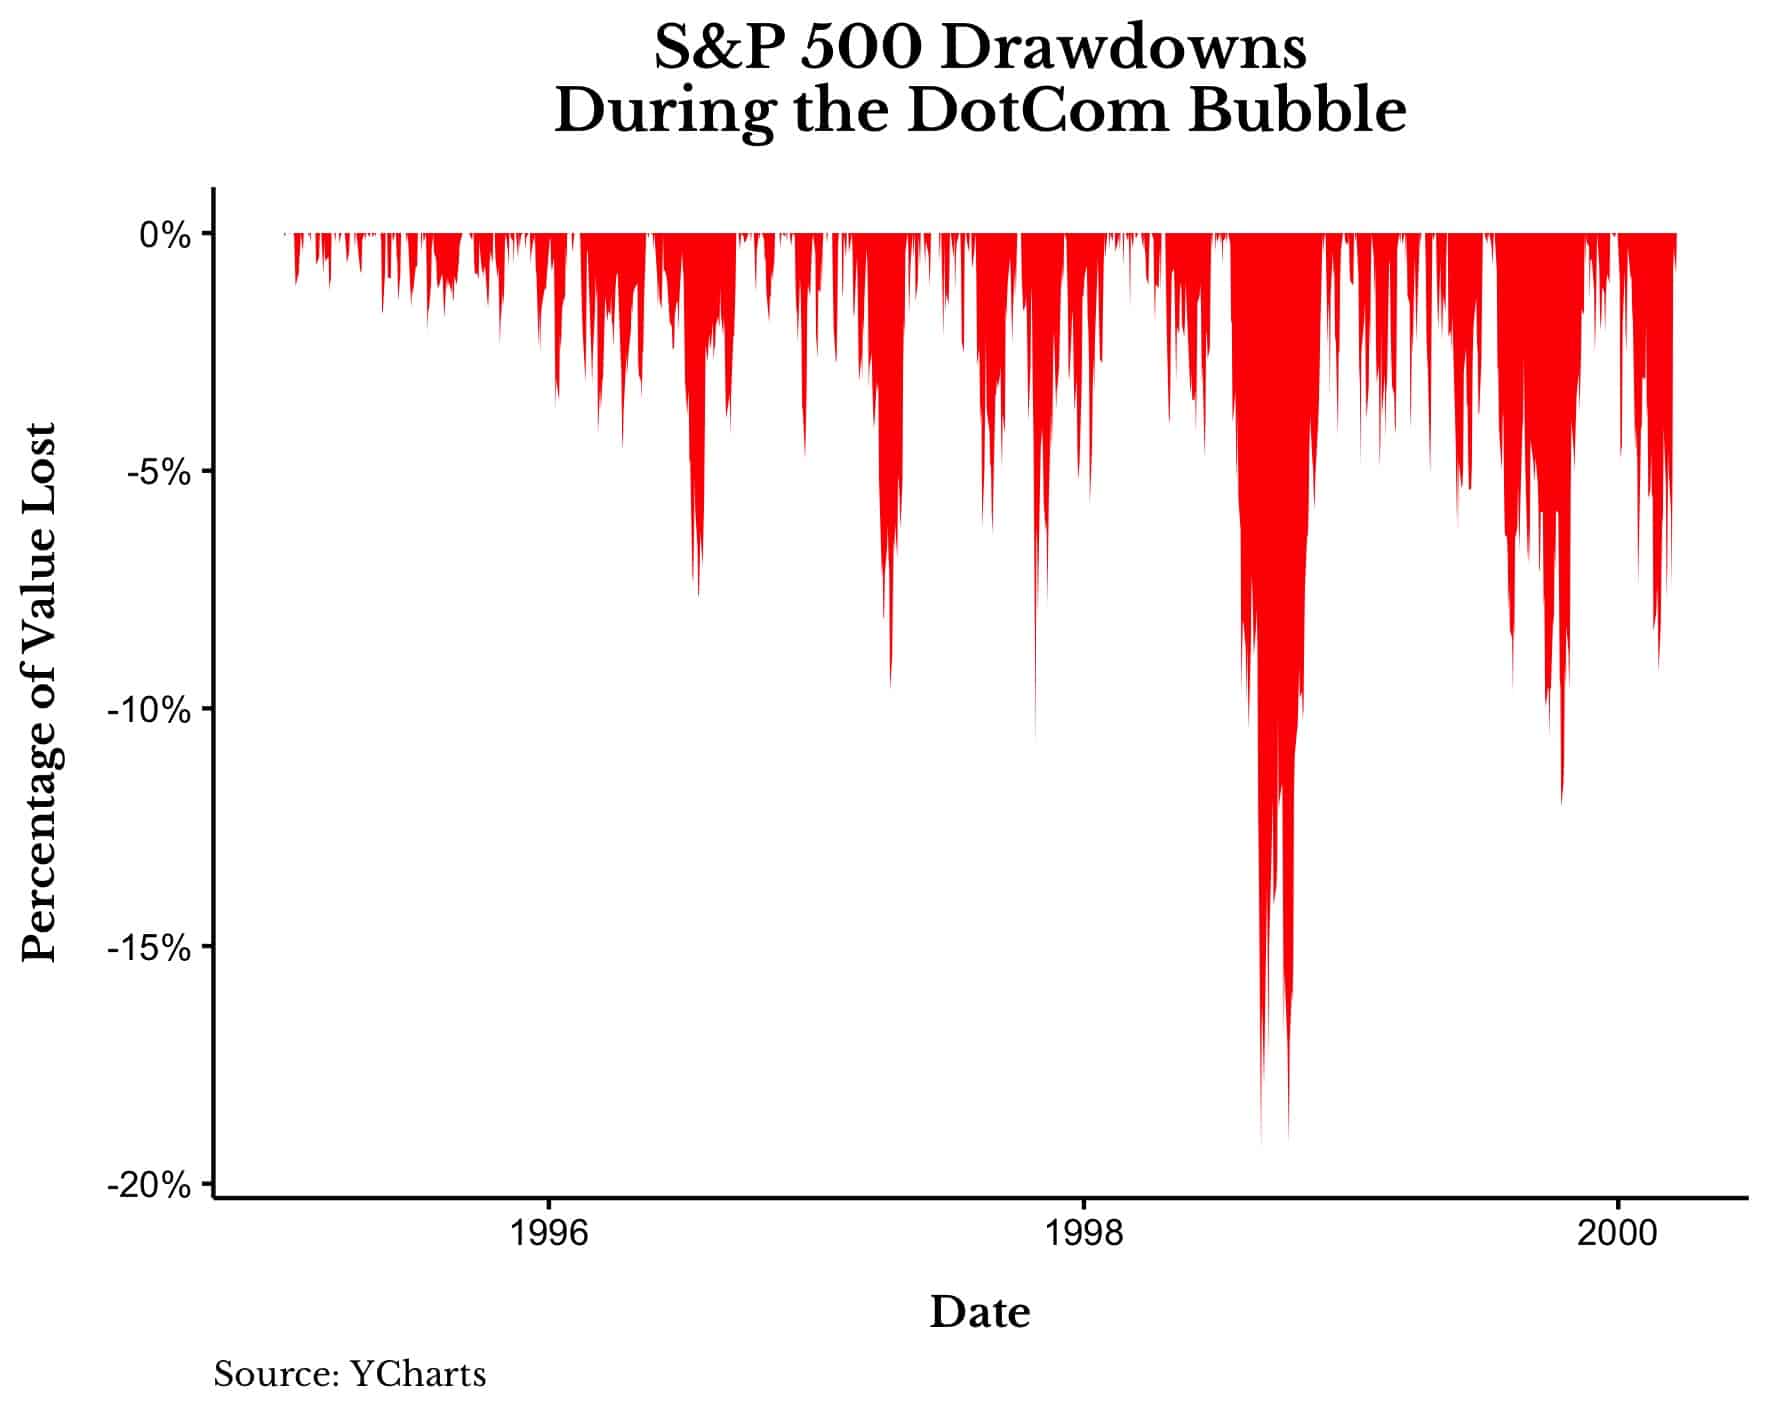
However, the celebration ended shortly after March 2000.
Over the next three years the S&P 500 would decline by nearly 50%:
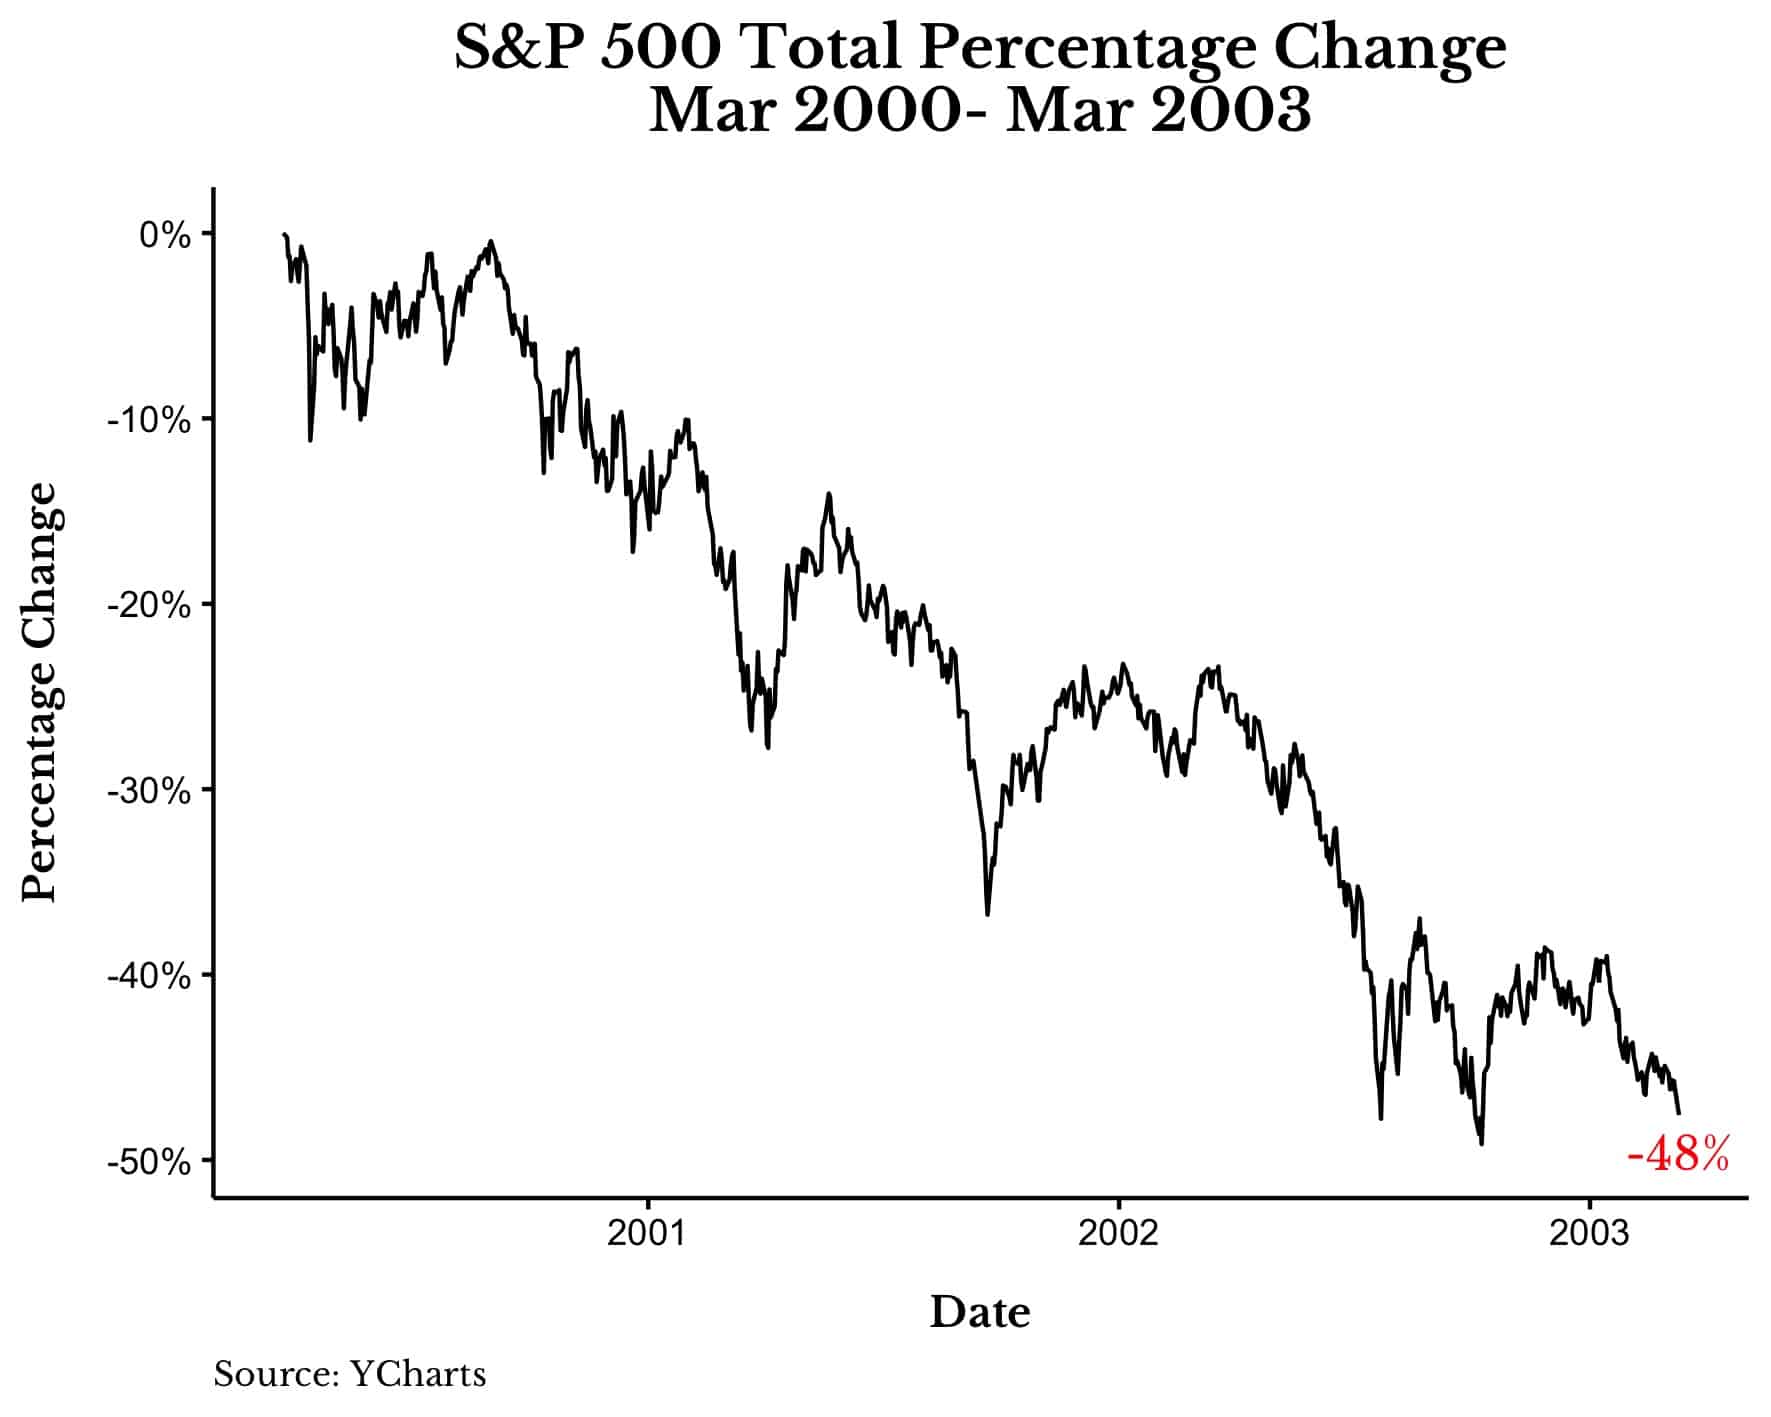
To the dismay of investors everywhere, the market rallied by over 10% multiple times on its way to the bottom.
This is what it feels like to be in a melt-up. You get a huge rally (that typically lasts years) followed by a big decline. Fortunately, the decline that occurred in U.S. stocks only lasted for three years. Other markets haven’t been so fortunate. As I have written before, Japan still hasn’t recovered from their bubble in the late 1980s. Their stock market experienced the greatest melt-up of all time as prices increased by nearly 10x over the course of a decade.
Now that we have seen what a melt-up actually looks like, how does the current market compare?
How Bad is the Current Melt-Up?
As much as I want to draw parallels between today and the DotCom Bubble, the data suggests that this melt-up isn’t as bad as it seems. For example, over the last 18 months (i.e., right before COVID) the S&P 500 is up 40% with dividends. While this might seem like a lot, this 18-month return is only in the top 14% of all 18-month returns since 1920. And if we look over the last 5 years, the S&P 500 is up 123% (with dividends), which would be in the top 13% of all periods since 1920.
Either way, the returns over the past few years are high but not record breaking. We still have a way to go before they reach DotCom levels. Ironically enough, this implies that, if we are in a melt-up, this is just the beginning. I don’t say this as a prediction but as a reminder that melt-ups can last a lot longer and get a lot crazier than you might imagine. After everything we have seen recently I know how silly it might seem to say “this is just the beginning,” but we really don’t know.
Regardless of where we are in the current melt-up (or not), there are a few things you can do to survive (and thrive) throughout one.
How to Invest During a Melt-Up
Of all the things that you should do during a melt-up, the most important is to get invested. Do not sit in cash. Why? Because even if the market does eventually return to its prior levels, sitting in cash will destroy you psychologically. Just imagine how hard it would have been to sit in cash during the DotCom bubble from 1995-2000. For five years you would have to watch everyone around you (even people dumber than you) get rich while you sat on the sidelines. It would be infuriating.
Of course, some of that wealth would disappear when the bubble eventually popped, but not all of it. For anyone who stayed invested from January 1995 to the bottom in March 2003, they still would have been up 74% when all was said and done:
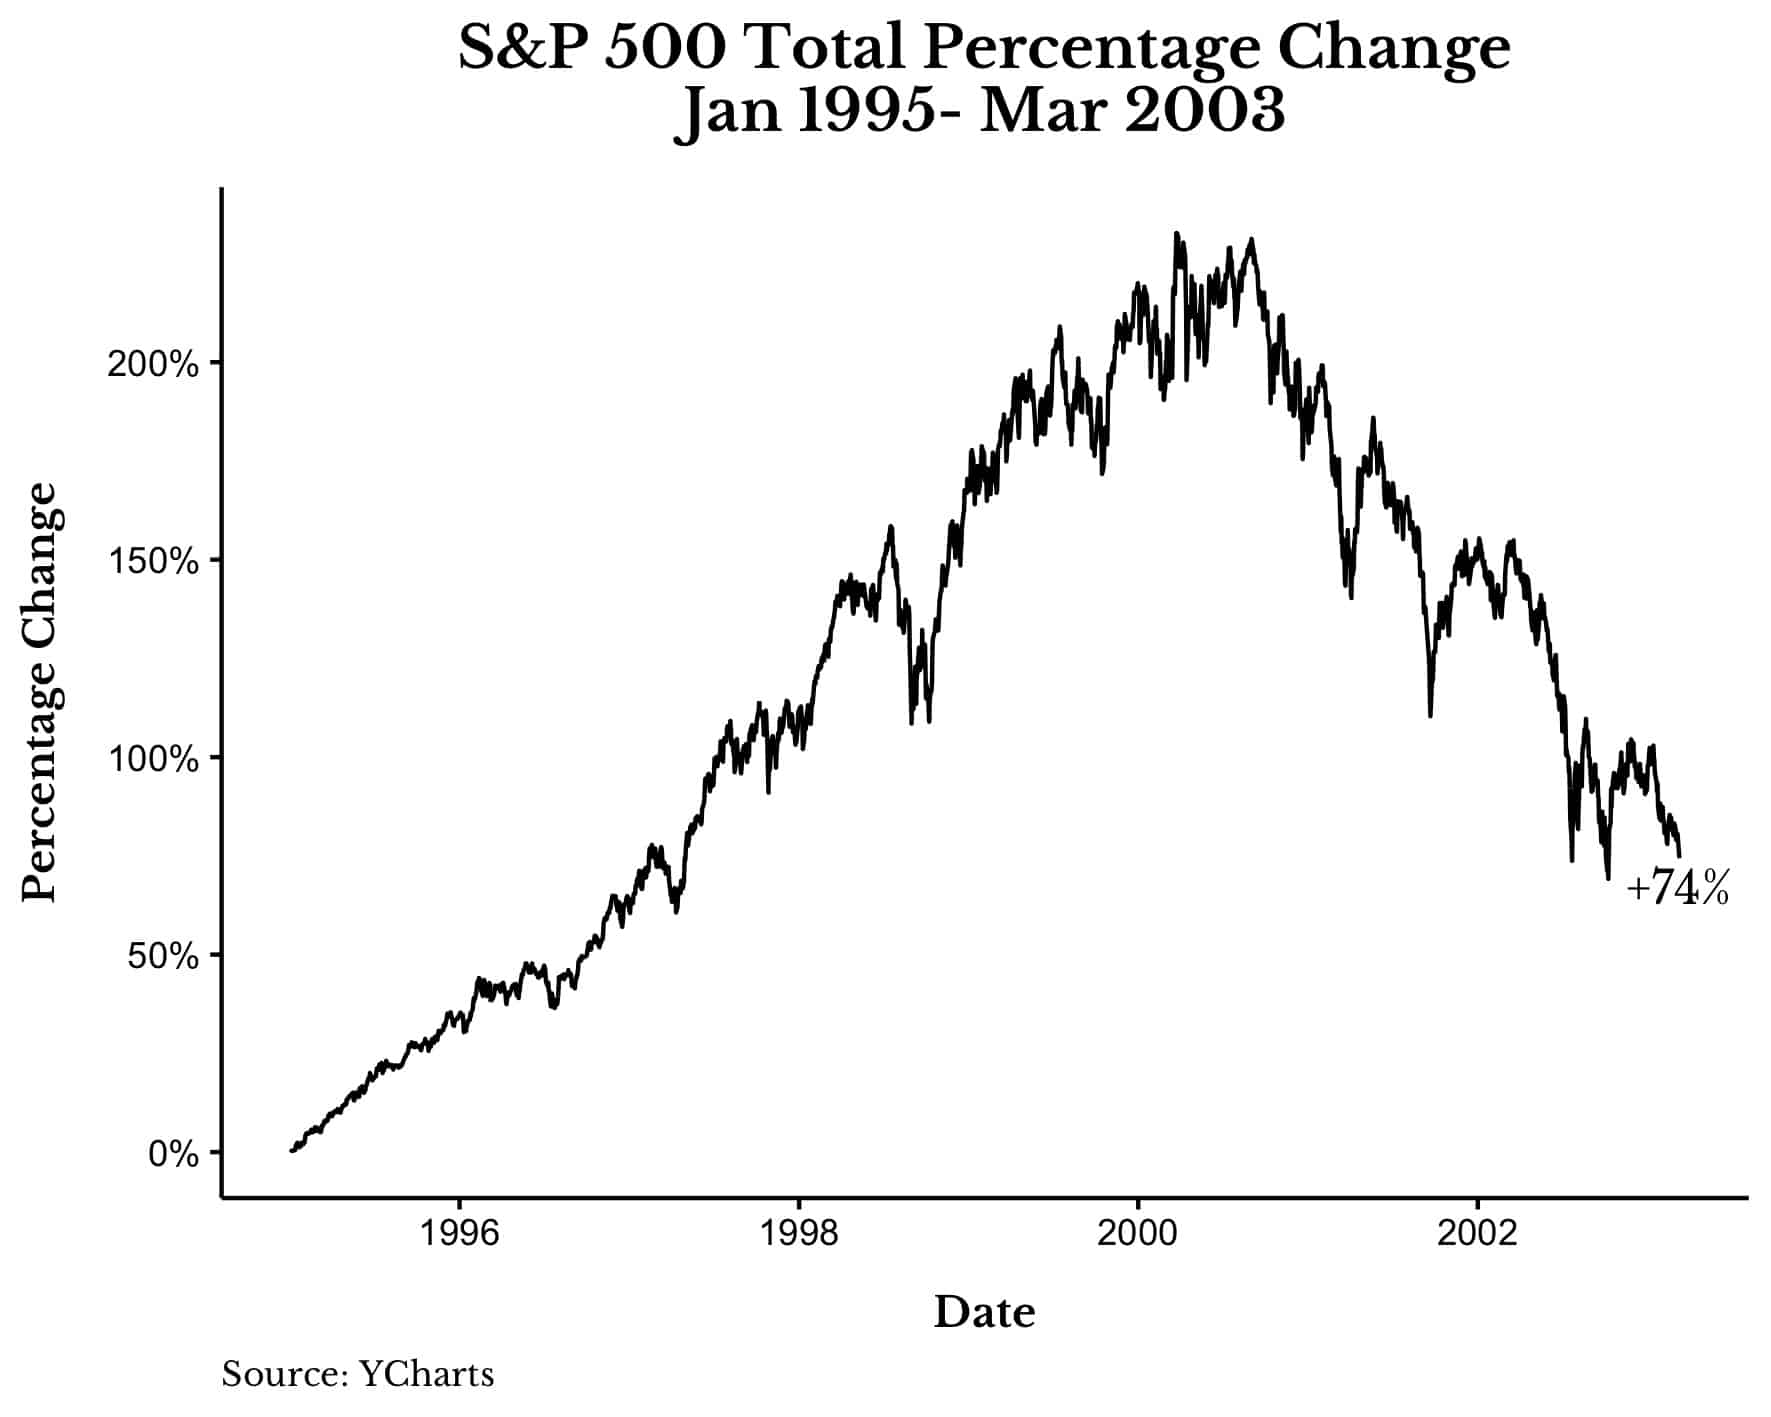
This goes to show the importance of being invested even when it seems irrational to do so.
But what if you can’t justify staying in the market? Is there another option? Yes, you can always de-risk your portfolio a bit.
As a melt-up unfolds, you will see the “melted-up” assets take up a larger and larger percentage of your portfolio over time. If this bothers you, then you should consider rebalancing more frequently or into a more conservative allocation. While doing things like this border on the realm of market timing, if this helps you sleep at night while staying partially invested, then I am all for it.
The last thing you can consider doing if you are in the accumulation phase of your investment journey is to buy more assets that are not melting-up. So instead of buying more U.S. stocks you could buy more bonds (or other assets) as U.S. stocks continue their rise.
This is why I have been buying more art and crypto over the past year. I have come to realize that the vast majority of my wealth (and my career) is linked to traditional financial markets. Therefore, to hedge this exposure, I have been buying more non-traditional assets over time. This doesn’t mean that I am no longer buying stocks (I am!) but I am buying them at a slightly slower rate than in recent years. Is this the right course of action? I don’t know, but if we are in a melt-up I’m hoping it pays off.
Lastly, while it may be tempting to move to cash (or bonds) after a decline of a certain size during a melt-up, the data suggests that this is much harder than it looks. As I illustrated above, during the DotCom bubble there were multiple 10% declines and one decline of nearly 20% on the way up. While you could have gotten out at any one of them, knowing when to get back in is the hard part.
Therefore, my best advice is to ride the wave and see where it takes you. It’s okay to make minor course corrections along the way, but giving up altogether is probably the worst thing you could do.
Thank you for reading!
If you liked this post, consider signing up for my newsletter.
This is post 256. Any code I have related to this post can be found here with the same numbering: https://github.com/nmaggiulli/of-dollars-and-data

