This week’s post isn’t about personal finance, but I think you will find it intriguing. I am going to illustrate how it is possible to detect fraud in certain kinds of data using some simple math. But, before we dive into that, let’s play a game:
What if I told you the total revenue of every company on the New York Stock Exchange (NYSE) in 2015. For example, Walmart had total revenue of $482 billion, ExxonMobil had $259 billion, Amazon had $107 billion, and so on. Now think about just the leading digit on these numbers (i.e. for Walmart it is 4, for ExxonMobil it is 2, and for Amazon it is 1). What would you expect the distribution of the leading digits to be across all companies in the NYSE? For example, is a leading digit of 8 more likely than 5? Is 2 more likely than 3? This may sound silly to you because they should be equally likely, right? No one digit should be more likely than any other.
Wrong.
In reality, over 30% of the revenue numbers will have a leading digit of 1, while ~5% will have a leading digit of 9. More of the numbers will start with 1 than 2, more will start with 2 than 3, and so on to 9. This is not intuitive and I didn’t understand why when I first learned about this concept, so let me explain. Any data series that goes across multiple orders of magnitude (10s, 100s, 1000s, etc.) and is not directly influenced by humans is likely to exhibit an unequal distribution of leading digits. This is known as Benford’s Law. From the Wikipedia page there is a great example demonstrating Benford’s law:
Examining a list of the heights of the 60 tallest structures in the world by category shows that 1 is by far the most common leading digit, irrespective of the unit of measurement.
To provide a clearer illustration of why this is true, let’s start counting:
When counting the numbers 1 through 9 all leading digits are equally represented (i.e. there is one 1, one 2, one 3, etc.), so the distribution is uniform. 1 is no more likely to appear than 2 or 5 or 9. However, if we keep counting to 19, the number of numbers that start with a 1 increases (i.e. 1, 11, 12, 13, …, 19). Now the percentage of leading digits is skewed to have many more 1s than any other digit. This happened because we counted into another order of magnitude.
If we keep counting from 19 onward, the skew of leading 1s will come down, but we will not reach an equal distribution of leading digits until we get to 99. And after hitting 99 we get to 100, and the process starts over again. This means that during any point in time, as long as we keep crossing orders of magnitude, we are more likely to have more lower leading digits (i.e. 1 or 2) than higher leading digits (i.e. 8 or 9). For random events that cross multiple orders of magnitude and do not have humans directly influencing their numerical outcome, (i.e. like revenues across all companies in the NYSE) this law holds.
Now that you have a basic understanding of Benford’s law, I am going to show you how I tested it on different accounting measures across all companies in the NYSE. My analysis shows that the accounting measures with the least human influence follow Benford’s law and those that can be the most manipulated deviated from the law (even after aggregating across all companies). To do this I used Kaggle’s NYSE data and tested Benford’s law on all of the positive numbers across various accounting measures.
To get started, if we look at the total amount of “Cash and cash equivalents” that companies in the NYSE report annually we see that the following distribution of leading digits:
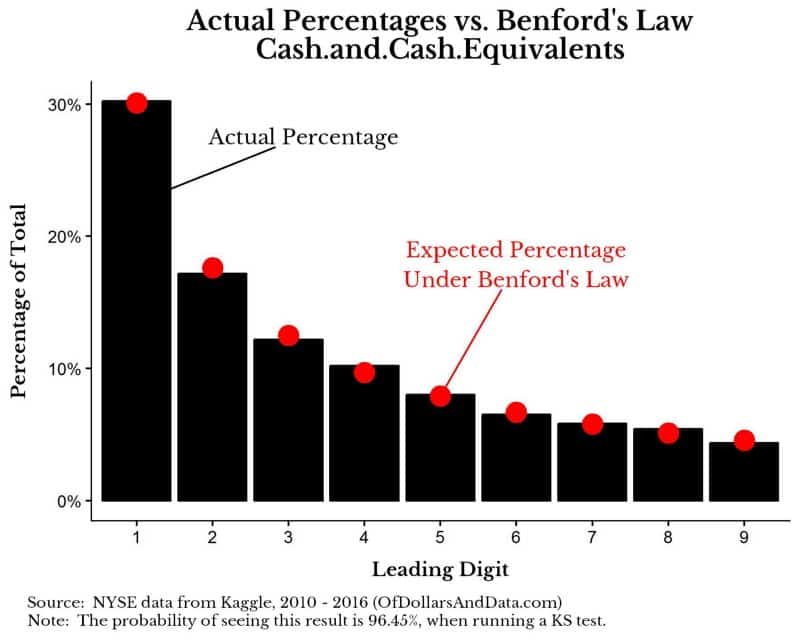
The red dots represent what we expect and the black bars are what we observe. In this instance, the distributions are nearly identical. Using a KS test, a statistical test for differences in distributions, I find that the difference in the distributions is not statistically significant (i.e. it very likely follows Benford’s law). This makes logical sense as cash holdings would be difficult for companies to manipulate easily. When testing other accounting measures across all companies in the NYSE, those that generally abide by Benford’s law include:
- Accounts Payable (money you owe to others)
- Depreciation (reduction in asset value over time due to wear and tear)
- Total Assets
- Total Revenue
These line items do not surprise me as they seem to be harder to manipulate.
Now let’s compare this to the Income Tax that companies in the NYSE pay:
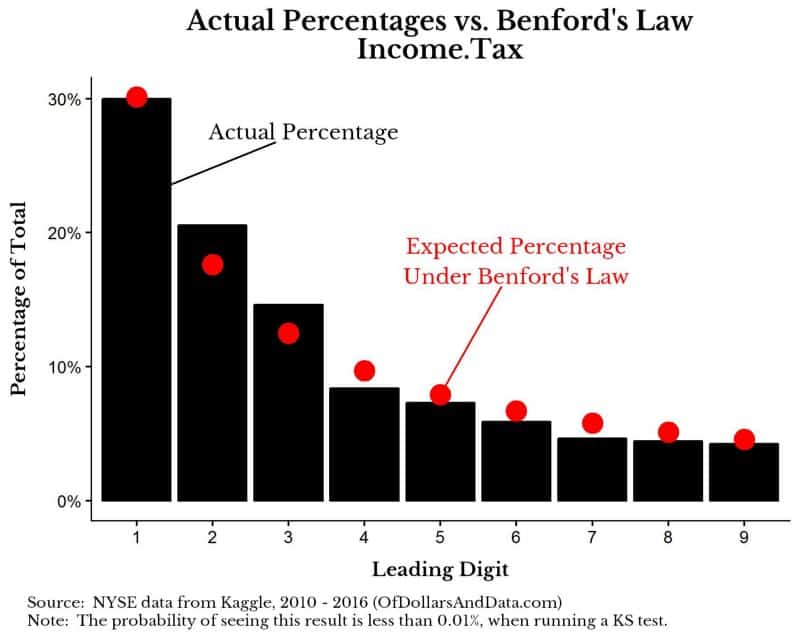
As you can see, the distribution of red dots does not seem to match the black bars as well. Using a KS test I find that the probability of seeing this result is less than 0.01%, which implies it is highly unlikely that this distribution follows Benford’s law. This result makes logical sense to me as income taxes can be directly manipulated, which might explain the skew toward lower numbers (i.e. even more leading 2 and 3 values than we would expect).
Other measures that do not seem to follow Benford’s law include:
- Net Income (a measure of profit)
- Accounts Receivable (money owed to you)
- Earnings Before Interest and Tax
- Capital Expenditures
- Goodwill
This does not imply that all of the measures listed above are being manipulated in a fraudulent way. It just implies that these measures are likely being influenced more directly by human decisions. For example, it is difficult to alter your cash holdings or revenues with accounting tricks, however, when it comes to income tax or net income, accounting methods play a larger role. Additionally, there is also the possibility that some of these measures would not follow Benford’s law for another reason that I have overlooked.
So What?
It is unlikely that you will ever need to use Benford’s law in your life, however, I do think the law illustrates a larger point that I have tried to make on this blog:
You can explain complex financial issues with simple math.
Whether it’s how hedge funds get rich, the mathematics of income and spending by the poor, or when to focus on saving versus investing, many of my posts try to reveal the mechanisms behind complicated investing and personal finance topics using the same set of mathematics we learned in grade school (i.e. division, multiplication, and percentages). You do not need the dollar solution when the ten cent one will do.
In the case of this post, you can use counting of leading digits to see if someone is manipulating a number series. While Benford’s law is typically used during an audit of an individual company’s finances, you can also use it to search for manipulation of other numeric data. This site tested Benford’s law on many different data series including common iPhone passcodes, deaths from terrorism, and Twitter follower counts among others. I recommend you give the site a visit so you can see how obvious human influence is on some of the distributions.
Thank you for reading!
If you liked this post, consider signing up for my newsletter.
This is post 18. Any code I have related to this post can be found here with the same numbering: https://github.com/nmaggiulli/of-dollars-and-data

