It was late May 2019 when I decided to rollover my 401(k) from my old employer into my IRAs.
The process seemed simple enough:
Sell assets at bank 1.
Send the cash to bank 2.
Buy new assets at bank 2.
Voilà.
What I didn’t anticipate was how much anxiety I would get with over half of my money out of the market. If stocks started to rise, I would be sitting on the sidelines earning nothing.
I was told that the time between the liquidation of my 401(k) and when my cash would be available for trade at my new bank was about one and a half to two weeks. I just had to wait it out.
I thought to myself, “Two weeks should be fine.” Then this happened:
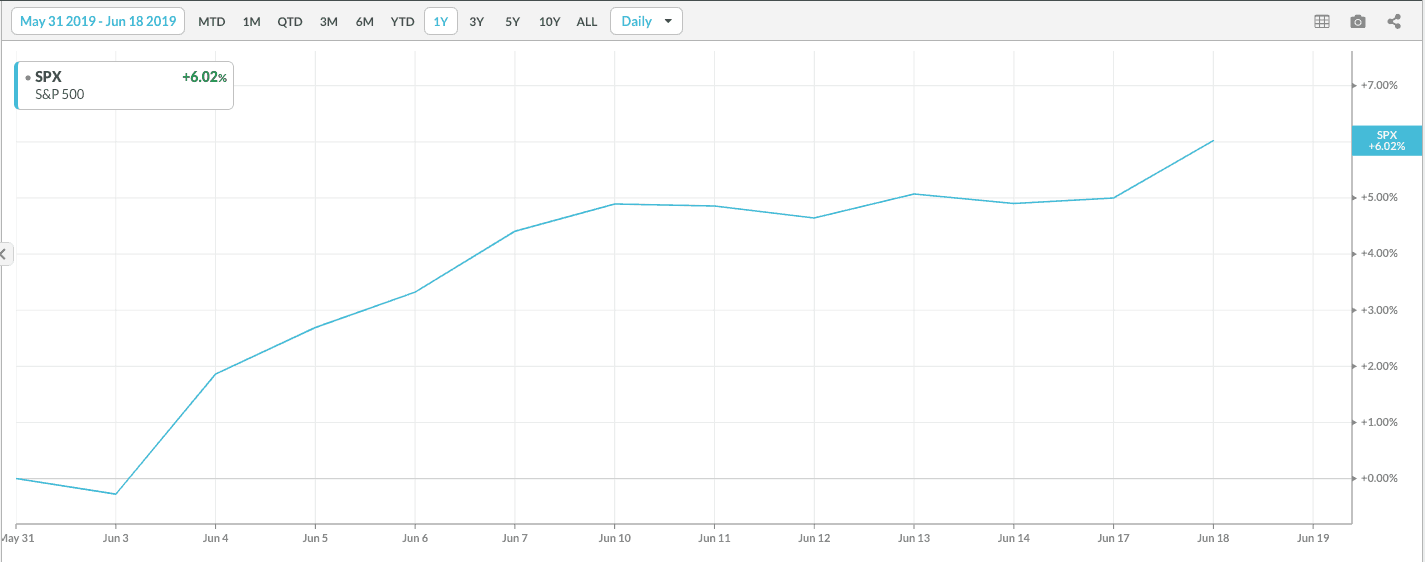
Between when my assets were sold on May 31, 2019 and when I could finally re-allocate them on June 19, the market rose 6%! In those 12 sessions the market surged while I had over 50% of my money in cash.
[Note: The rollover process took over 2 weeks because my old bank was delayed in selling my fractional share holdings. Moral of the story: These things can take longer than expected.]
I knew that this was bad timing luck, but just how bad was it? How often does the market go up 6% within 12 sessions? Honestly, I should’ve just left it alone. Who cares how often it happens, right? I can’t change it now, so why bother?
Because I HAD to know. I was compelled to know. It’s in my nature. So, I took the S&P 500 daily data since 1950 and plotted the distribution of all 12-session returns:
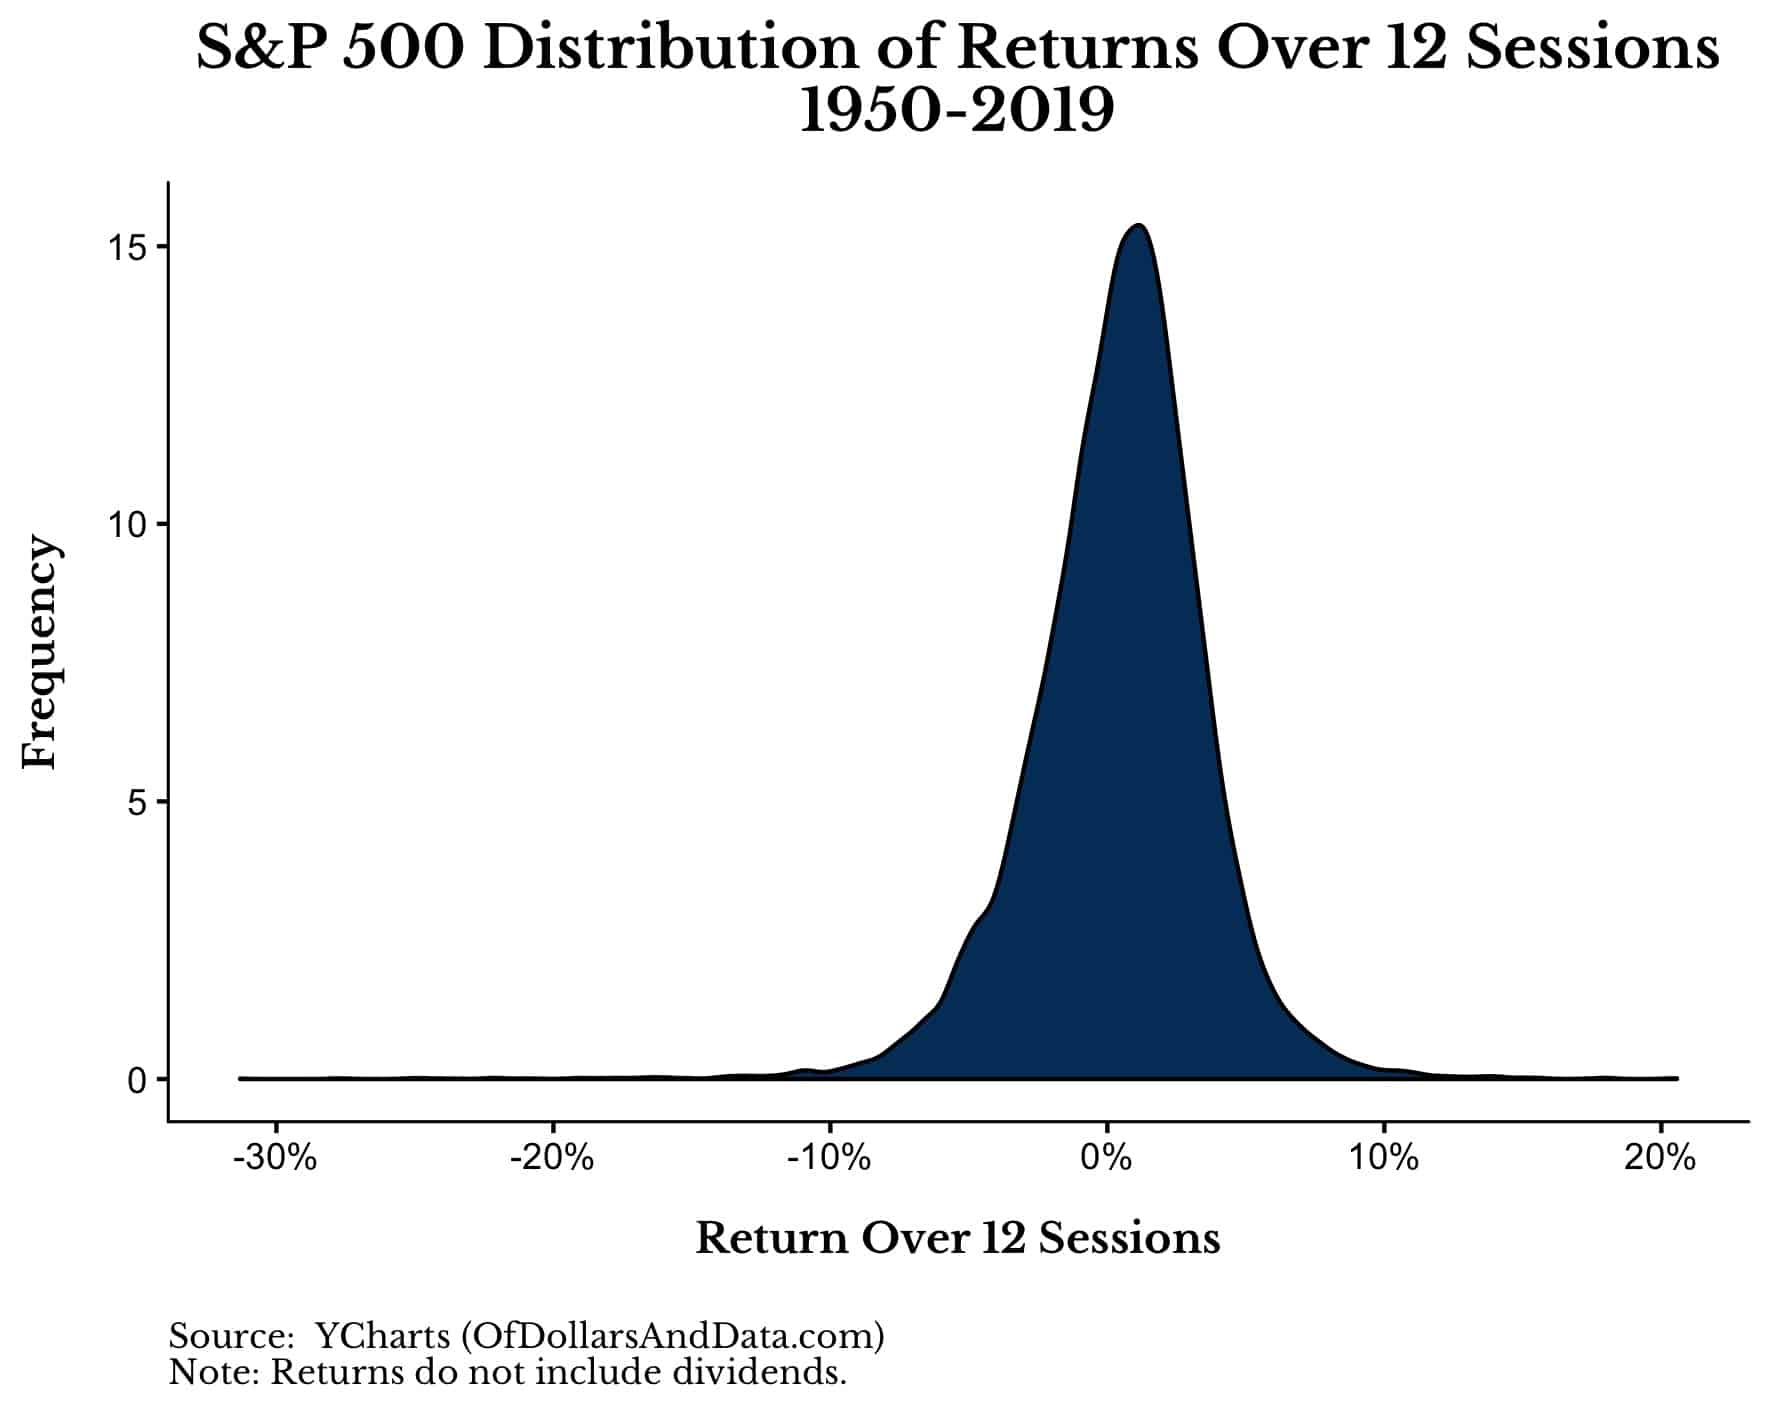
As you can see, the mass of returns is centered near zero with the average 12-session return being 40 basis points (0.4%). However, as you can also see, there are also some fat tails (i.e. -30%, +20%). So just how rare was a 6% return (or greater) in 12 sessions? It happens about 3% of the time:
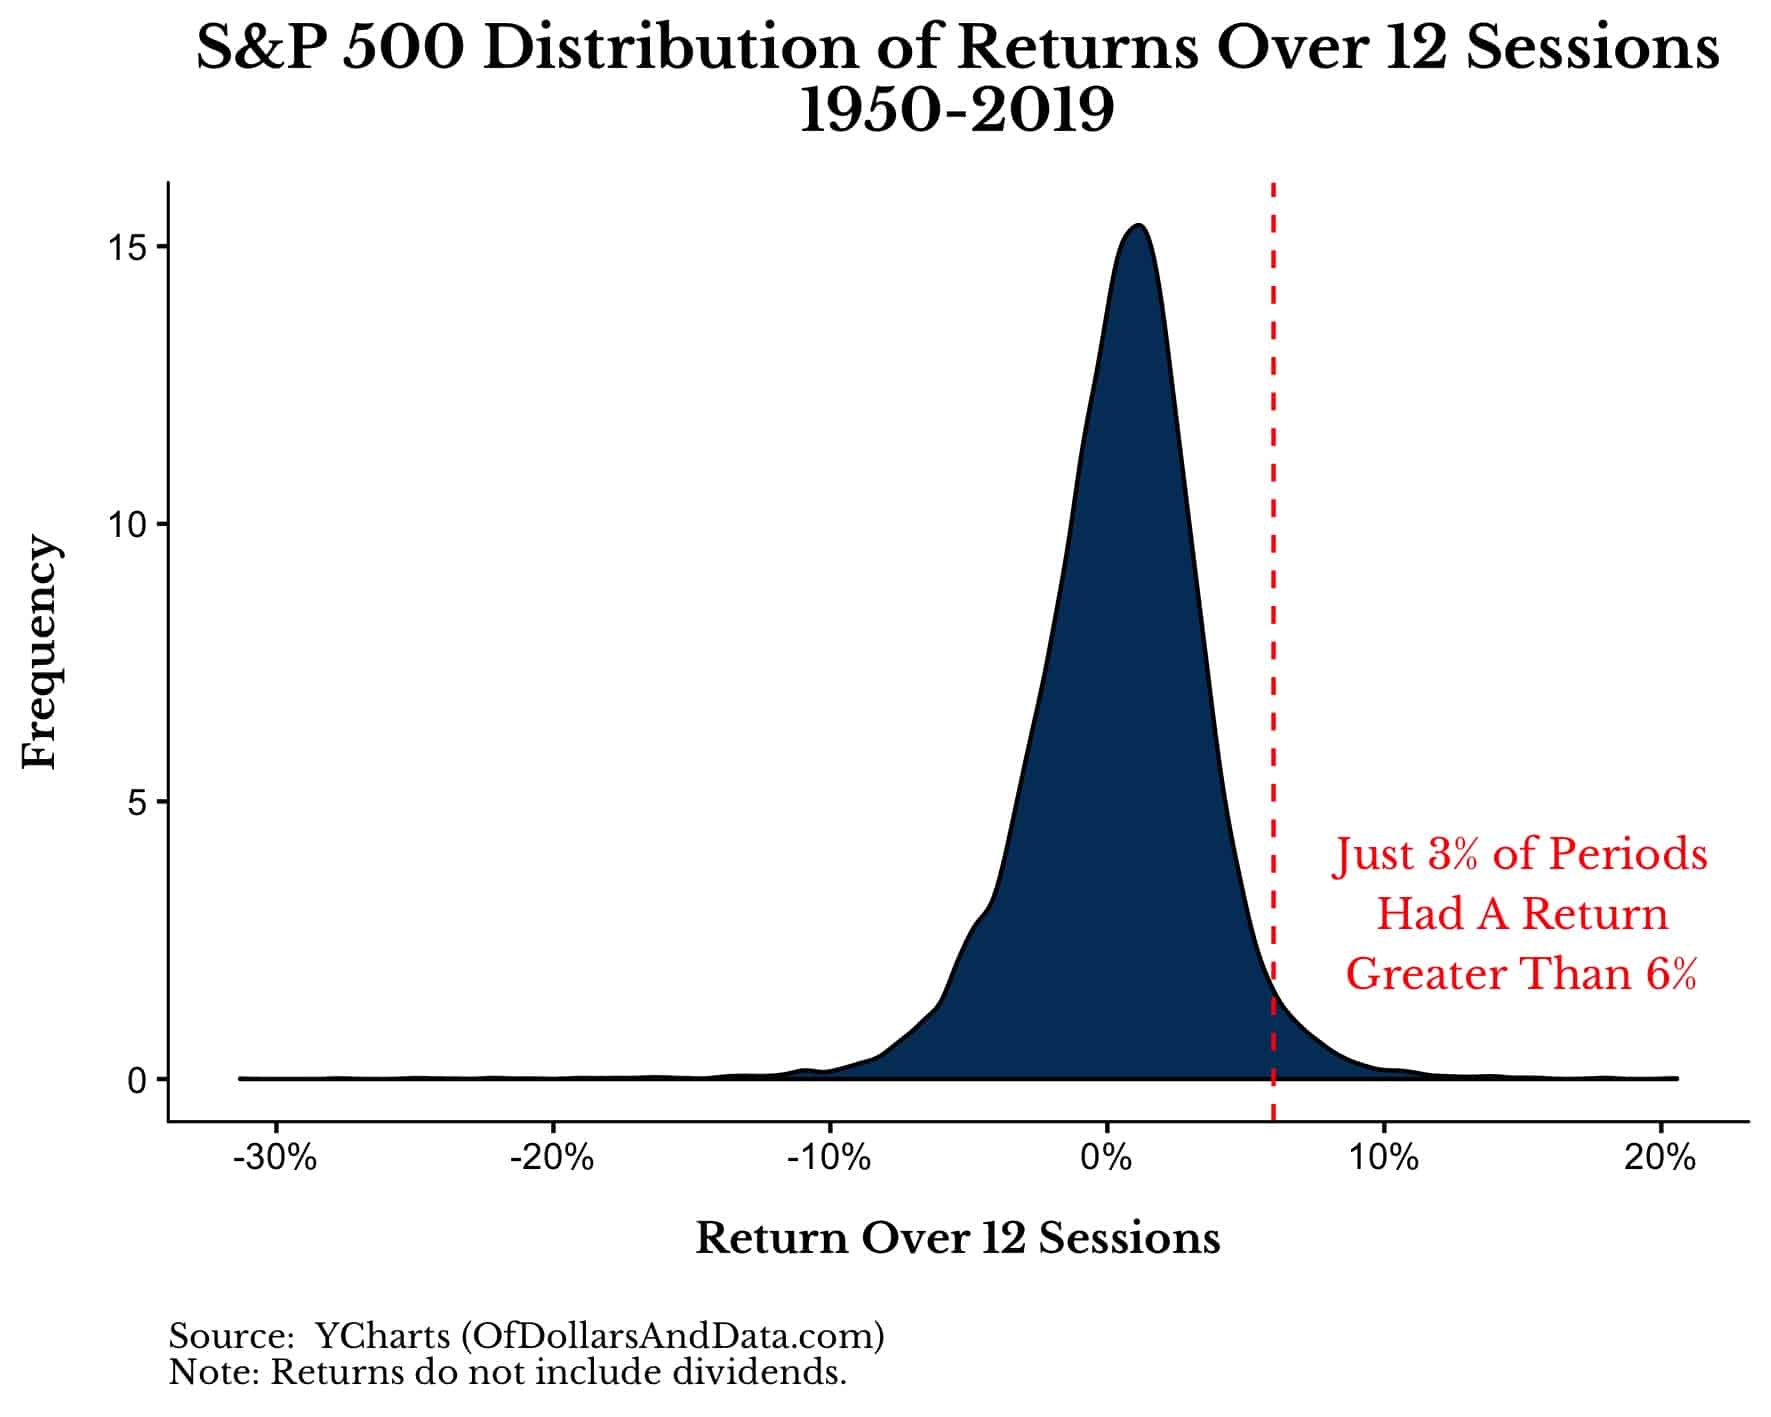
Just my luck. 97 times out of 100 I would have been better off had I sold at some other time.
I know missing out on 6% may not seem like much in percentage terms. After all, as Jason Zweig pointed out, investors in the 1970s used to regularly pay 8.5% in load fees just to start investing in many mutual funds. However, if you think about the foregone 6% in dollar terms, it can be unnerving.
Let’s pretend my 401(k) had $100,000 and I assumed it would grow at a real rate of 3% for the next few decades. When I reach retirement that sum would be worth something like $250,000 in today’s dollars. If you think of it this way, that extra 6% I missed out on represents $15,000!
That’s a few nice vacations or money I could have donated to a good cause that disappeared because of pure timing luck. Of course, my portfolio wasn’t only invested in the S&P 500 nor was it worth $100,000, but you get my point.
You can’t analyze losses from the framework of pure percentages because you miss out on the psychological weight of what those could dollar losses could represent.
Foregone consumption. Lost dreams. Dissolved memories.
This is why losing 10% of $1 million (-$100,000) feels a hell of a lot worse than 30% of $1,000 (-$300). I never really wrote about this idea because I didn’t understand it…until now.
Unlike a traditional drawdown that I can hold and (hopefully) recover from, I realized this 6% loss. This is 6% that I will never get back.
I recognize how trivial a 6% loss sounds, but, I didn’t write this for your pity. My portfolio and I will be fine. I wrote this because it made me realize a flaw in my thinking.
On Of Dollars and Data I pride myself on being objective and data-driven, sometimes arrogantly so. You can see it in a post like this one where I “prove” that it is better to invest a lump sum right away rather than averaging-in over time. You can almost imagine me laughing at the “fools” sitting in cash.
But then, you put your own money on the line and it feels different. You gain a sense of perspective that you didn’t have before. You start to appreciate what a simulation and a backtest cannot express. The safety of Monte Carlo fades and the 1s and 0s no longer provide shelter from the raw power of the market. As Fred Schwed famously stated:
Like all of life’s rich emotional experiences, the full flavor of losing money cannot be conveyed by literature.
It’s in this world, the real world, where theory can only go so far. Because if you are one of those unlucky souls who missed a 6% market rally, you don’t give a damn about the theory or the probabilities. You just care about what happened and why it happened to you.
This is one of the most important and humbling lessons I have learned recently. Some things you can teach with words and charts and some things you cannot. Cold, hard facts and figures cannot substitute for direct experience.
The astronauts aboard Apollo 8 learned this the hard way during the first few seconds of their earthshaking launch (from Rocketmen):
The crew had trained for hundreds of hours for every kind of emergency, but NASA’s simulators were not the kind of dynamic, multiaxis machines that could come close to approximating such violence.
It is this reliance on direct experience that I have found increasingly useful over time. It’s better than books, videos, or talking to others, because what works for someone else may not work for you.
So go out and experience the world for yourself. Stop listening to the voices of others and see what yours has to say. Because, as I so recently learned, there’s a difference between losing dollars and losing percentages.
Thank you for reading!
If you liked this post, consider signing up for my newsletter.
This is post 133. Any code I have related to this post can be found here with the same numbering: https://github.com/nmaggiulli/of-dollars-and-data

