A few weeks ago I wrote How Safe is an 8% Withdrawal Rate? based on some remarks made by Dave Ramsey. In response, a handful of people reached out asking: What would these retirement results look like with a diversified portfolio instead of a 100% stock one? Therefore, I ran the numbers to find out.
But, before we get to these results, I want to take a moment to explore the fundamental concept that underpins most retirement planning—the safe withdrawal rate (“SWR”). Not only will I define what the SWR is and where it began, but I will examine the historical results of using it, some risks and criticisms of the strategy, and other alternative spending strategies you can use during your golden years.
Let’s begin.
What is the Safe Withdrawal Rate (SWR) and Where Did it Begin?
When it comes to planning for retirement, the biggest financial concern is usually: will I run out of money? This is where the safe withdrawal rate can lend a hand. The safe withdrawal rate is the percentage of your retirement savings that you can withdraw each year (adjusting annually for inflation) without running out of money in retirement.
The safe withdrawal rate can be traced back to research done in the early 1990s by William Bengen. As I stated in Just Keep Buying:
Bengen found that retirees throughout history could have withdrawn 4% of a 50/50 (stock/bond) portfolio annually for at least 30 years without running out of money. This was true despite the fact that the withdrawal amount grew by 3% each year to keep up with inflation.
Therefore, if someone had a $1 million investment portfolio, they would have been able to withdraw $40,000 in their first year, $41,200 in their second year, and so forth for at least 30 years before running out of money. In fact, running out of money while using the 4% rule has been historically unlikely. When expert financial planner Michael Kitces did an analysis of the 4% rule going back to 1870, he found that it, “quintupled wealth more often than depleting principal after 30 years.”
Bengen’s idea was further validated and popularized with the release of The Trinity Study in 1998. This study, which was authored by three finance professors at Trinity University, analyzed historical return data to test the feasibility of various withdrawal rates. Similar to Bengen, the study concluded:
If history is any guide for the future, then withdrawal rates of 3% and 4% are extremely unlikely to exhaust any portfolio of stocks and bonds during any of the payout periods…
And, just like that, the safe withdrawal rate and the 4% rule were born. Since then, 4% has been the safe withdrawal rate and guiding financial wisdom that has been passed down to each cohort of new retirees. But, this begs the question: what is the safe withdrawal rate today? For this, we turn to our next section.
What is the Safe Withdrawal Rate Today?
While we can never know what the safe withdrawal rate will be in the future, we can solve for what the safe withdrawal rate has been in the past. With this in mind, I tested withdrawal rates ranging from 4% to 10% on portfolios ranging from 50% U.S. stocks/50% U.S. bonds to 100% U.S. stocks/0% U.S. bonds. Overall, the results led me to three conclusions:
- Despite having more historical data (through 2022), the safe withdrawal rate is still 4%.
- If you can get by with a lower withdrawal rate (<6%), you portfolio should own a decent amount of U.S. bonds (30%-40%).
- If you require a higher withdrawal rate (>=6%), then you should allocate more to U.S. stocks (80%+), which will decrease the chance that you run out of money in retirement.
- Note: Requiring a higher withdrawal rate is riskier in that you are more likely to run out of money in retirement. However, if you must withdraw more, then it’s actually less risky to invest in assets with higher expected returns (i.e. stocks over bonds). Why? Because this additional growth is the only chance you have of not running out of money with such a high withdrawal rate.
While these results might seem at odds with each other, they actually aren’t. Since U.S. stocks have had many periods of high growth and a few rare periods of low/negative growth, they tend to be your best option for most of your portfolio most of the time. Let’s look at some results to illustrate this.
To start, we will examine how a 60/40 portfolio performed with various withdrawal rates across every 30-year period from 1926 to 2022 (68 full periods in total):
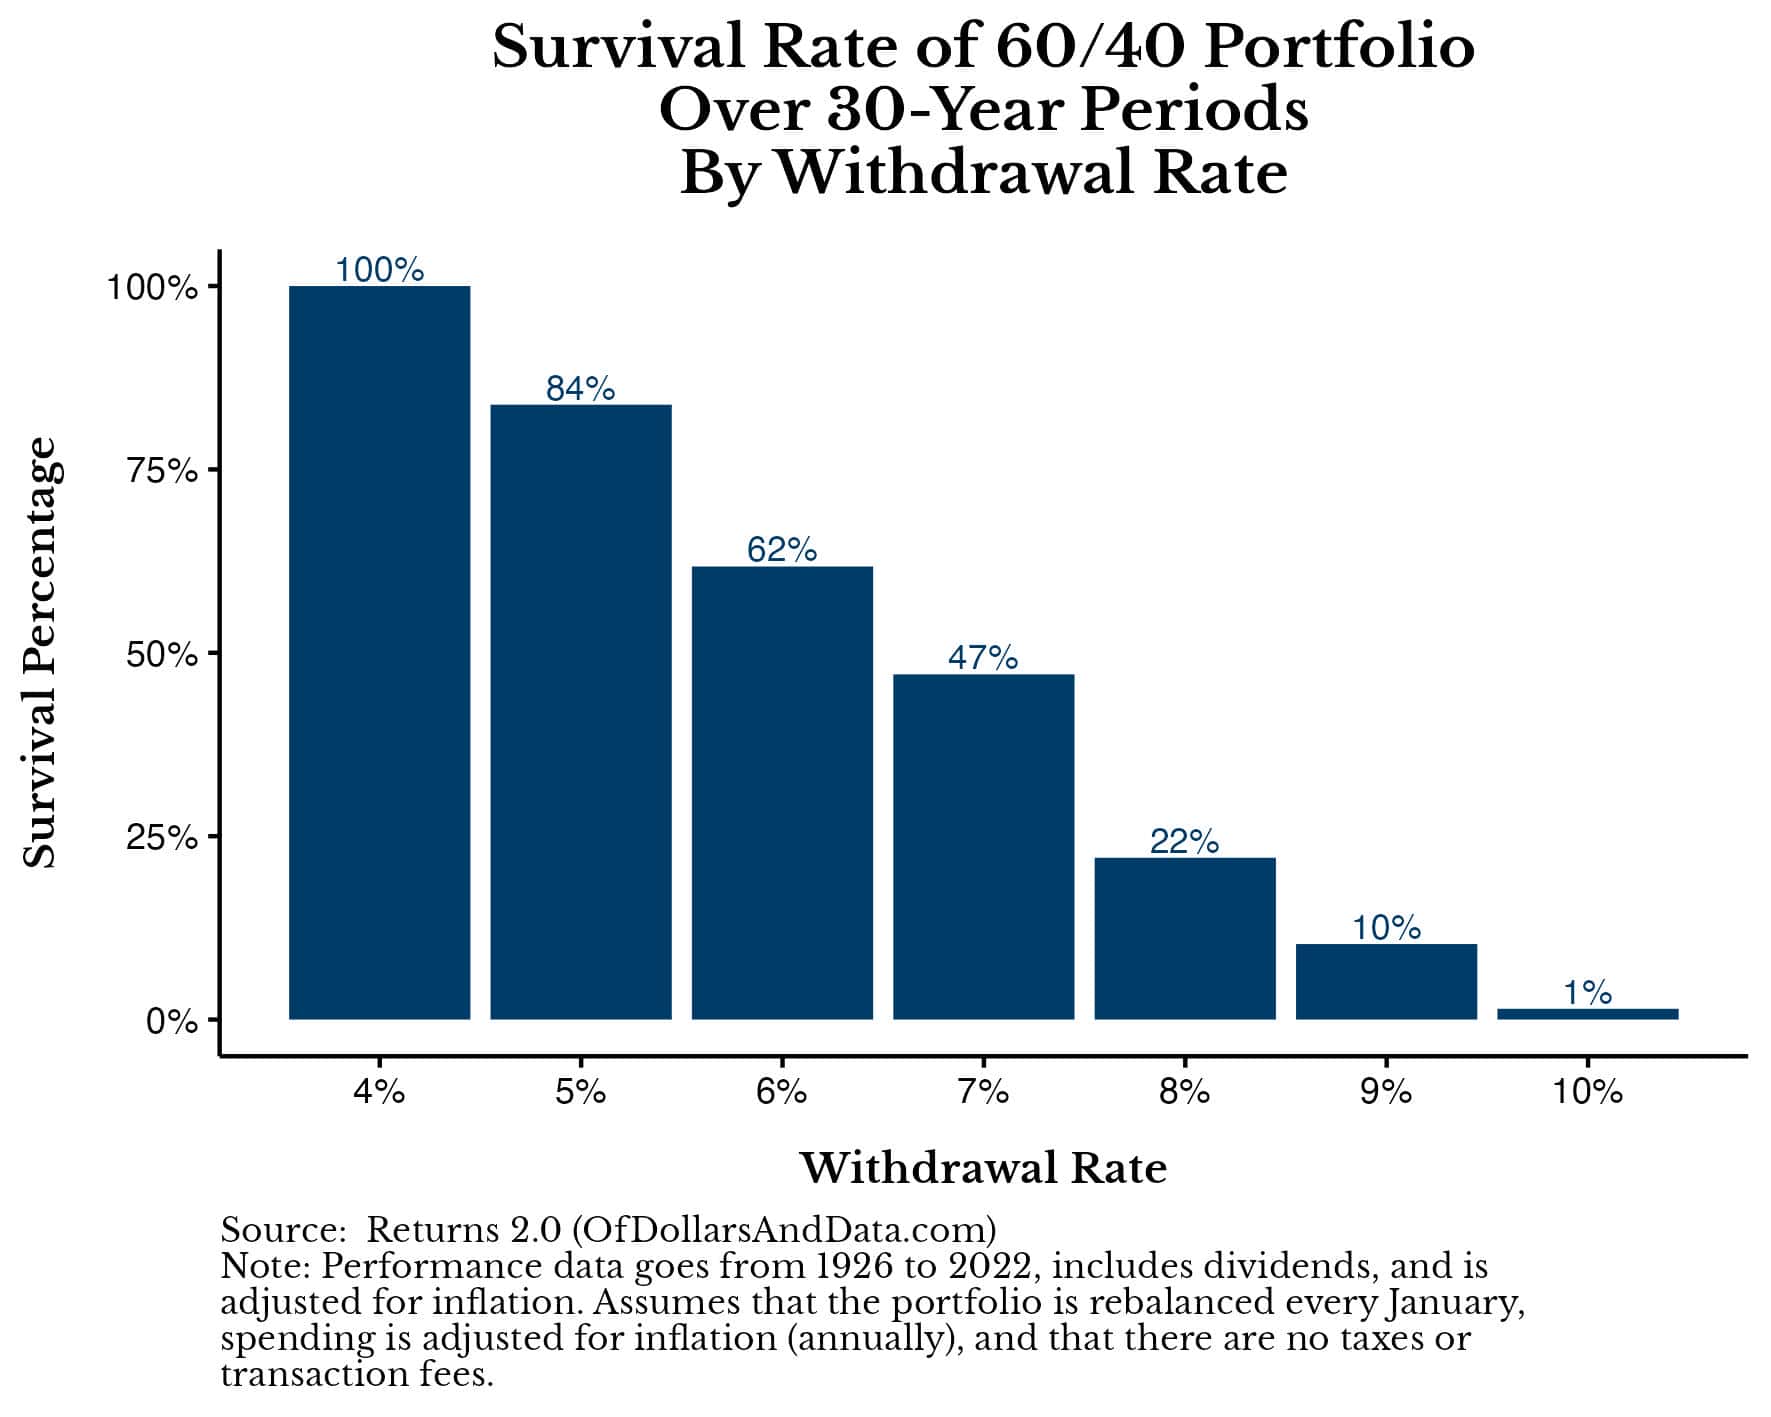
As you can see, while this portfolio does well with a 4% withdrawal rate (surviving 100% of all 30-year simulations), as you increase the withdrawal rate, the rate of failure also increases. As a reminder, in all of the simulations I ran your spending is set at the very beginning of the simulation (Year 1) and then adjusted annually by inflation each year for the next 30 years.
We can compare this to using a 100/0 (“All Stock”) portfolio and see that the All Stock portfolio performs much better at higher withdrawal rates:
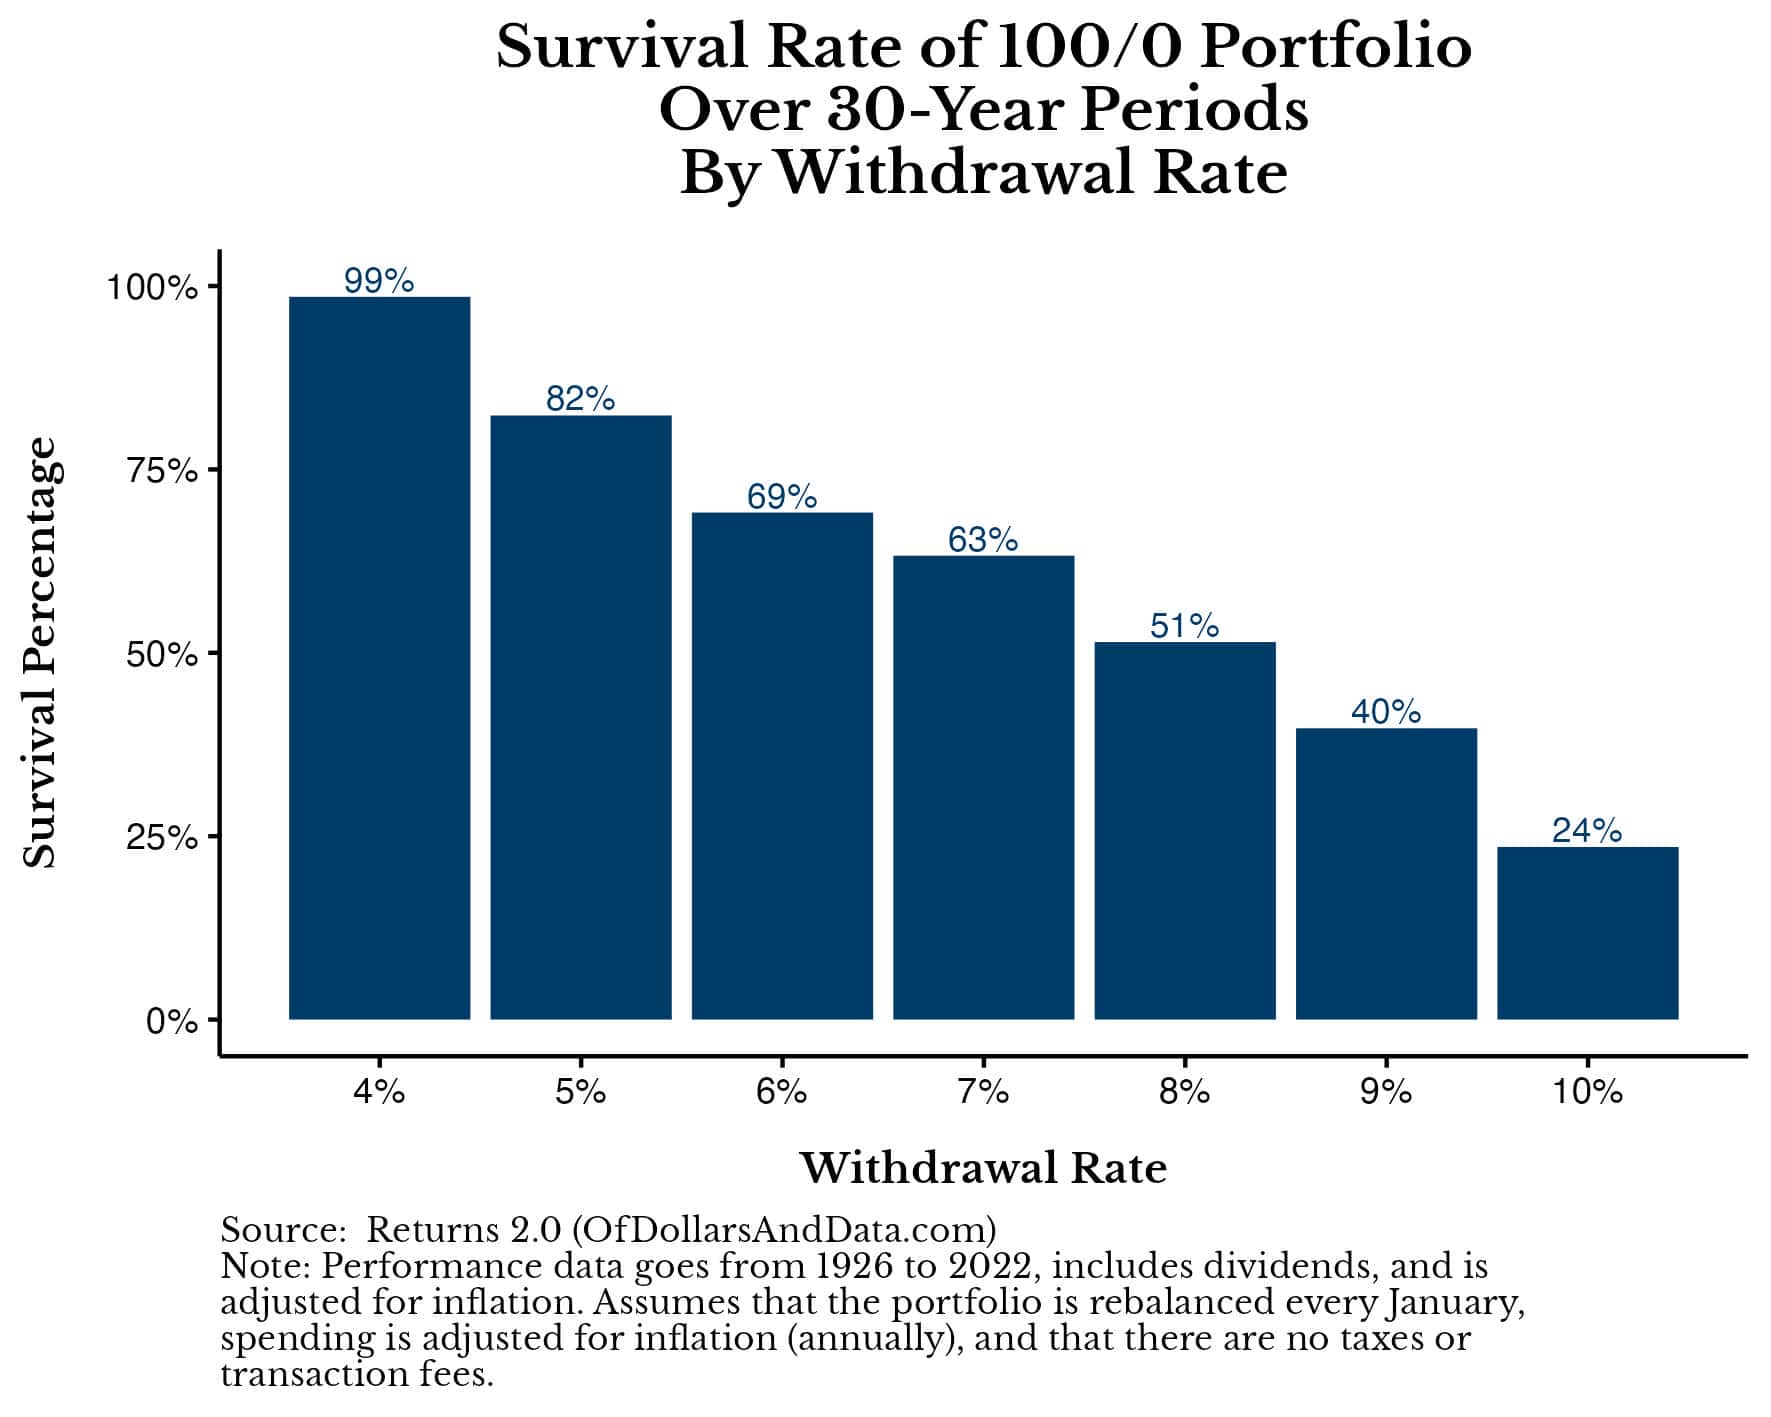
Now, with a 100% U.S. stock portfolio, your chance of survival with an 8% withdrawal rate would’ve been greater than 50% compared to only 22% for a 60/40 portfolio. This is because these 51% of simulations all correspond with historical periods where U.S. stocks had incredible growth without deep, extended downturns. Overall, these suggests that, when you must withdraw more, you need to take more risk to accommodate this higher need from your portfolio.
But instead of just examining these results in a vacuum, I’ve also created a GIF that cycles through these results (from a 50/50 portfolio to a 100/0 portfolio) so you can compare them visually more easily:
This makes it easier to see how much of a benefit you get by relying on a higher stock allocation when requiring a higher withdrawal rate. In addition, I also created a heatmap of these results where you can compare all of these portfolios and their survival probabilities at once (for various withdrawal rates):
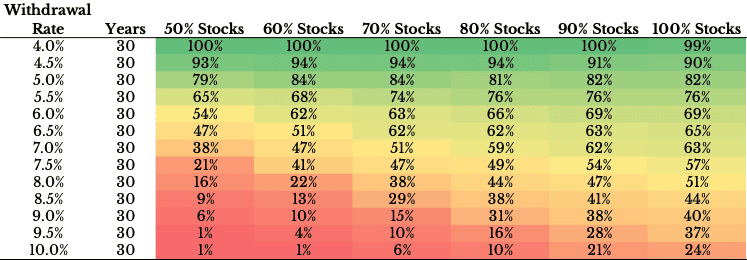
The green section across the top represents the safe withdrawal rate, where you would not have run out of money in nearly all historical periods. But as you move down the table (by increasing your withdrawal rate), the results become increasingly worse as you become more likely to run out of money.
Note that my results above are a bit worse (and more realistic) than the ones presented in the Trinity Study, which relied on data only from 1946-1995:
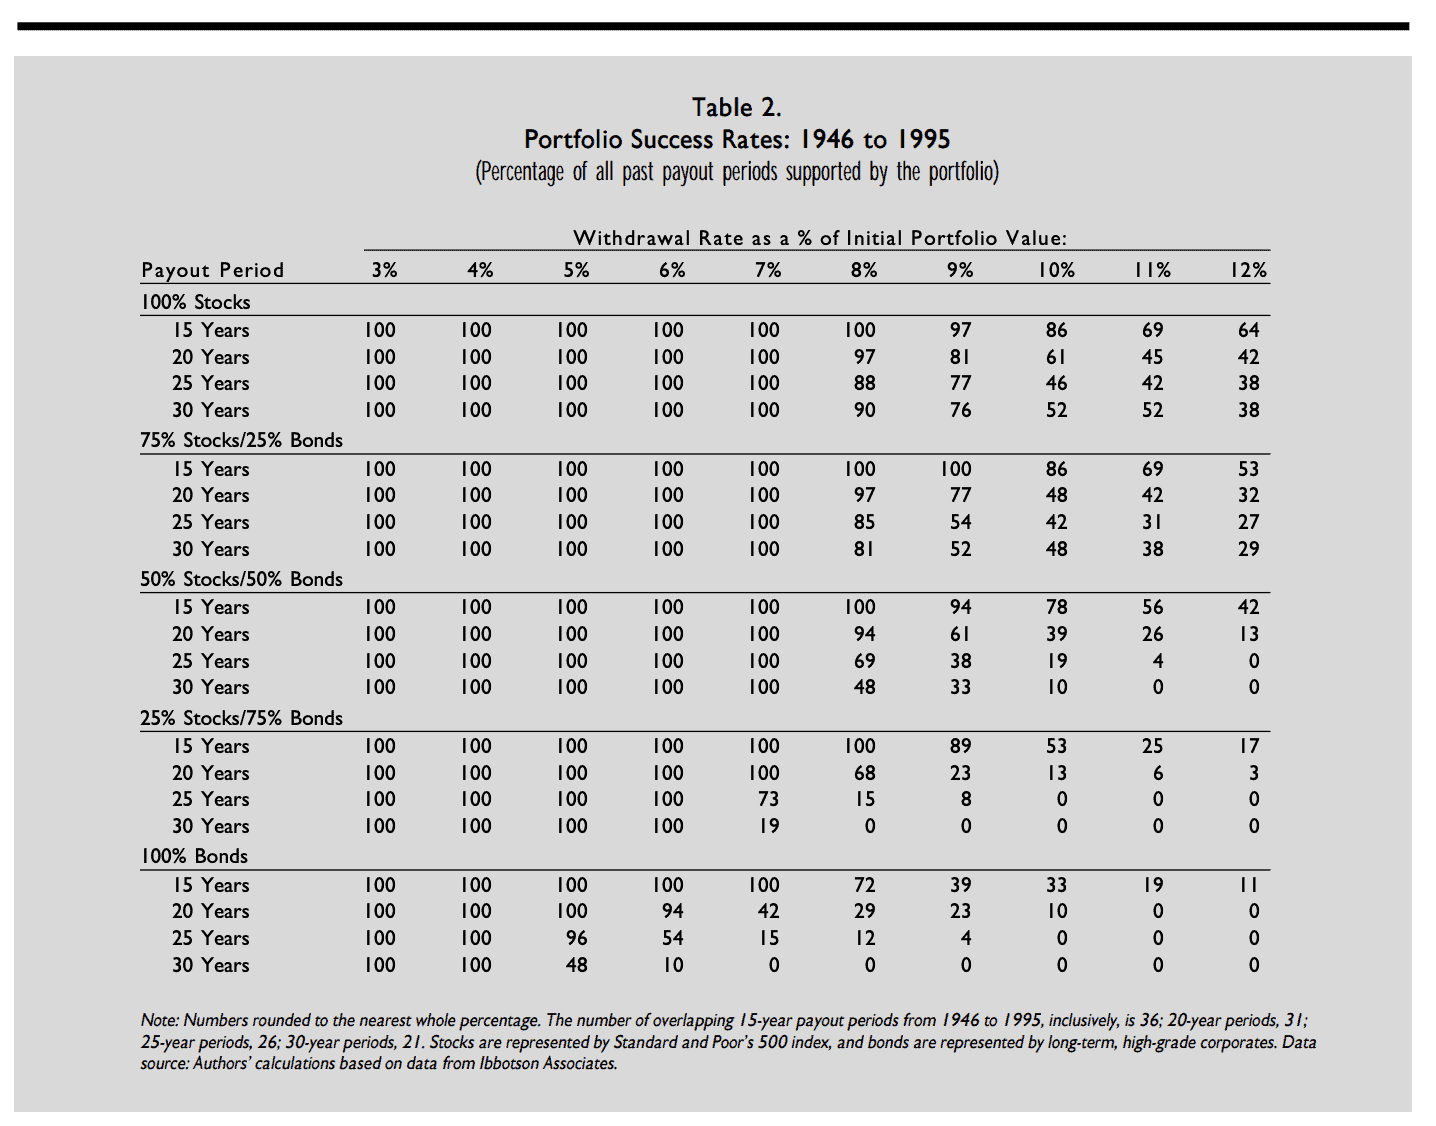
By excluding the Great Depression (1930s) and not yet having the DotCom bubble (2000-2003) nor the Great Financial Crisis (2008-2009), the Trinity Study paints a rosier picture of the safe withdrawal rate than what history actually suggests.
Nevertheless, from my results presented above, we can infer that:
- 4% is still the safe withdrawal rate, and
- If you require a higher withdrawal rate (e.g. 6% or more), then you should have more high growth assets (e.g. stocks) in your portfolio.
Now that we’ve looked at the results for various withdrawal rates and portfolios, let’s discuss some of the risks and criticisms of the safe withdrawal rate strategy.
Risks and Criticisms of the SWR
While the safe withdrawal rate (SWR) strategy is the foundation of most retirement planning, it’s not without its risks and criticisms. Understanding these is paramount if you want a better understanding of how to navigate your retirement. Below are some things to consider when relying on the SWR strategy:
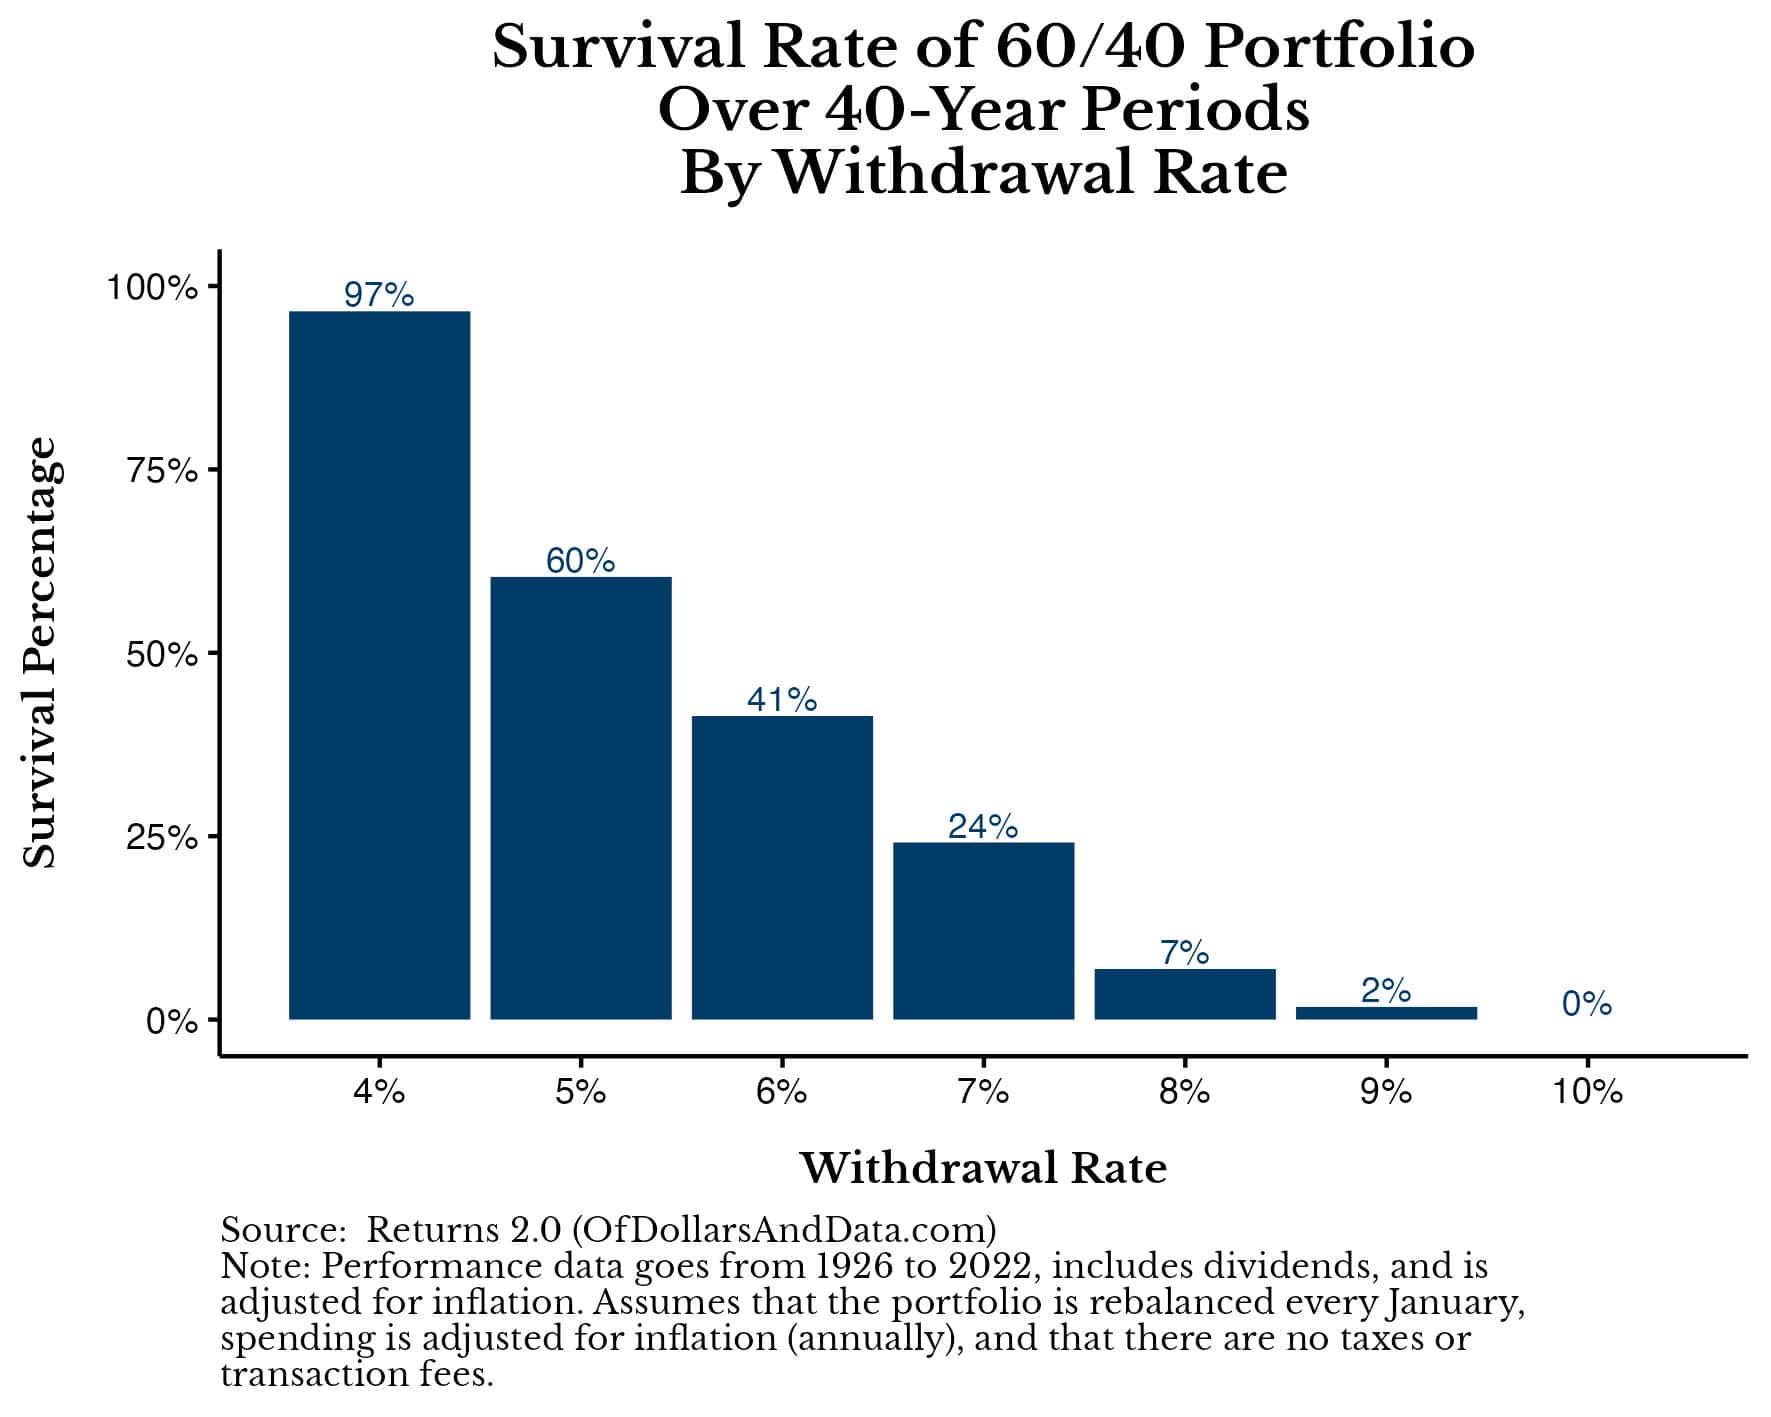
- Longevity Risk: Most retirement SWR simulations assume a 30-year time horizon. Unfortunately, if you end up living beyond 30 years in retirement, your risk of running out of money increases slightly. For example, with a 60/40 portfolio over a 40-year time horizon, the historical survival probability with a 4% withdrawal rate was 97% (compared to 100% with a 30-year time horizon):
- Inflation Risk and Spending Declines: In addition to living longer, the SWR assumes that you will be able to easily increase your spending by inflation annually. This may not be the case during periods of higher inflation. More importantly, this assumption may be wrong altogether. The research suggests that spending in retirement tends to decline over time, by about 1% per year (on average). This makes logical sense as retirees may not be willing or able to consume at the same rate as they did when they were younger. Whether that means not buying new clothes or not being able to travel (for health reasons), spending could decline during retirement. While this isn’t true for all retirees at all periods of time, it does illustrate how the annual inflation adjustment assumed by the SWR strategy may not be realistic.
- U.S. Historical Reliance: Most of the SWR literature is based upon historical data that is very U.S. focused. Given that U.S. stock performance has been an outlier (relative to most other markets) for a long time, relying on this asset class and its higher than average returns may not be a smart choice. Of course I think the U.S. will be fine, but not 7% per year annualized fine. While I haven’t run the numbers on the SWR for a globally diversified portfolio, my hunch is that such a portfolio would not be able to sustain the higher withdrawal rates that a higher U.S. stock portfolio could historically.
- Spending Inflexibility: My biggest gripe with the SWR is how inflexible the spending plan is. You anchor your spending to the first year of retirement and then are forced to change it with inflation annually. However, there is no reason why things need to be this way. Not only will your spending change (and likely decrease during points of your retirement), but the idea that we can’t cut back during hard times or adjust our spending upward or downward seems wrong to me.
- Psychological Discomfort of Withdrawals: Of all the things on this list, the psychological discomfort of withdrawing money from a portfolio may be the thing that prevents most retirees from using safe withdrawal rates. If I had to guess, this discomfort likely comes from the fact that people don’t like the feeling of not making progress. Imagine spending 40 years working and saving and watching your net worth grow to then experience the reverse of this in retirement. This is probably why most retirees don’t drain their principal in retirement. As I stated in Just Keep Buying:
“Across all wealth levels, 58 percent of retirees withdraw less than their investments earn, 26 percent withdraw up to the amount the portfolio earns, and 14 percent are drawing down principal.”
If the research suggests that retirees generally don’t drain their principal, then there is probably a psychological reason for it. And whatever that reason is, that’s one of the reasons why a SWR may not be effective over the long-term for many retirees.
Now that we’ve looked at the risks and criticisms of the safe withdrawal rate, let’s explore some alternative retirement spending strategies.
Alternatives to the Safe Withdrawal Rate
If the safe withdrawal rate isn’t right for you, there are some other alternatives you can consider during your retirement including: the Guardrail strategy, the Flexible Spending strategy, and the Live Off the Interest strategy. I will review each of these in turn.
Guardrail Strategy
The Guardrail strategy is a dynamic approach to retirement withdrawals. It involves setting predetermined “guardrails” or thresholds for your overall portfolio value. If your portfolio value exceeds the upper limits, you can increase your withdrawals. However, if your portfolio drops below the lower limits, you decrease your withdrawals.
The amount you increase or decrease your withdrawals is up to you. For example, Rachael Camp, CFP provided an example where if your portfolio rises enough such that you are only withdrawing 3% of your portfolio, then you increase your spending by 10%. If it falls enough such that you are withdrawing 5% of your portfolio, you would decrease spending by 10%.
For example, if you start with $1 million and are pulling 4% per year ($40,000), with the Guardrail strategy you would keep this constant until your portfolio reached $1,333,333. At this point, $40,000 would only be 3% of your total, then you could increase it by 10% to $44,000 moving forward. From that point you reset the guardrails and adjust your spending accordingly.
This strategy provides flexibility and responsiveness to market conditions, potentially extending the longevity of your retirement funds. It’s particularly useful in managing the psychological discomfort associated with fixed withdrawals (that I mentioned earlier), as it adapts to real-time financial realities.
Flexible Spending Strategy
Similar to the Guardrail strategy, the Flexible Spending strategy relies on market condition to adjust spending over time. It works by dividing your spending into two categories: required and discretionary. Your required spending is the spending that you have to do every year. It is fixed and it adjusts annually with inflation.
However, your discretionary spending includes all the things in life that are nice to have, but not necessary for your retirement. This could include nice vacations, going out to eat, and/or Taylor Swift concert tickets. If it feels discretionary to you, then it is discretionary.
More importantly, your discretionary spending is set at the beginning of your retirement and never adjusts with inflation. However, it does vary based on market conditions, as I detailed in this post:
On December 31 of each year you check to see how far the S&P 500 is away from its all-time highs. Based on that number, your discretionary spending falls into one of three possible conditions:
- Normal market: If the S&P 500 is less than 10% away from its highs, you spend all of your discretionary spending in the next year.
- Correction: If the S&P 500 is more than 10% away from its highs but less than 20% away from its highs, you spend half of your discretionary spending in the next year.
- Bear market: If the S&P 500 is more than 20% away from its highs, you spend none of your discretionary spending in the next year.
The downside to this strategy is that, in some years, you have to cut back on your lifestyle because you have no discretionary spending. However, the upside to this is that in other years you can spend more in retirement. By using the Flexible Spending strategy historically, you could’ve survived with a 5.5% withdrawal rate rather than the 4% withdrawal rate (assuming 50% of your spending was discretionary).
Note that you don’t get to spend more total money in retirement when using the Flexible Spending strategy (this isn’t a free lunch), but you do get to spend a bit more in most years.
Live Off the Interest (aka Match Spending to Income)
The simplest retirement spending strategy is what I call “Live Off the Interest” where you simply live off of the interest/dividends that your portfolio can generate. So if you have a $1 million portfolio that throws off 2% per year in interest/dividend income, then you get to live off of $20,000 a year.
The good thing about this strategy is that it guarantees that you will never run out money. However, the bad thing is that it requires that you save up quite a bit more money to support your lifestyle. In a world of 5% Treasury Bills this strategy is great, but when interest rates were near zero a few years ago, a retiree would have needed a much larger nest egg to get by.
The other issue with this strategy is that your spending will fluctuate over time. If there is a down year in the market and company dividends get cut, then so does your retirement spending. Dealing with this spending volatility on top of the overall lower spending amount (compared to a SWR strategy) could be stressful for some.
Bucket Strategy
Last, but not least, there is the Bucket strategy. This strategy works by bucketing your spending into short-term, medium-term, and long-term buckets and then investing each bucket of money as such. For example, money needed to pay for food and other immediate expenses could be invested in short-term Treasury bills or cash while those expenditures that won’t happen until later (i.e. grandchildren, etc.) can be invested in stocks and other risk assets.
For example, someone with a $1 million portfolio using a Bucket strategy might invest their money as such:
- Short-term bucket: $120,000 in a high-yield savings account or short-term Treasury bills. This covers your living expenses for the first 3 years.
- Medium-term bucket: $400,000 in a balanced mix of stocks and bonds. This portion is for years 4-10 of your retirement, offering a balance between growth and safety.
- Long-term bucket: The remaining $480,000 in diversified stock funds or ETFs, aiming for growth over the long term.
The idea behind the Bucket strategy is to match your investment strategy with the actual liabilities you expect in retirement. This can provide you with more peace of mind than having all of your money in a single account (or bucket).
Though your overall portfolio allocation may be the same between a Bucket strategy and an SWR strategy, by breaking your money into different buckets (or accounts), the Bucket strategy can provide you with an additional layer of psychological comfort. And, in the end, what matters more in retirement than peace of mind?
The Bottom Line
Regardless of what spending strategy you decide to use in retirement, understanding the safe withdrawal rate (SWR) and its alternatives is crucial for navigating your golden years with financial confidence. While the SWR offers a strong foundation, it’s not for everyone. This is where strategies like the Guardrail, Flexible Spending, Live Off the Interest, and the Bucket Strategy can be of use.
So whether you adhere to the traditional SWR, adopt a dynamic approach like the Flexible Spending strategy, or prefer the structured simplicity of the Bucket Strategy, the most effective plan is one that works for you. Retirement is a personal journey, so you shouldn’t feel pressured to live it in one way or another.
Ultimately, what matters is that you spend your money in a way that aligns with your values, goal, and vision for your retirement. I can’t tell you what that is. But, by carefully considering these strategies (and others), you can approach your golden years with greater peace of mind, prepared for whatever the future holds.
Happy investing and thank you for reading!
If you liked this post, consider signing up for my newsletter.
This is post 376. Any code I have related to this post can be found here with the same numbering: https://github.com/nmaggiulli/of-dollars-and-data

