It’s been a tough year for investors, with stocks down around 19% (both in the U.S. and abroad), U.S. bonds down 14%, and the cryptocurrency market down around 60%. Yet, despite the financial turmoil of 2022, there is a silver lining that many investors can take advantage of while there is still time—losses.
What I’m talking about is tax loss harvesting, or the act of selling your securities that have decreased in value in order to recognize a capital loss, which can then be used to offset capital gains from your other investments (now or in the future). Not only can this help reduce your overall tax burden, but it can also free up capital to reallocate to other, potentially more promising, investments. Let’s go through two examples.
First, let’s say you bought $10,000 of an S&P 500 index fund on January 3, 2022 (the first trading day of the year). As of this writing, your position would be down around 18% or $1,800 (including dividends). While you could just hold this position, another option is to sell it, lock in your $1,800 loss (which can be used to lower your tax bill), and then buy a similar but not “substantially identical” security in its place.
For example, if you sold your S&P 500 index fund and rolled the proceeds into a total U.S. stock market index fund, you could lock in a tax loss without losing the underlying exposure to U.S. stock returns. Since the S&P 500 behaves much like a total U.S. stock index fund (i.e. the correlation is typically around 0.99), selling one to buy the other provides tax benefits without materially changing the returns of your portfolio.
Second, let’s assume you bought an individual technology stock in 2021 and you are now down 50% on the position. Another way to tax loss harvest would be to sell this individual stock and roll the remaining funds into a NASDAQ index fund. Not only would this generate a tax loss, but it would also diversify your tech holdings and provide you with returns that were still highly correlated with most individual tech stocks.
Before we go any further, a quick reminder to consult your tax advisor before you make any tax related financial decisions. Since everyone’s situation is different, it can be very difficult to write about taxes for a general audience (see this piece on the best way to organize your assets as an example). With that being said, rather than continuing with the esoteric details of tax loss harvesting (you can read my in-depth write up on it here), let’s take a look at why now is the time to take your losses since you are less likely to see further losses in 2023.
Will You See More Losses in 2023?
Before we dig into whether 2023 will bring further losses, let’s take a step back and demonstrate just how bad of a year 2022 has been. Below I plotted the calendar year returns for U.S. stocks since 1900, assuming that 2022 will have a -26% real return (-19% nominal return with 7% inflation):
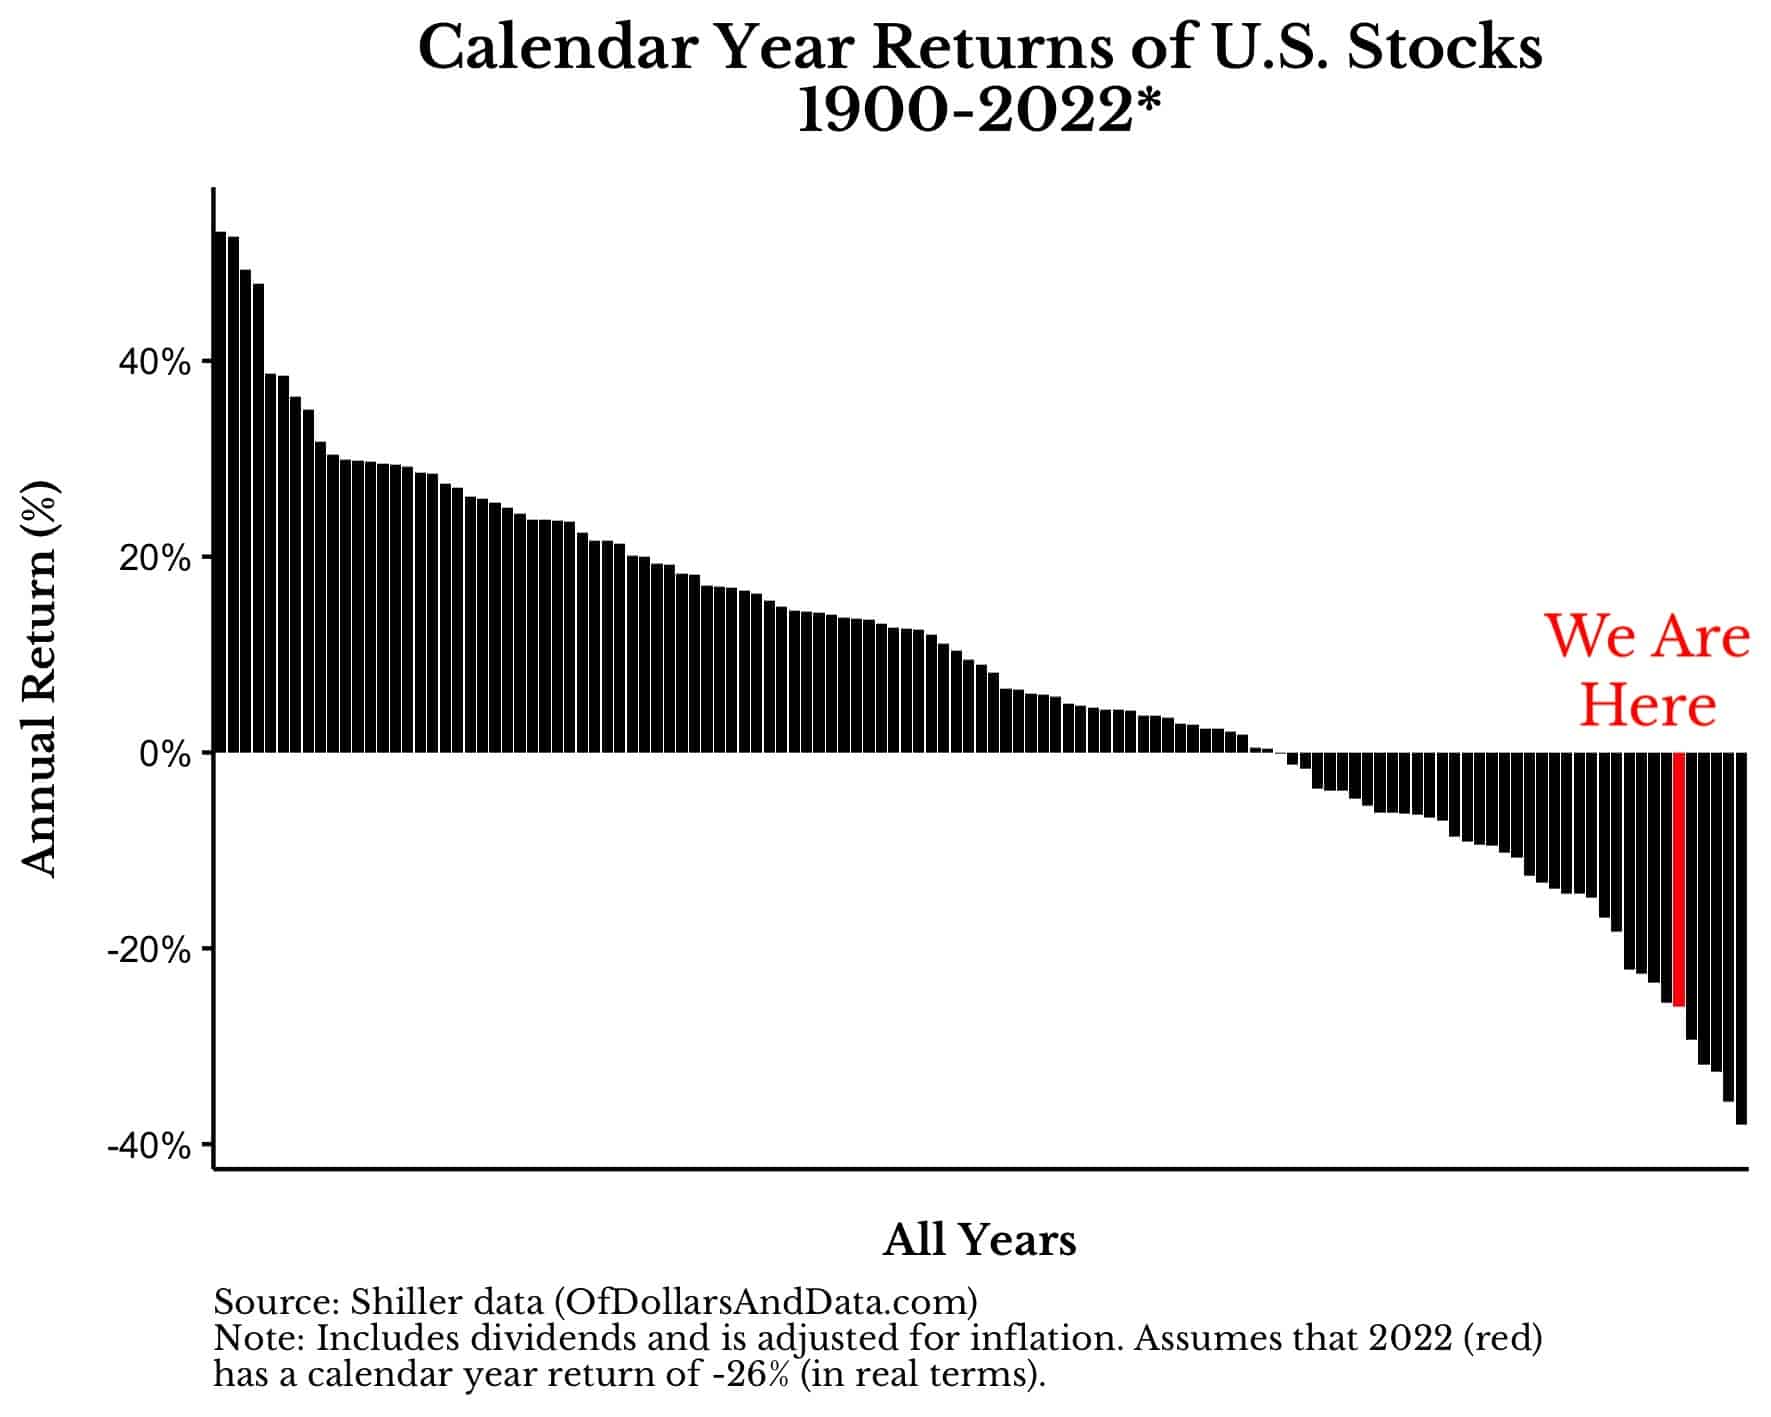
Though 2022 isn’t over yet, you can see that it has been one of the worst years in market history (in real terms).
What does this tell us about 2023? We can’t say for sure, but, historically, big down years (i.e. years with 20% real decline or worse) tended to be followed by big up years. We can see this if we were to plot the distribution of U.S. stock returns following a big down year vs. the distribution of returns in all other years:
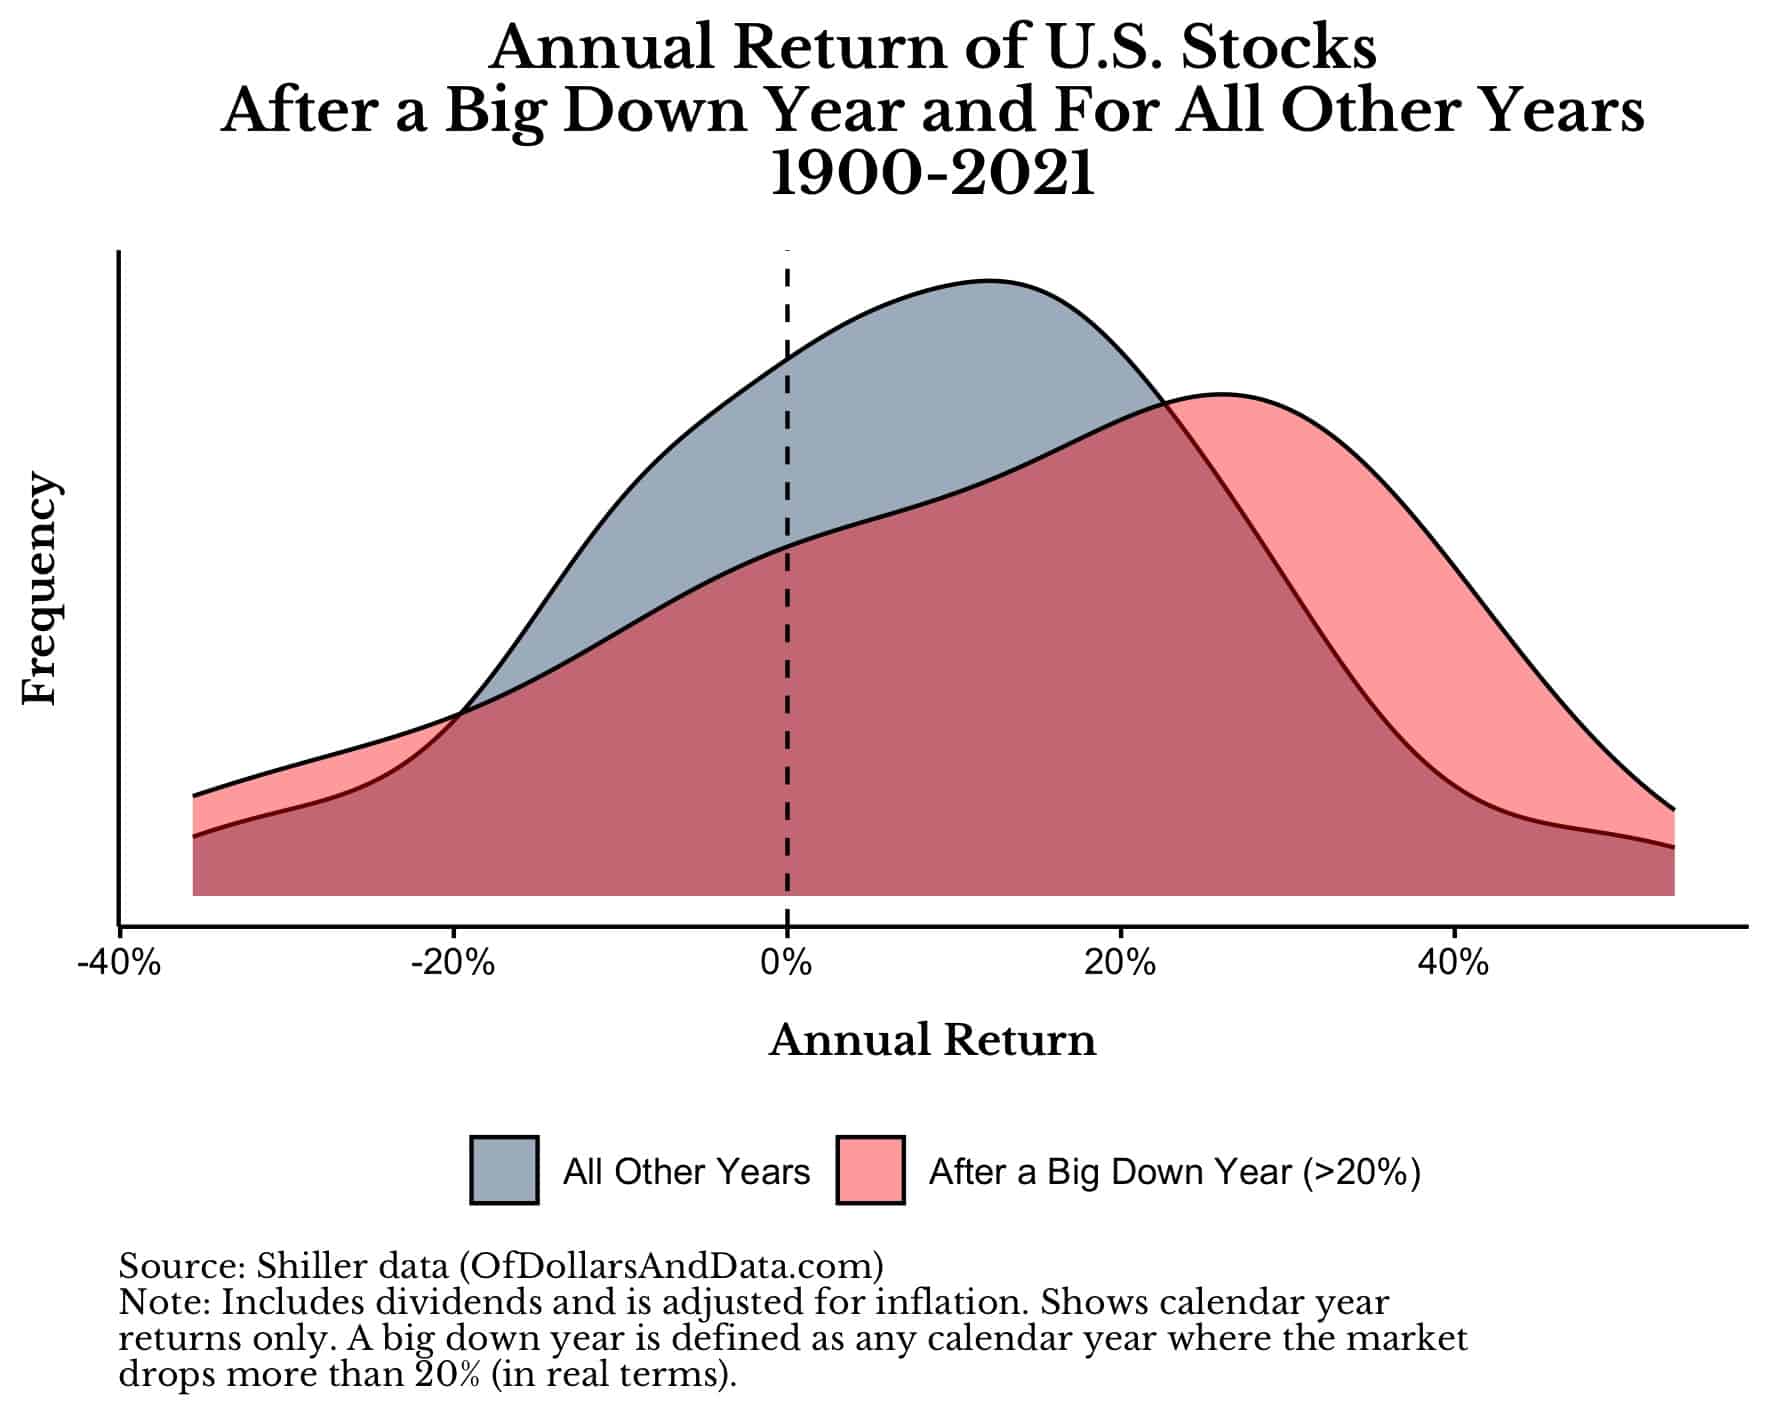
The distribution above suggests that, following a big down year, you are more likely to see larger positive and negative returns. However, since there is far more mass to the right side of the distribution, this suggests that a big recovery is more likely than a continued decline.
Of course, this assumes that all big down years are the same, but we know they aren’t. For example, 2022 was different than other big down years because the yield curve inverted. How much does this matter and does it change anything?
Does a Yield Curve Inversion Change Anything?
Given that the yield curve inverted in 2022, we need to examine what returns look like following an inversion. After digging into the data, I discovered the answer—after an inversion returns tend to be more bell shaped and more negative.
To demonstrate this, I’ve plotted the distribution of calendar year returns in all years following a yield curve inversion versus the distribution of returns in all other years (since 1978):
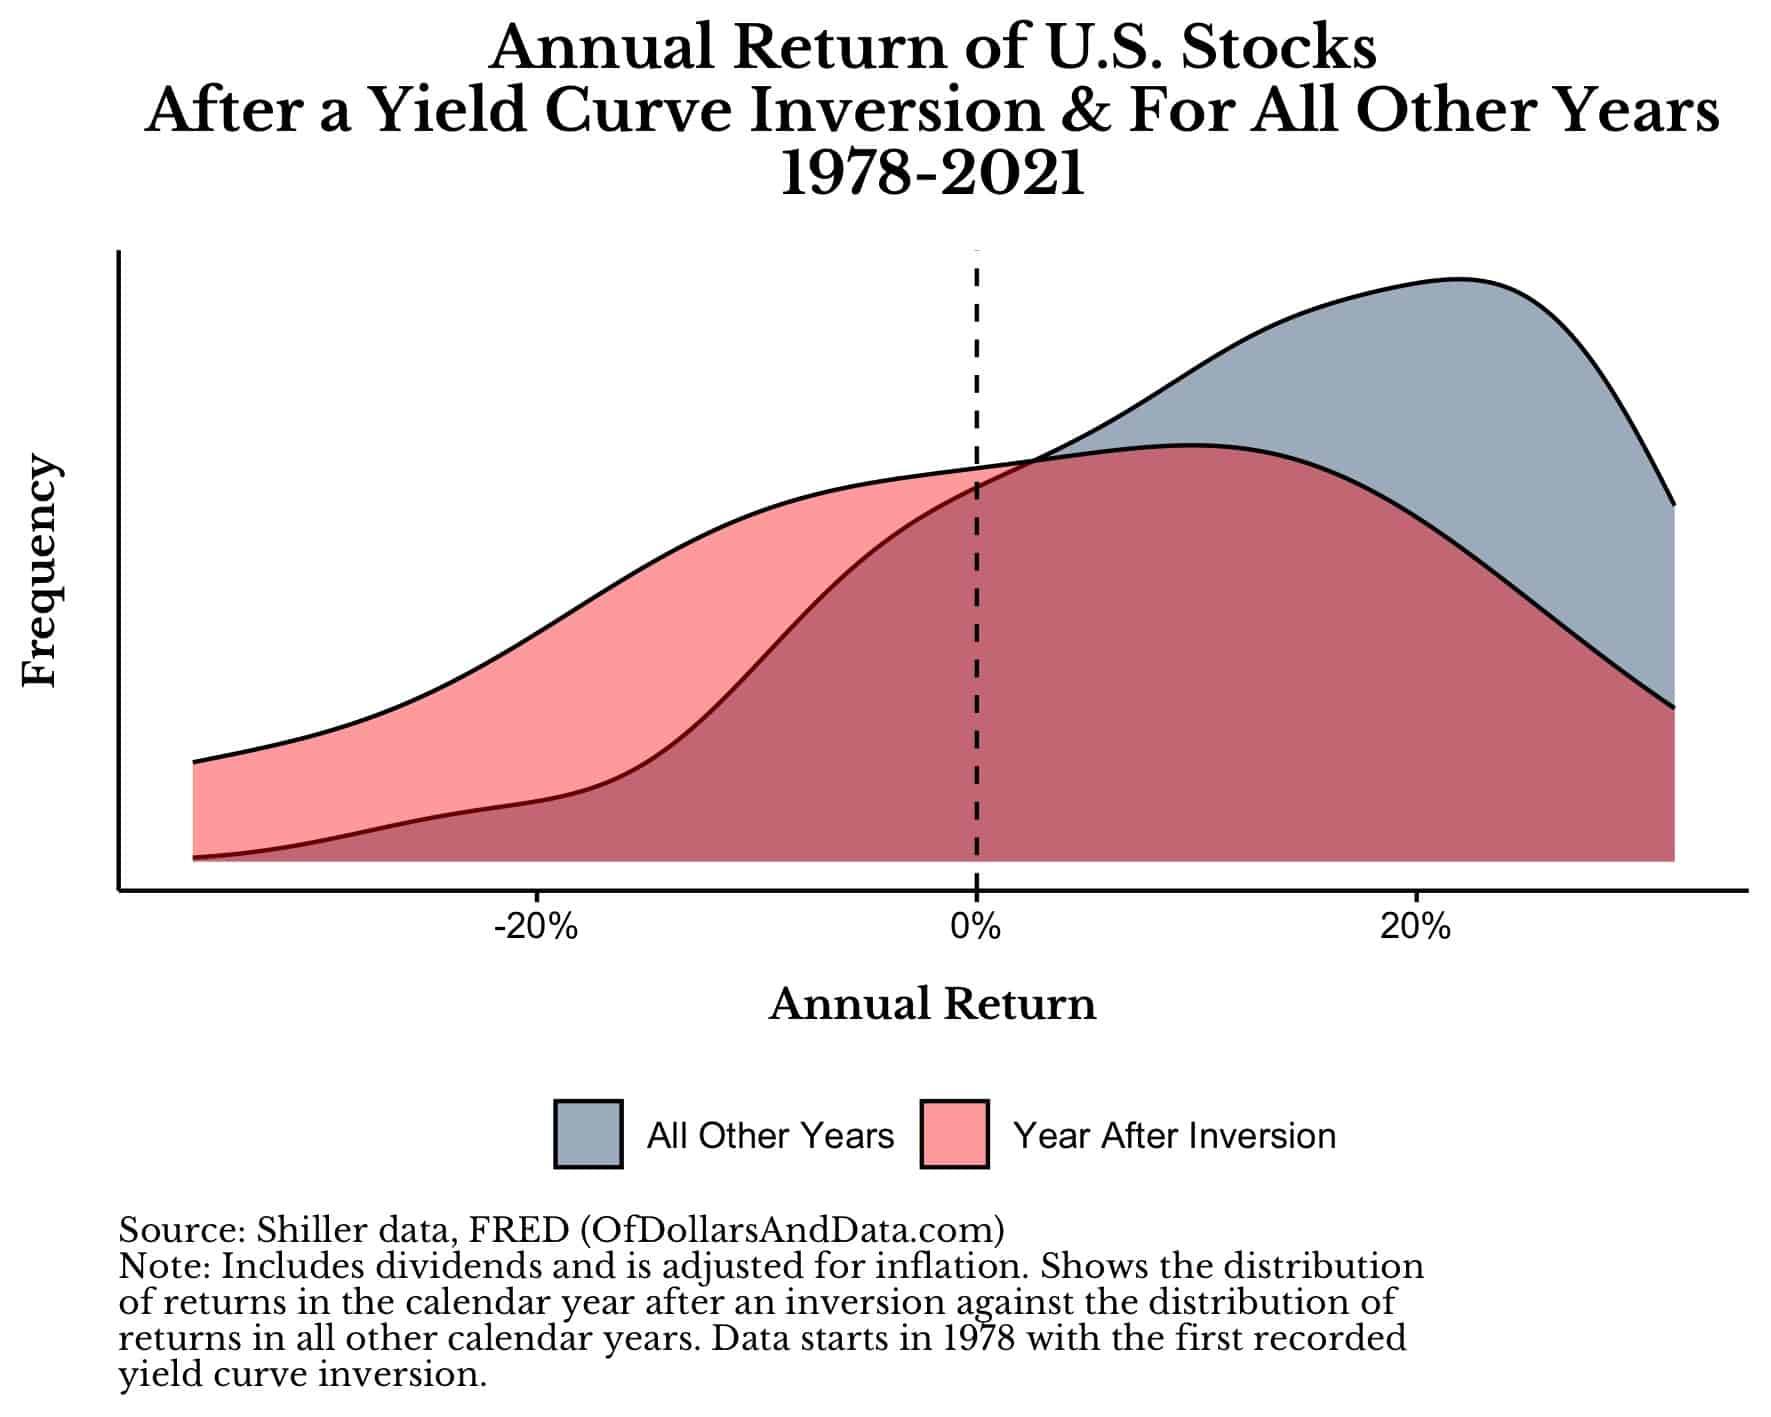
This plot suggests that, in the year after a yield curve inversion, returns are more likely to be negative than in years without an inversion. However, this plot also suggests that the probability of a continued decline after an inversion is more or less a coin flip. Since the distribution of returns following an inversion is bell-shaped, positive returns and negative returns are equally likely.
We can see this more clearly if we plot the annual returns of U.S. stocks since 1978 and highlight (in red) every year after a yield curve inversion took place:
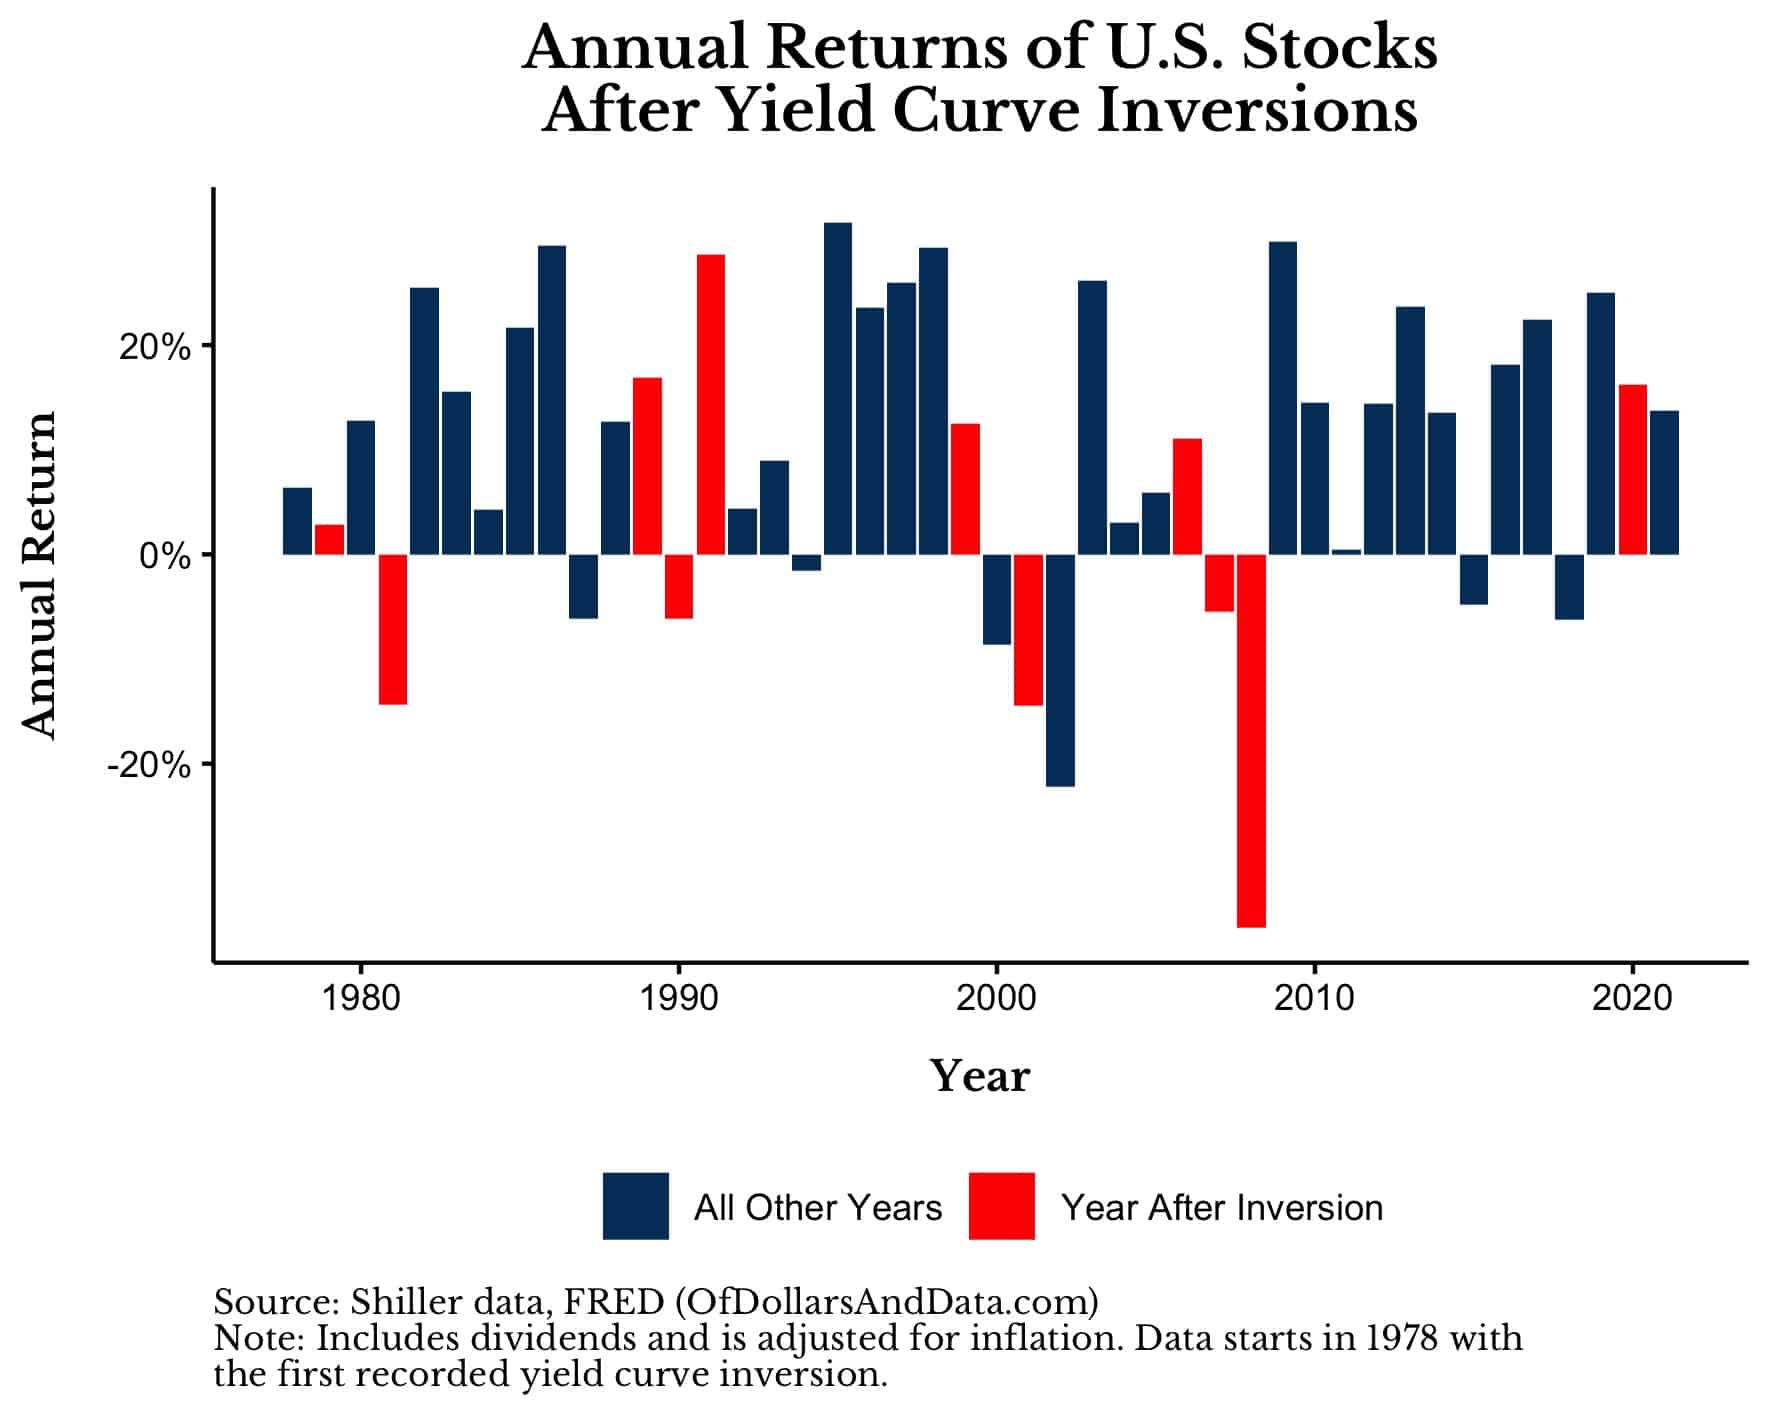
As you can see, roughly half the red bars are positive and roughly half are negative with no consistent pattern as to when they occur. This suggests that yield curve inversions may not be as predictive about future returns as we might have hoped.
Back to Base Rates?
So where does this leave us? If big down years tend to be followed by big recoveries, but yield curve inversions tend to be followed by almost anything, is 2023 more likely to be an up year or a down year?
The answer is—an up year. Why? Because, historically, most years are up years for U.S. stocks. In fact, in roughly seven out ten years since 1900, U.S. stocks have generated a positive real return. If we were to plot the percentage of years where U.S. stocks had a positive return (by decade) since 1900, we would see the following:
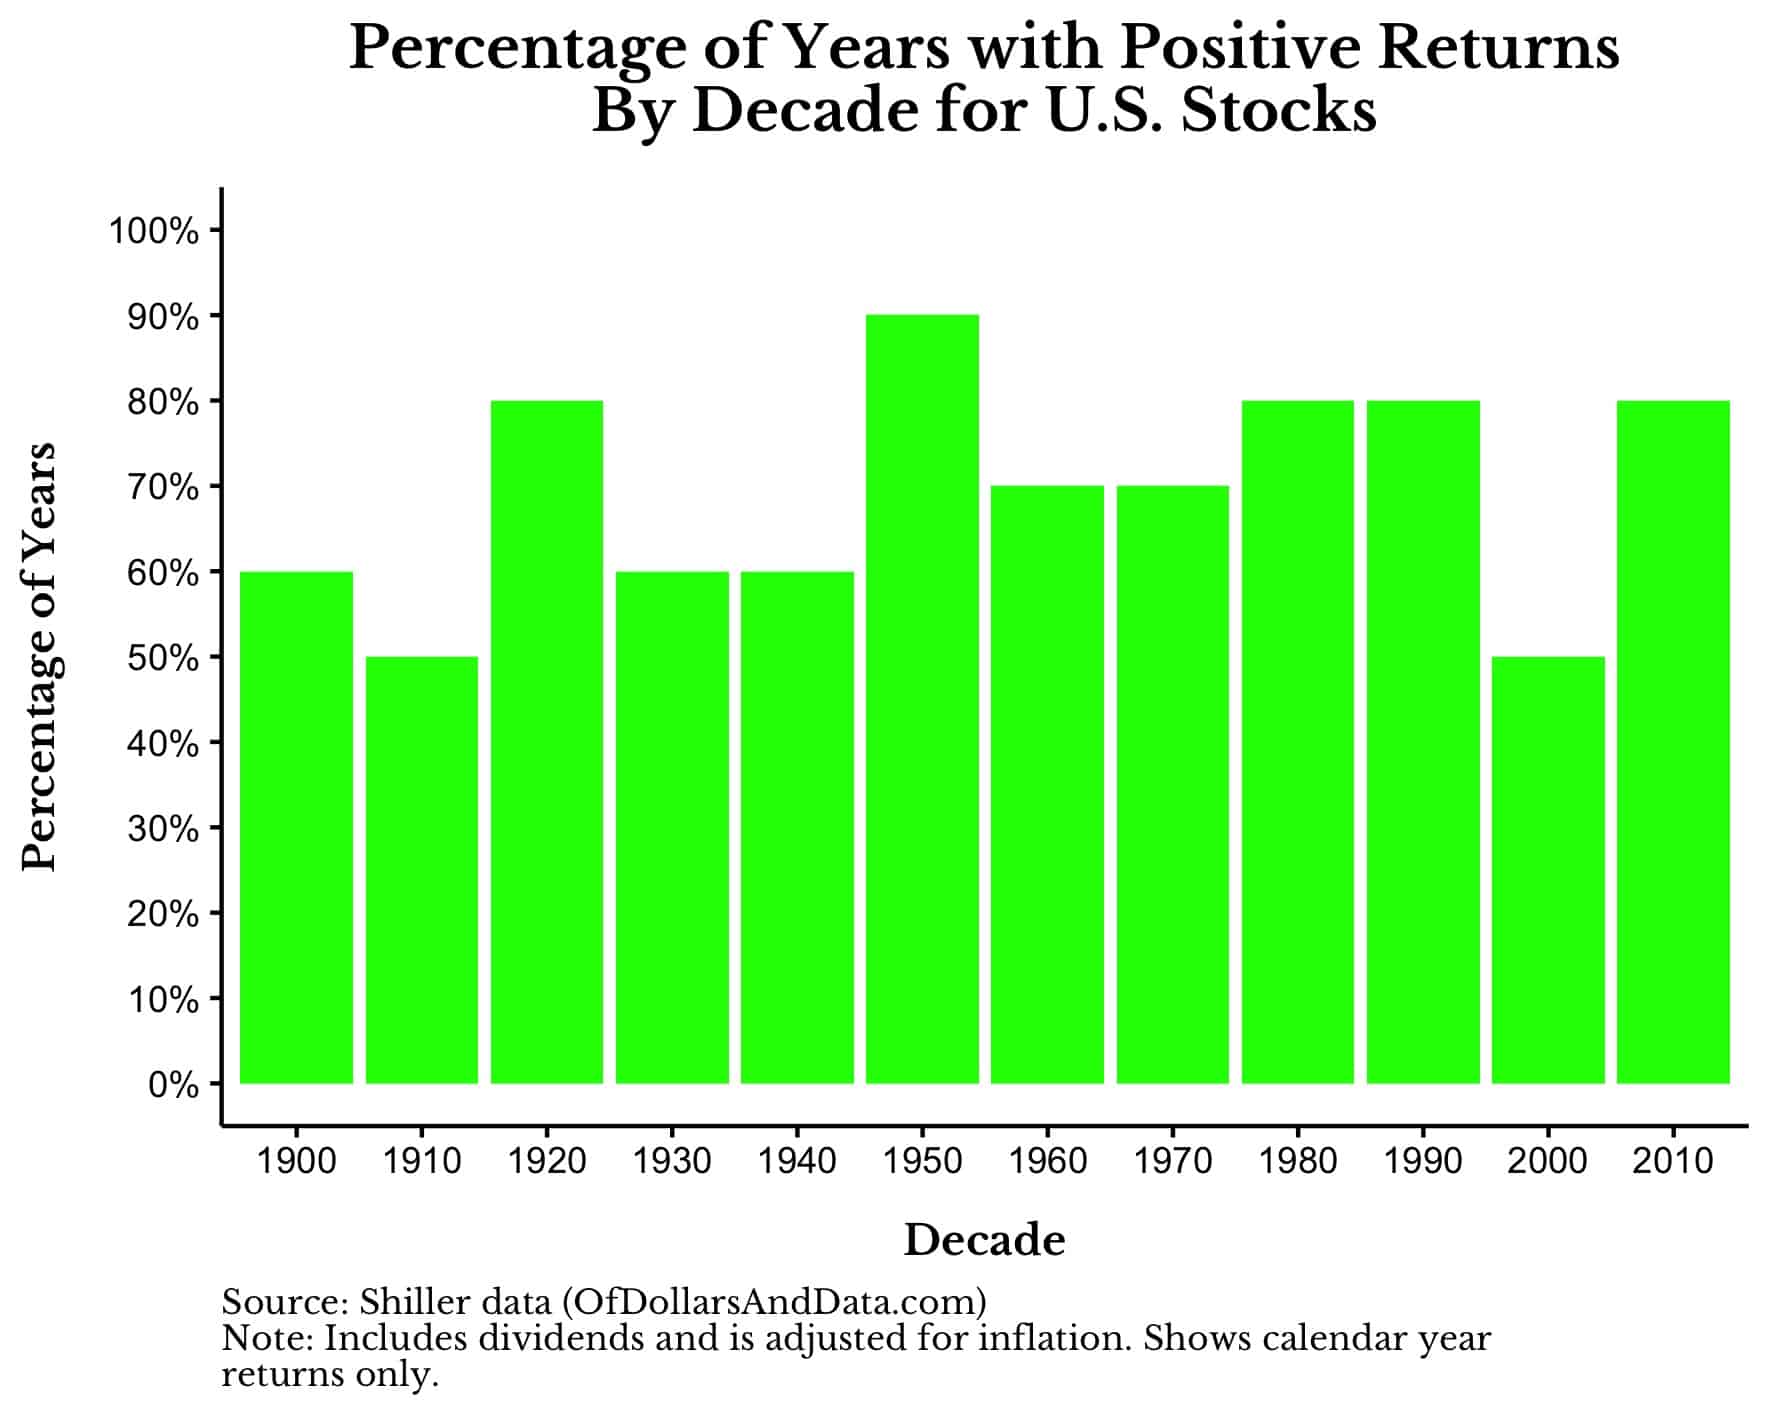
In the best decades, U.S. stocks had positive returns in nine out of ten years, while in the worst decades they had positive returns in five out of ten years. This surprised me as I expected some decades to have more years with negative returns than positive returns, but this hasn’t been the case. Either way, a 70% chance of a positive return sounds pretty good to me.
Though context can sometimes help us to predict the future, it can also lead us astray. That is why, at times, the best predictor of the future is the most common outcome of the past (i.e. the base rate). For U.S. stocks that means a 70% chance of a positive return in a given calendar year.
Of course, 2023 may not follow the base rate for a host of reasons, but it’s still the best information we have. And with that information, you should get your losses while you still can.
Happy investing and thank you for reading!
If you liked this post, consider signing up for my newsletter.
This is post 328. Any code I have related to this post can be found here with the same numbering: https://github.com/nmaggiulli/of-dollars-and-data

