With 2021 fast approaching, it’s that time of year when many individual investors are making changes to their portfolio. Whether you want to rebalance, tax loss harvest, or adjust your asset allocation, year end is a logical time to do it. But before you make your next big investment move, you should ask yourself whether your assets are organized properly.
What I’m talking about is asset location or how you distribute your assets across different account types. It’s not about what you own, but where you own it. For example, do you have your bonds in your taxable accounts (i.e. brokerage), your nontaxable accounts (i.e. 401k, IRA, etc.), or both? What about your stocks?
The conventional wisdom suggests that you should put your bonds (and other assets that pay frequent distributions) into your nontaxable accounts and your stocks into your taxable accounts. The logic being that, if you have more bond income (i.e. interest) than stock income (i.e. dividends), you should shelter it from taxes. More importantly though, since the tax rate on bond income is higher than the tax rate on stock income (ordinary income vs. capital gains), having your bonds in your nontaxable accounts would avoid these higher rates.
Historically, this strategy would have made sense when bond yields were much higher than dividend yields on equities. However, with low rates and low growth expectations for bonds going forward, shielding them from taxes may not be the best choice. In fact, if you want to optimize your asset location, you should put your highest growth assets in tax-sheltered accounts (i.e. 401k, IRA, etc.) and your lowest growth assets in taxable accounts. This is true even though tax rates on ordinary income (and interest) exceed those on capital gains.
There are some exceptions to this guideline (which I will discuss later), but this post will illustrate why this idea is generally correct. Before we get into that though, we need to understand just how much taxes can drag down your investment returns.
How Bad Are Taxes Really?
Everyone seems to dislike taxes, but few investment articles ever attempt to quantify just how bad they are. So let’s find out. To do this I will simulate a single $10,000 investment into three different account types:
- No Tax: A nontaxable account (i.e. Roth 401k, Roth IRA, etc.) where all relevant income taxes have already been paid.
- Taxed Once: A taxable account (i.e. brokerage) where capital gains taxes are only paid at account liquidation. Assume that there are no dividends to be paid and that all gains are realized at the end.
- Taxed Annually: A taxable account where capital gains taxed are paid every year. Imagine that the entire portfolio is sold and re-bought once a year. This generates realized gains at the long-term capital gains rate.
All accounts will experience a 7% annual growth rate (over 30 years) and the taxable accounts will pay a 15% long-term capital gains rate when applicable. Also, I am using a Roth 401(k)/IRA here because I only want to compare the effect of taxation that occurs after income taxes have been paid. I have removed the first layer of taxation (income taxes) in this simulation and, therefore, only want to examine the second layer (capital gains) explicitly.
If I were to compare a $10,000 investment into a traditional 401(k)/IRA with a $10,000 investment in a taxable account this would be comparing pre-tax money to post-tax money, which wouldn’t be fair. Despite this difference, please just trust me that the results you see here hold regardless of whether you use a Roth or traditional 401(k)/IRA. If you don’t understand how a Roth 401(k)/IRA can be equivalent to a traditional 401(k)/IRA in this setting, please read this.
I digress. The point of this exercise is to quantify the long-term benefit of avoiding capital gains (“No Tax” vs. “Taxed Once”) and the benefit of not buying/selling annually (“Taxed Once” vs. “Taxed Annually”).
If we were to plot the growth of $10,000 for these three account types over 30 years, after all applicable capital gains taxes had been paid, it would look like this:
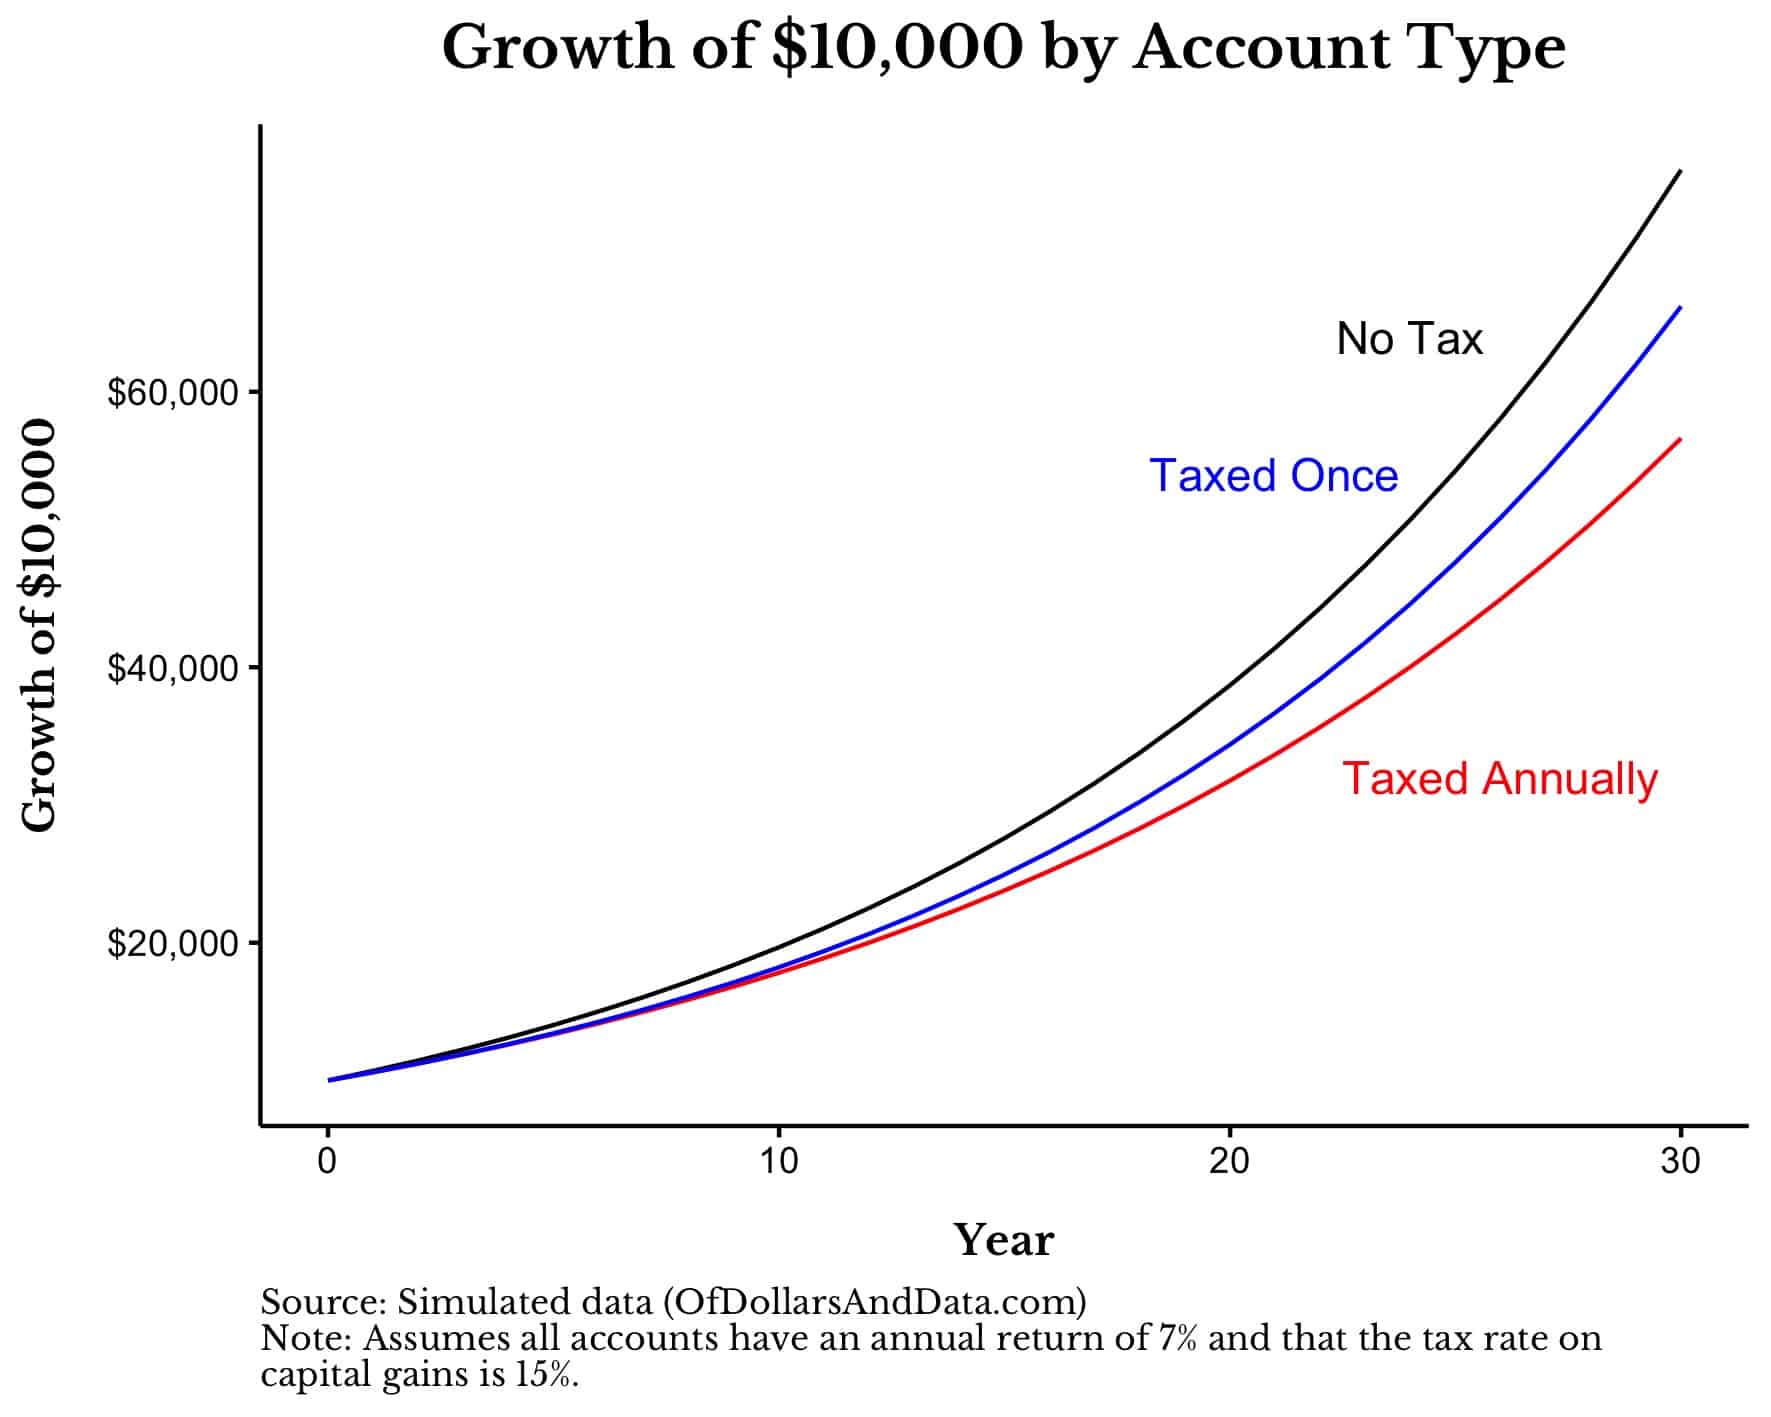
As you could’ve guessed, the more often you pay taxes, the lower your investment returns. After 30 years, the “No Tax” account ends up with ~$76,000, the “Taxed Once” account ends up with ~$66,000, and the “Taxed Annually” account ends up with ~$57,000. In percentage terms, the “No Tax” outperforms the “Taxed Once” account by 15% in total or by 0.45% annually.
In other words, the benefit of avoiding capital gains taxes by using a nontaxable account is about 0.45% a year (assuming these growth rates and tax rates). This is similar to the annual tax premium I found when utilizing a 401k (all else equal).
But this comparison assumes that you will be able to buy and hold in your taxable account for 30 years. If you don’t have this level of discipline, then the calculus changes significantly. For example, if you were to trade in/out of your positions annually (“Taxed Annually”), you would lose an additional 0.5% in annual return to Uncle Sam when compared to the nontaxable account.
That’s basically 1% a year you end up losing when you use the “Taxed Annually” strategy compared to the “No Tax” strategy. Half of that loss comes from using a taxable account and the other half comes from trading in/out of that taxable account too often. Why is the “Taxed Annually” strategy so disastrous for your returns? Because it prevents your gains from compounding on themselves.
Mathematically you only get 85% of your expected return when you realize gains annually at the 15% rate [1 – 0.15 = 0.85]. This is equivalent to compounding your wealth at 5.95% a year [85% * 7% = 5.95%] instead of 7% a year because of taxes. This simple math explains why high turnover strategies are not ideal for taxable accounts.
We can see this more clearly if we show just the first three years of the plot above:
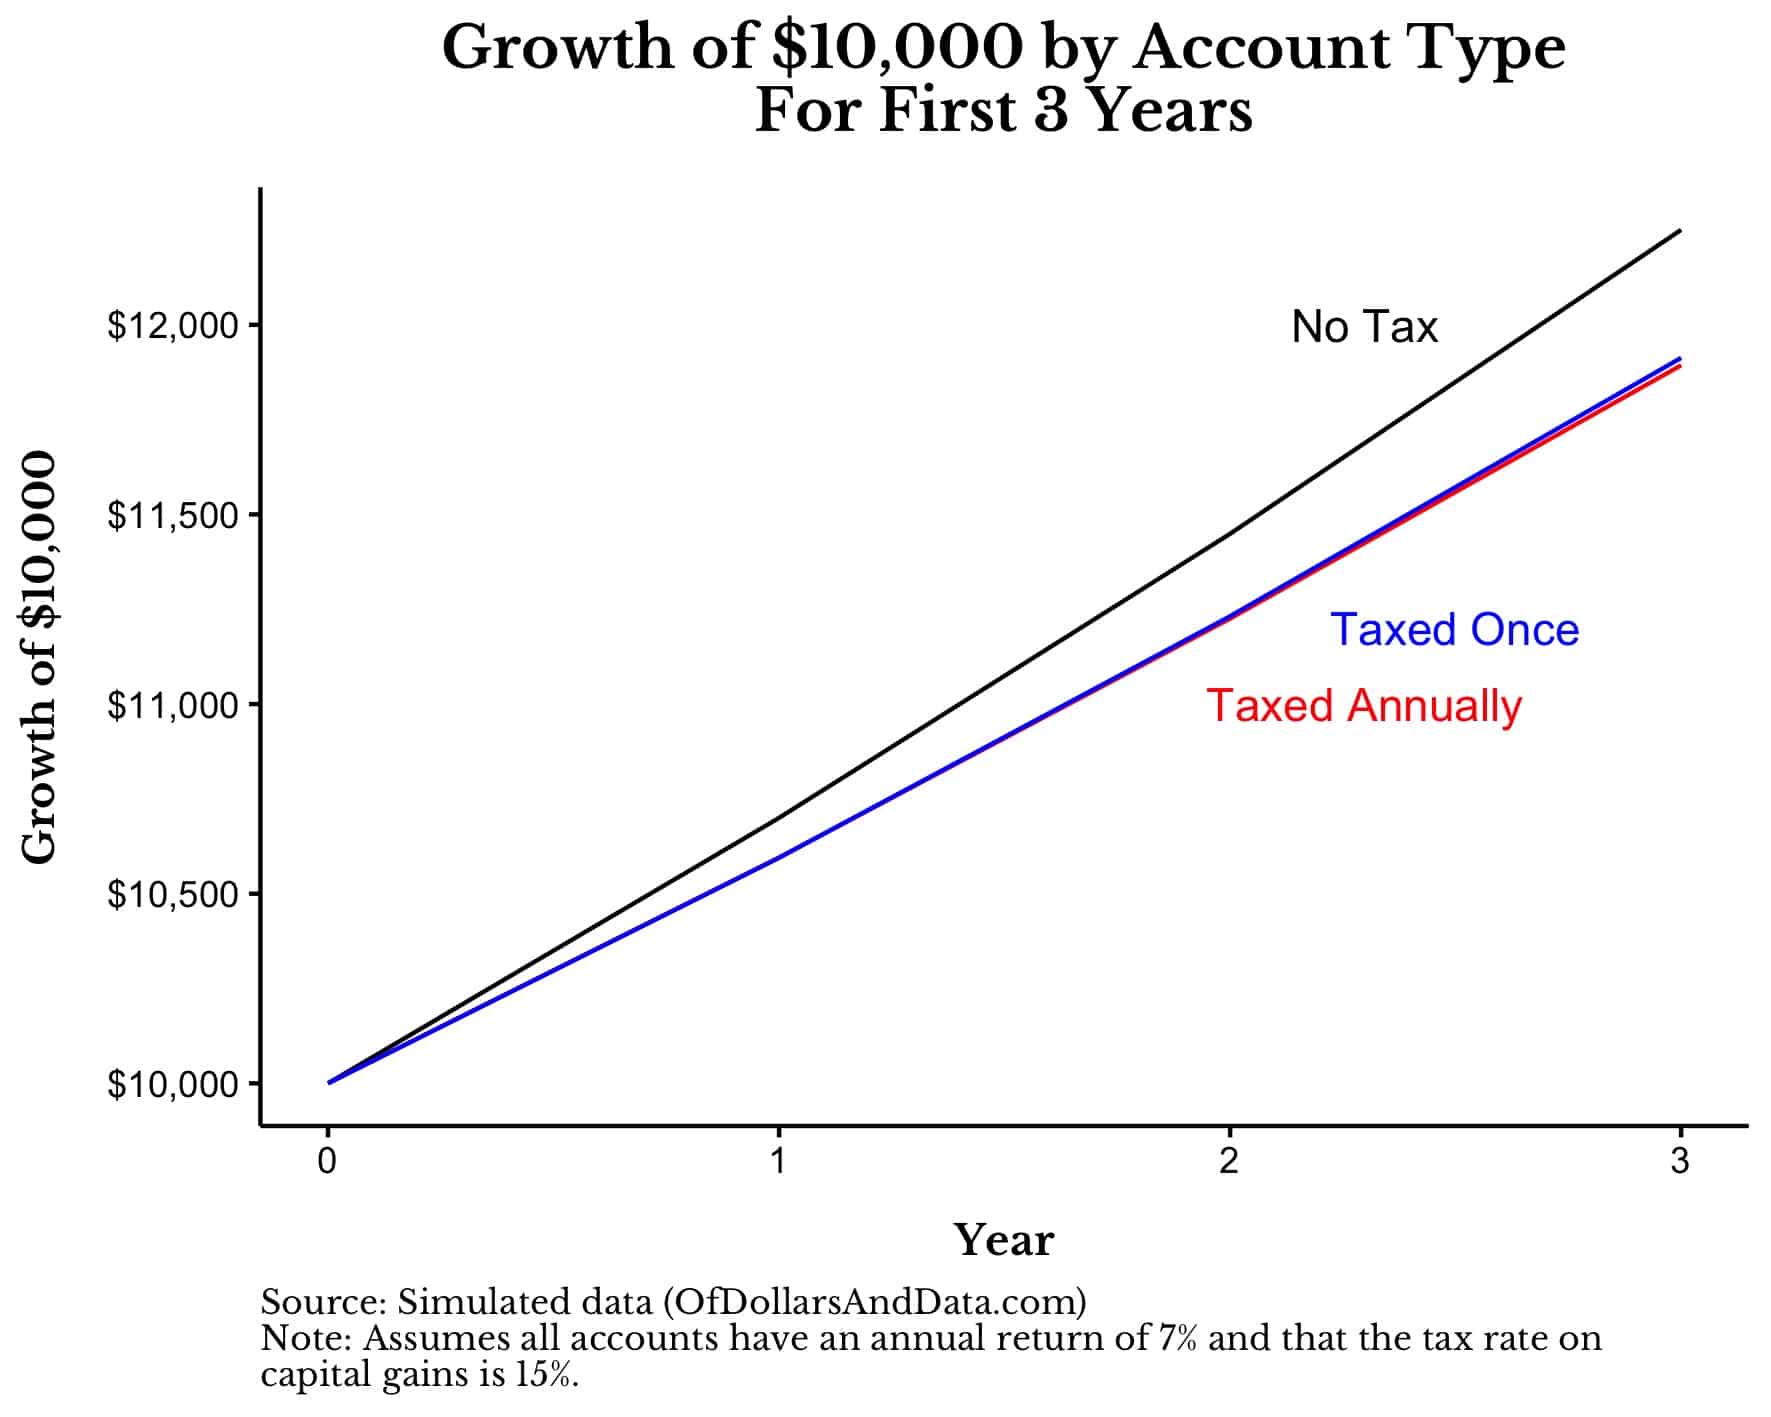
As you can see, that the “Taxed Once” and “Taxed Annually” strategies are identical after one year because both have paid one year’s worth of capital gains taxes compared to the “No Tax” strategy. However, after two years these strategies start to diverge as the “Taxed Once” strategy defer its taxes from prior years into the future. This divergence is small in the short run, but adds up in the long run.
From this simulation we can see how taxation, especially frequent taxation, detracts from long-term returns. More importantly though, this framework will be useful in understanding why higher growth assets belong in nontaxable accounts (i.e. 401ks, IRAs, etc.).
Why High Growth Assets Should Be in Nontaxable Accounts
If you want to understand logically why high growth assets are better off in nontaxable accounts, let’s use an extreme example. Imagine you invest $10,000 each into two different assets (Asset A and Asset B). Asset A doubles in price every year but pays no dividends/interest. Asset B never changes price but pays out 1% annually in interest.
After 1 year, the account holding Asset A will have $20,000 (before taxes) and the account holding Asset B will have $10,100 (before taxes). Now, let’s assume that the long-term capital gains tax is only 1% and the tax rate on interest is 99%. Remember this is an extreme example, but will illustrate my point.
If you had to put one of these assets into a nontaxable account and one into a taxable account, which would you put where? It might seem logical to put Asset B into a nontaxable and Asset A into a taxable account because you want to avoid the 99% tax rate on Asset B’s interest and just pay the 1% tax on Asset A’s capital gain, right?
Unfortunately this is suboptimal. Because paying 1% on the $10,000 gain from Asset A ($100) is greater than paying 99% on the $100 gain from Asset B ($99). More simply, $100 in taxes owed from Asset A > $99 in taxes owed from Asset B. Technically, you save one dollar by putting Asset A (the high growth one) into a nontaxable account and Asset B into a taxable account.
Yes, this exercise is extreme, but it is a reminder that you need to consider total taxes owed (growth rate * tax rate), not just the tax rate before making an asset location decision. If we re-do the above analysis with more reasonable growth and tax assumptions, this will become more apparent
For example, let’s now assume that Asset A earns 7% a year while Asset B earns 2% a year. After investing $10,000 for 1 year, the account for Asset A will have $10,700 (before taxes) and the account for Asset B will have $10,200 (before taxes). Assuming a 15% long-term capital gains rate and a 30% tax rate on interest income, the taxes owed from Asset A would be $105 ($700 gain * 15%) while the taxes owed from Asset B would be $60 ($200 gain * 30%).
Once again we can see that it would be better to shelter Asset A from taxes (and put it in a nontaxable account) compared to Asset B. In fact, the tax rate on interest income would have to be higher than 52.5% ($105/$200) before it would make sense to place Asset B into the nontaxable account.
We can take this thought experiment to another level by comparing the following investment options over 30 years:
- High Growth Nontaxable: Invest $10,000 into Asset A in a nontaxable account (and $10,000 into Asset B in a taxable account).
- High Growth Taxable: Invest $10,000 into Asset A in a taxable account (and $10,000 into Asset B in a nontaxable account).
After doing this and waiting 30 years, you can see that putting the high growth asset into the nontaxable account is the way to go (Note: this simulation shows the aggregate account values after all applicable taxes have been paid):
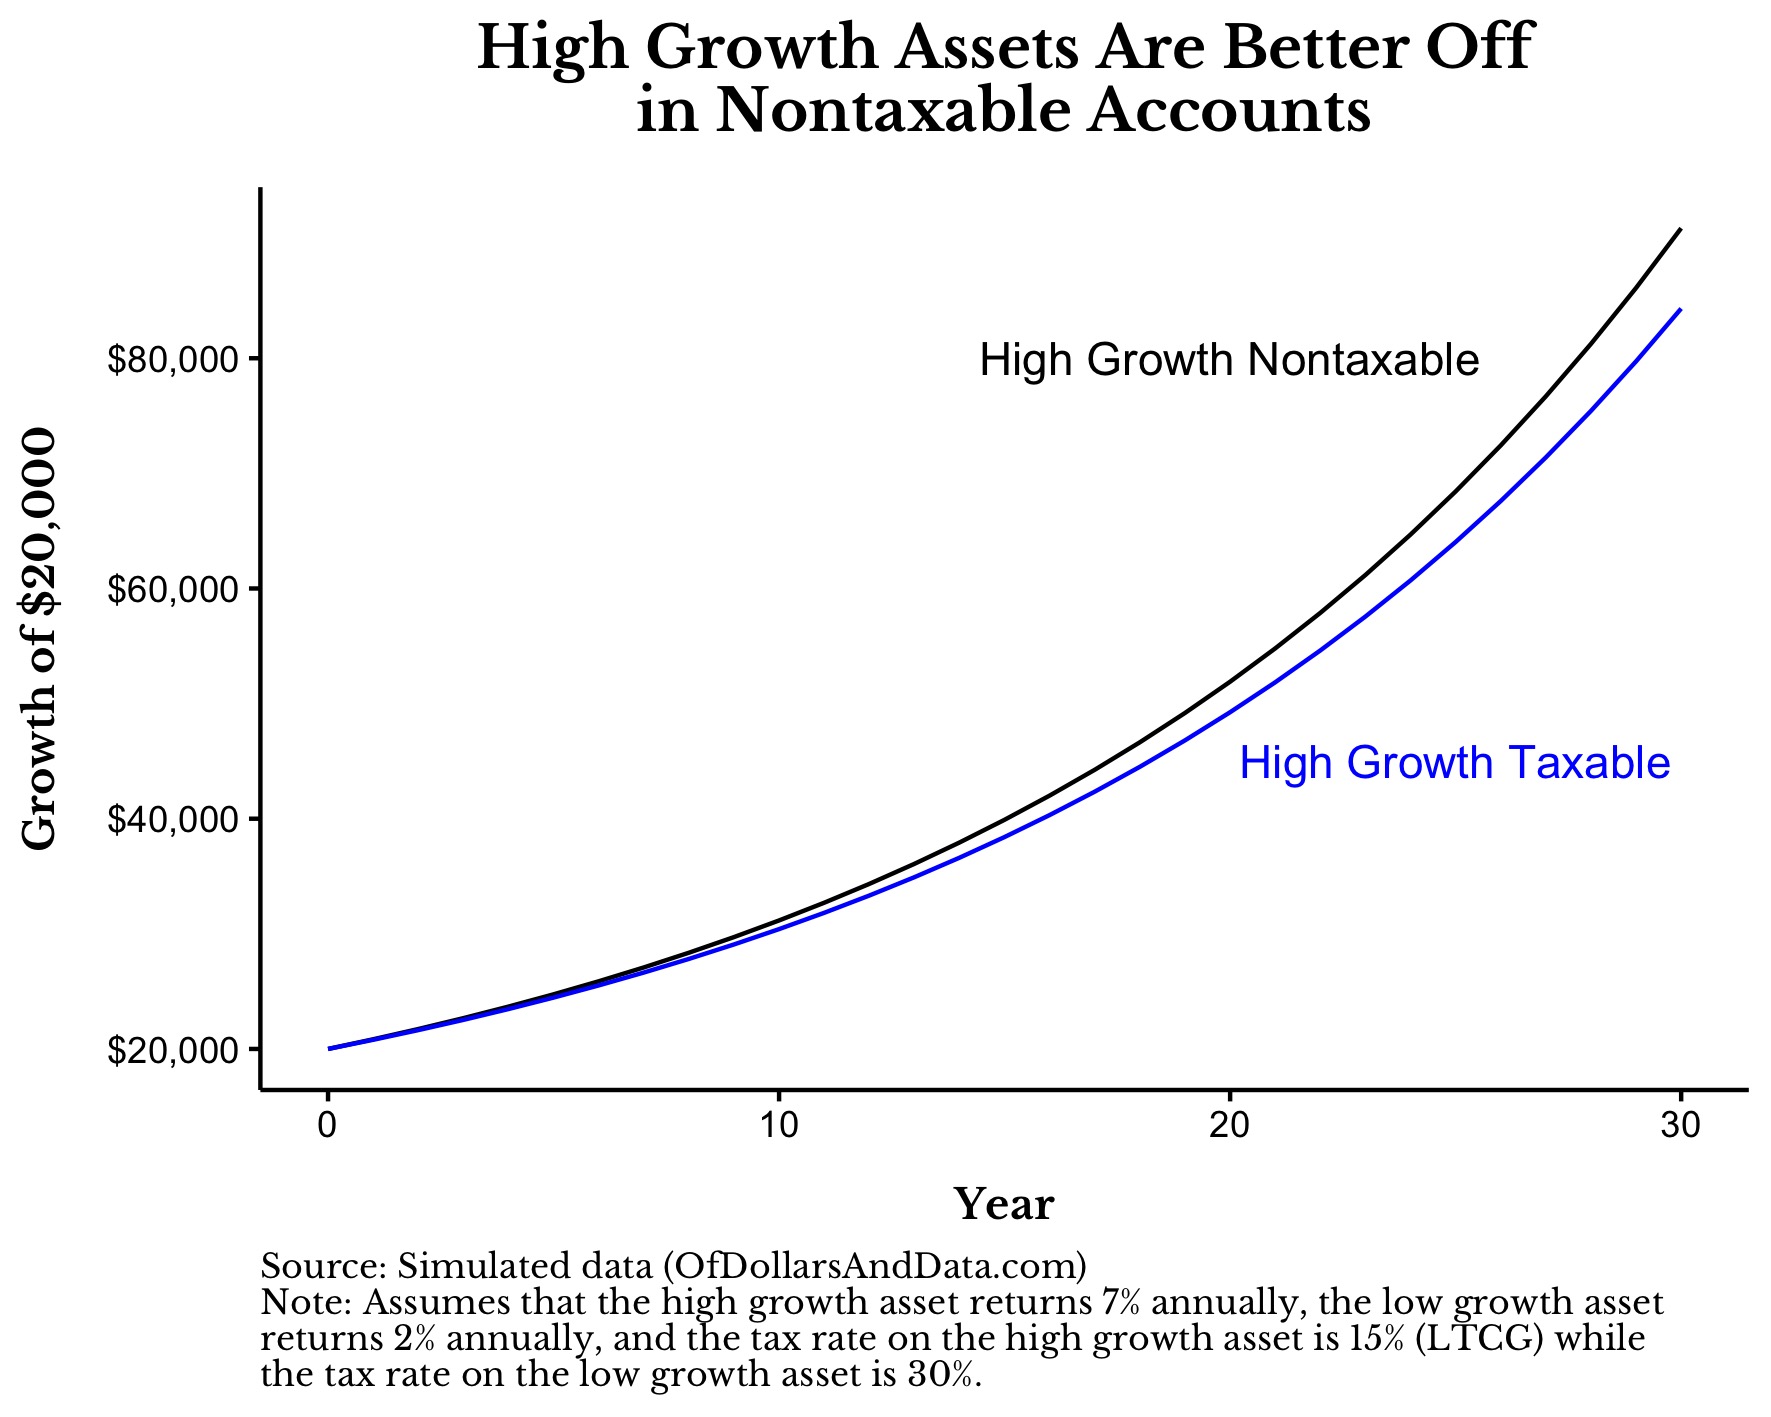
By the end of our 30 years, the “High Growth Nontaxable” strategy has outperformed the “High Growth Taxable” strategy by 8.2% in total or 0.26% annually. I know this annual premium is small, but it also assumes that the high growth asset doesn’t pay any dividends. If it did pay dividends, then placing the high growth asset into the nontaxable account would make even more sense as it would avoid that taxation as well.
Additionally, by placing your high growth (and high risk) assets into a nontaxable account, you may be less tempted to sell them during a market crash because they are harder to access. The other added benefit of this strategy during a market crash is that your low growth assets (bonds) are likely to maintain their value and provide extra liquidity when you need it most.
So, if you need a return boost to meet your financial goals or like the behavioral crutch provided by this strategy, then you might want to consider placing your higher growth (and higher risk) assets in your nontaxable accounts and your lower growth assets in your taxable accounts. This is especially true in today’s market environment.
But remember, a different market environment could dictate a different conclusion. For example, in the simulation above, if the “high” growth asset returned 10% a year and the “low” growth asset returned 6% a year, then there would be basically no benefit to sheltering the higher growth asset from taxes. The optimal solution is always relative to what your assets yield. This is exactly what this academic paper in The Journal of Finance found when they researched this topic:
The investor optimally allocates his entire tax-deferred wealth to the asset with the highest yield (typically taxable bonds)
Unfortunately, with fixed income yields near 0% throughout most of the world, the optimal asset location today is sheltering assets with higher growth.
Now that we have reviewed why higher growth assets belong in tax sheltered accounts, we can discuss the most notable exception to this rule.
What About Rebalancing?
The one thing that I have yet to discuss in this post, the elephant in the room, is portfolio rebalancing. While the math suggests you should put your stocks into your nontaxable accounts and your bonds into your taxable accounts, investing is about more than just math. You have to also consider human behavior. This is where rebalancing comes in.
During most historical periods, rebalancing a U.S. stock/bond portfolio back to its target allocation would have led to lower returns compared to not rebalancing simply because U.S. stocks tend to outperform U.S. bonds. This is especially true over longer periods of time. Because when you rebalance a U.S. stock/bond portfolio, you are typically selling an asset with higher expected returns (U.S. stocks) to purchase one with lower expected returns (U.S. bonds).
But, rebalancing isn’t about returns, but reducing volatility and improving investor behavior. When you take this into account, many investors would be better off by having the same allocation across all of their accounts so that they can rebalance regularly. This is what I do despite it being suboptimal from a tax perspective.
Yes, I will pay more taxes in the long run by having stock funds in my taxable brokerage account, but I do this because I find the idea of rebalancing mentally helpful. This is particularly true during periods of high market turbulence when rebalancing is more likely to provide a long-term return benefit. After successfully navigating the coronavirus crash in 2020 with this setup, I wouldn’t change a thing.
I know how disappointing it can be to read 2,000 words on optimal asset location for me to end things with, “None of that matters if you like to rebalance,” but this is why investing is sometimes more art than science. Nevertheless, I think it’s important to know the optimal solution to a problem even if you choose not to follow it. Sometimes maximizing wealth isn’t the goal.
Either way, I hope this deep dive into asset location has made you re-examine your current strategy. As always, you should consult your tax advisor before you embark on any major investment changes.
Happy investing and thank you for reading!
If you liked this post, consider signing up for my newsletter.
This is post 217. Any code I have related to this post can be found here with the same numbering: https://github.com/nmaggiulli/of-dollars-and-data

