Have you ever wondered what it really means to be rich? Is it a certain salary? A specific amount of assets? A particular lifestyle?
The answer to this question is highly subjective and dependent on individual factors such as your age, your education level, and where you live. For example, someone making $100,000 a year might be considered rich if they are 18 years old, but not if they are 50. Similarly, someone with a college education might feel rich compared to their high school friends, but inadequate around their university peers. Rich will always be a relative term.
Nevertheless, if you’re interested in understanding how your income compares to others in the U.S. (and whether that makes you rich), then you’ve come to the right place. So, how much income do you need to be rich? Let’s find out.
What are the Top 10%, Top 5%, and Top 1% of Incomes?
Since there is no generally accepted definition of what income level is considered rich, I’ve decided to summarize the top 10%, top 5%, and top 1% of household incomes in the U.S. based on the newly released 2022 Survey of Consumer Finances (SCF).
This will give you a high level overview of how much income the highest earning households make so that you can determine for yourself what it means to be rich. But, before we dig in, I want to answer a question you might have:
- Why am I using household income? I am showing household income (and not individual income) because household income is what drives financial competition in our society. When you go to bid on a home, you aren’t just bidding against other individuals—you are bidding against other households. And now that the majority of U.S. households are dual income, you can see why household income is more relevant than individual income when trying to determine who is rich.
With that being said, here are the top 10%, top 5%, and top 1% of household incomes in the United States (in 2022):
- Top 10% = $248,610
- Top 5% = $390,209
- Top 1% = $1,199,812
As you can see, the amount of household income needed to be considered rich is very dependent upon how you define rich. And, depending on how exclusive you want to be, rich could be defined as $250k a year, $400k a year, or even up to $1.1M a year. But this still doesn’t fully answer our question because individual factors such as age can make a big difference. How big of a difference exactly? Let’s find out.
How Does Income Change with Age?
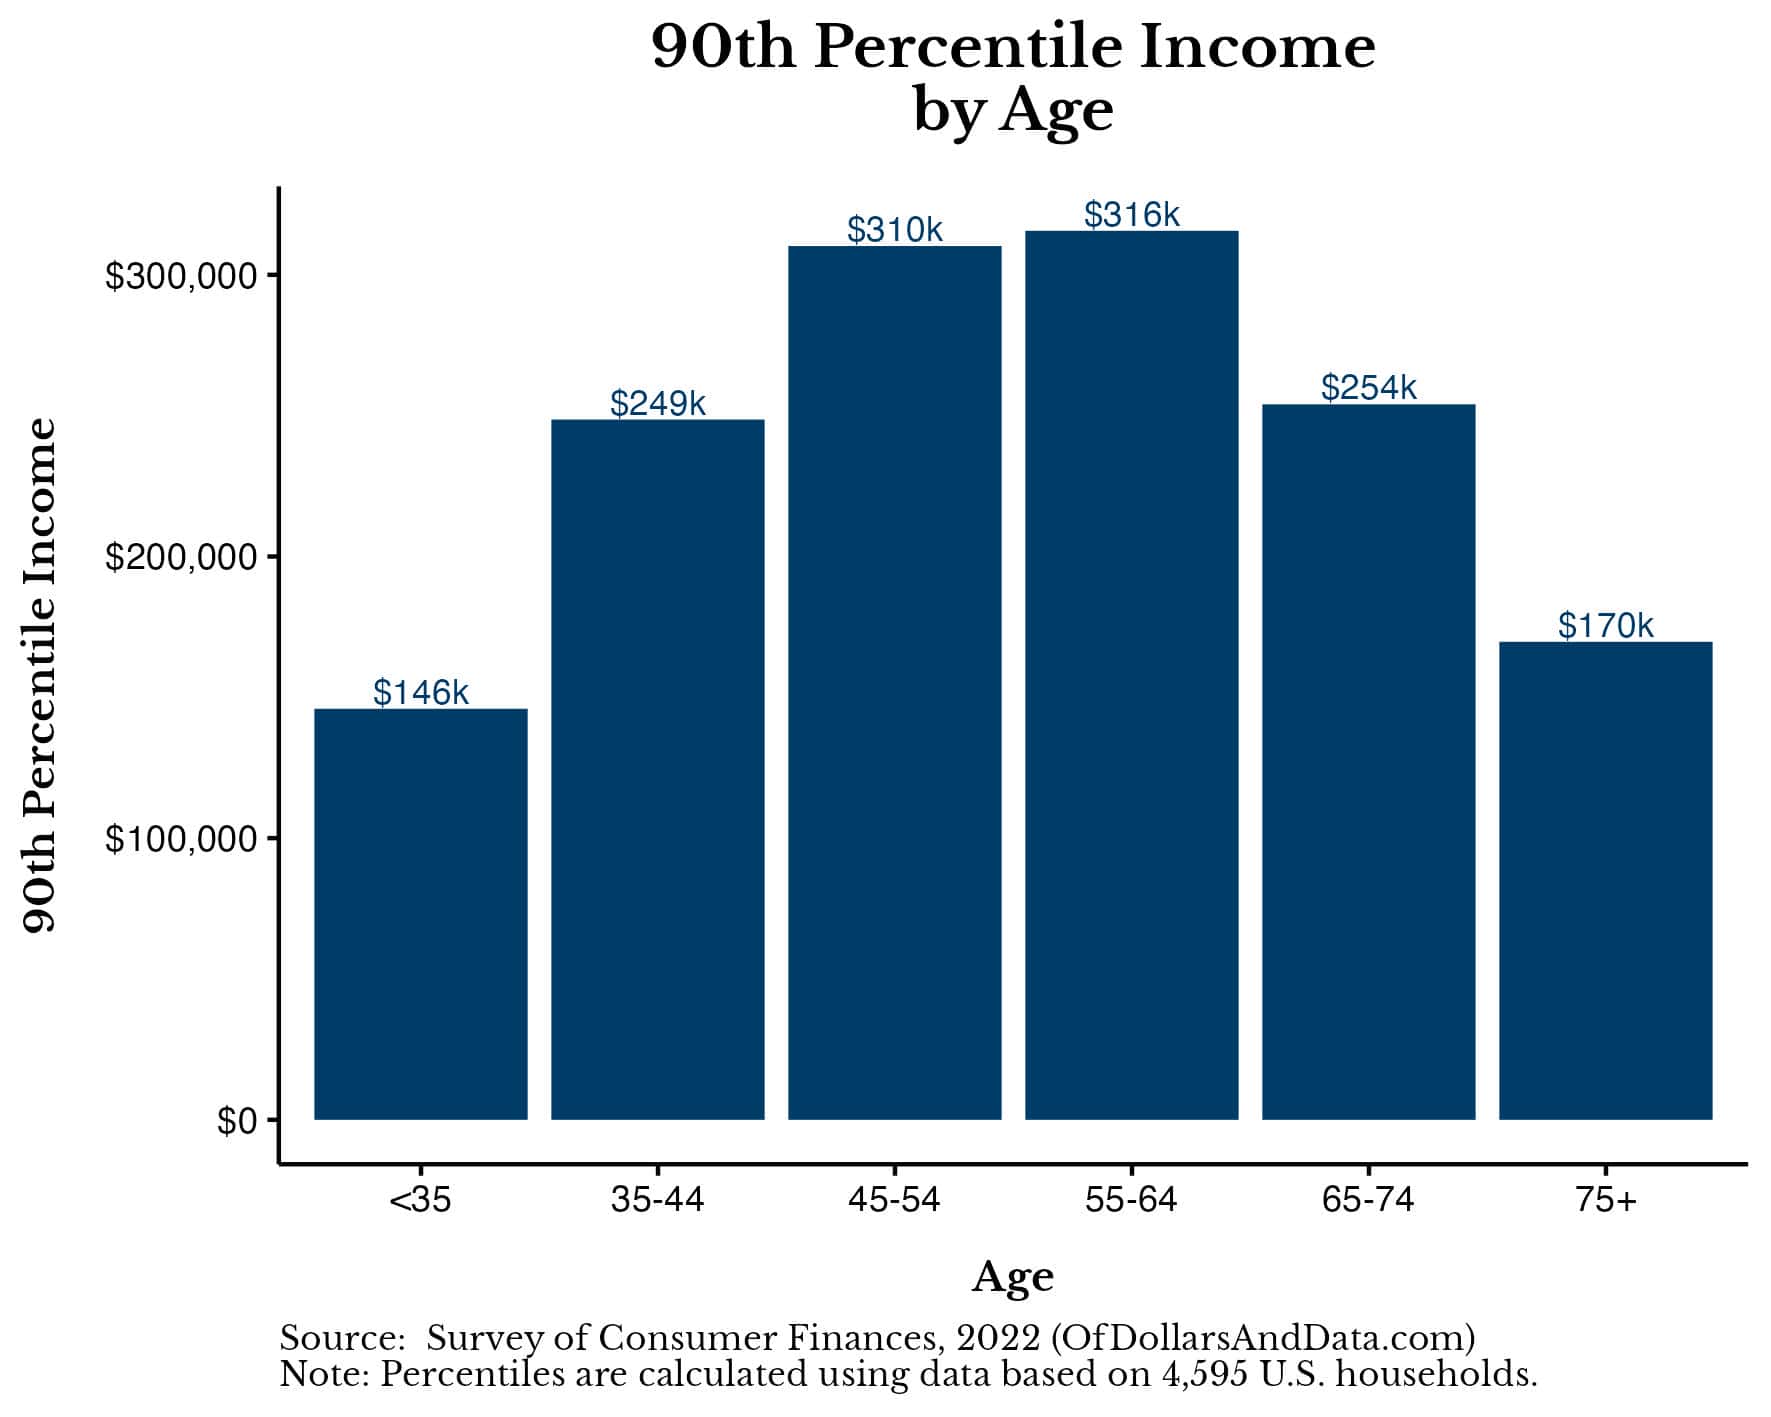
After adjusting for household age, you will see that the income needed to be rich rises into mid-career and then falls once retirement hits (typically in the mid-to-late 60s). Below is a chart showing the 90th percentile (i.e. top 10%) of household incomes in the U.S. across different age ranges:
This same general pattern can also be found within the top 5% of earners and the top 1% of earners (as seen in the chart below):
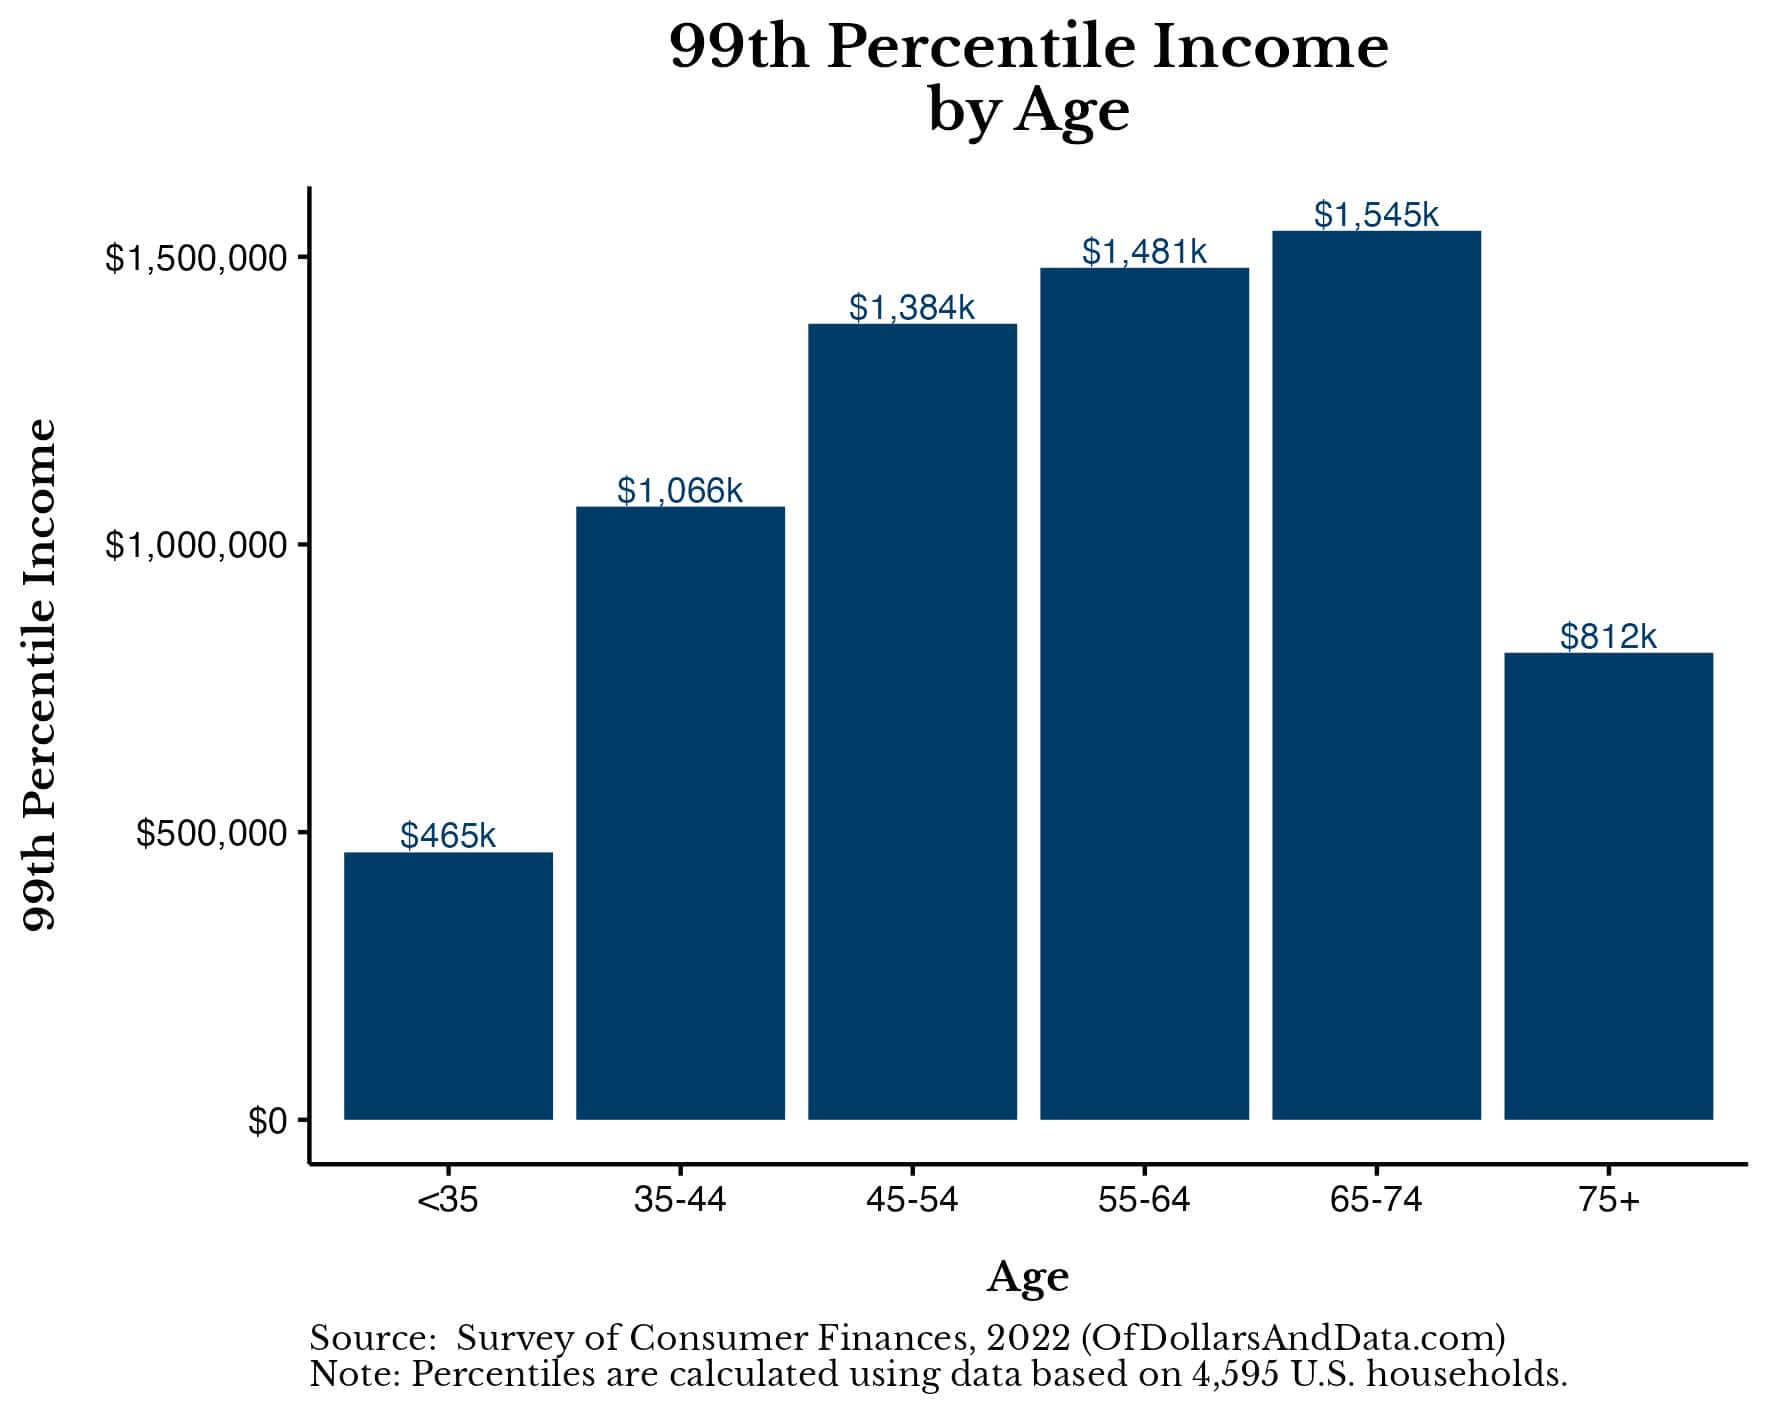
At the 99th percentile, the impact of age is particular strong given the wide range of incomes needed to make it to the top 1%. You could need as little as $465,000 a year or as much as $1.5M to be in the top 1%, depending on your household’s age.
To make it easier to compare the top 10%, top 5%, and top 1% of household incomes across different age groups, I have summarized the data in the table below:
| Age Range | Top 10% | Top 5% | Top 1% |
|---|---|---|---|
| 20-24 | $64,855 | $86,473 | $129,709 |
| 25-29 | $142,680 | $210,778 | $303,736 |
| 30-34 | $188,079 | $276,713 | $468,035 |
| 35-39 | $230,234 | $370,753 | $1,048,484 |
| 40-44 | $271,309 | $446,417 | $1,065,779 |
| 45-49 | $301,574 | $382,643 | $1,167,385 |
| 50-54 | $324,274 | $611,796 | $1,869,977 |
| 55-59 | $359,944 | $546,941 | $1,318,712 |
| 60-64 | $276,713 | $497,219 | $1,772,695 |
| 65-69 | $263,742 | $495,058 | $1,837,550 |
| 70-74 | $245,367 | $387,615 | $1,294,608 |
| 75-80 | $191,321 | $334,002 | $811,765 |
From this table you can get a much better idea of what is considered rich over time and where earnings tend to peak. In particular, the peak earnings for different income cutoffs are approximately:
- Top 10% peak earnings = $360,000
- Top 5% peak earnings = $610,000
- Top 1% peak earnings = $1.87M
To go from the top 10% to the top 5%, your household would need to bring in an additional $250,000 in income at its peak. However, to go from the top 5% to the top 1%, your household’s peak earnings would need to be over $1M higher!
This illustrates not only the divergence between the top 10%, top 5%, and top 1% of household incomes, but also how that divergence changes over time. In other words, getting into the top 1% is hard, but staying in the top 1% is even harder.
If you want to dig deeper into household income by age, I recommend trying out this income by age calculator I created for this purpose.
Now that we have looked at how age impacts earnings power over time, let’s see how education level impacts household income as well.
How Does Income Change with Education Level?
There’s a common belief that someone with a college degree will earn $1M more across their lifetime than someone without a college degree. This equates to an extra $25,000 a year over a 40-year career. Well, as you go higher up the income spectrum, the difference in lifetime income gets even larger. You can see this clearly in the plot below which shows the 90th percentile of household incomes, broken out by education level:
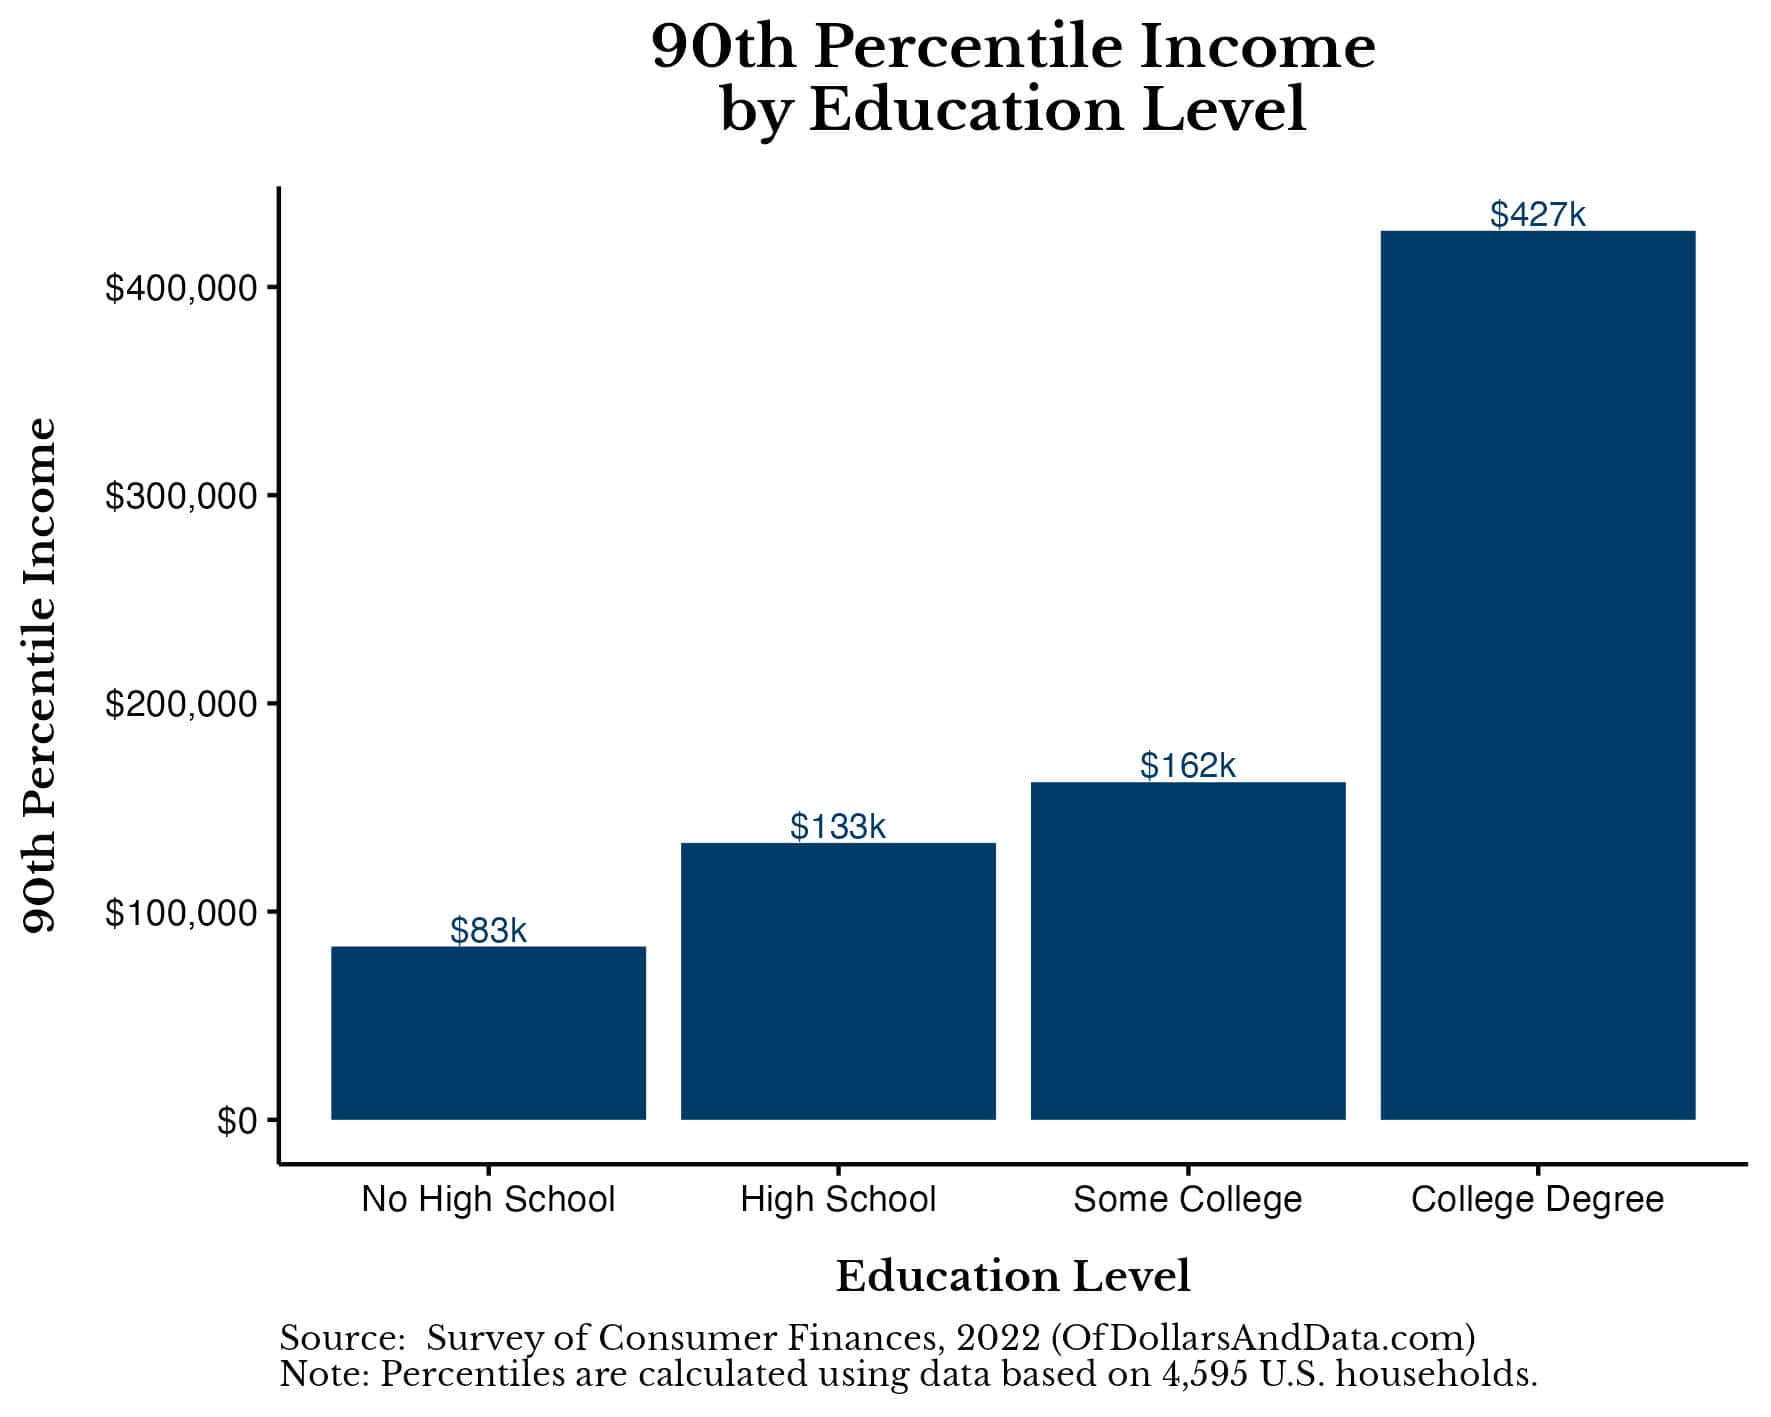
Within the top 10% of households, someone with a high school education earns about $50,000 more per year than someone who dropped out of high school, and someone with a college degree earns about $300,000 more per year than someone with only a high school education. This divergence in household income by education level explains why someone earning $250,000 a year with a college degree may not feel rich though their income is in the top 10% of households nationally.
As you go further up the income spectrum, it’s even easier for college-educated households to feel left behind. You can see this in the plot below showing the top 1% of household incomes by education level:
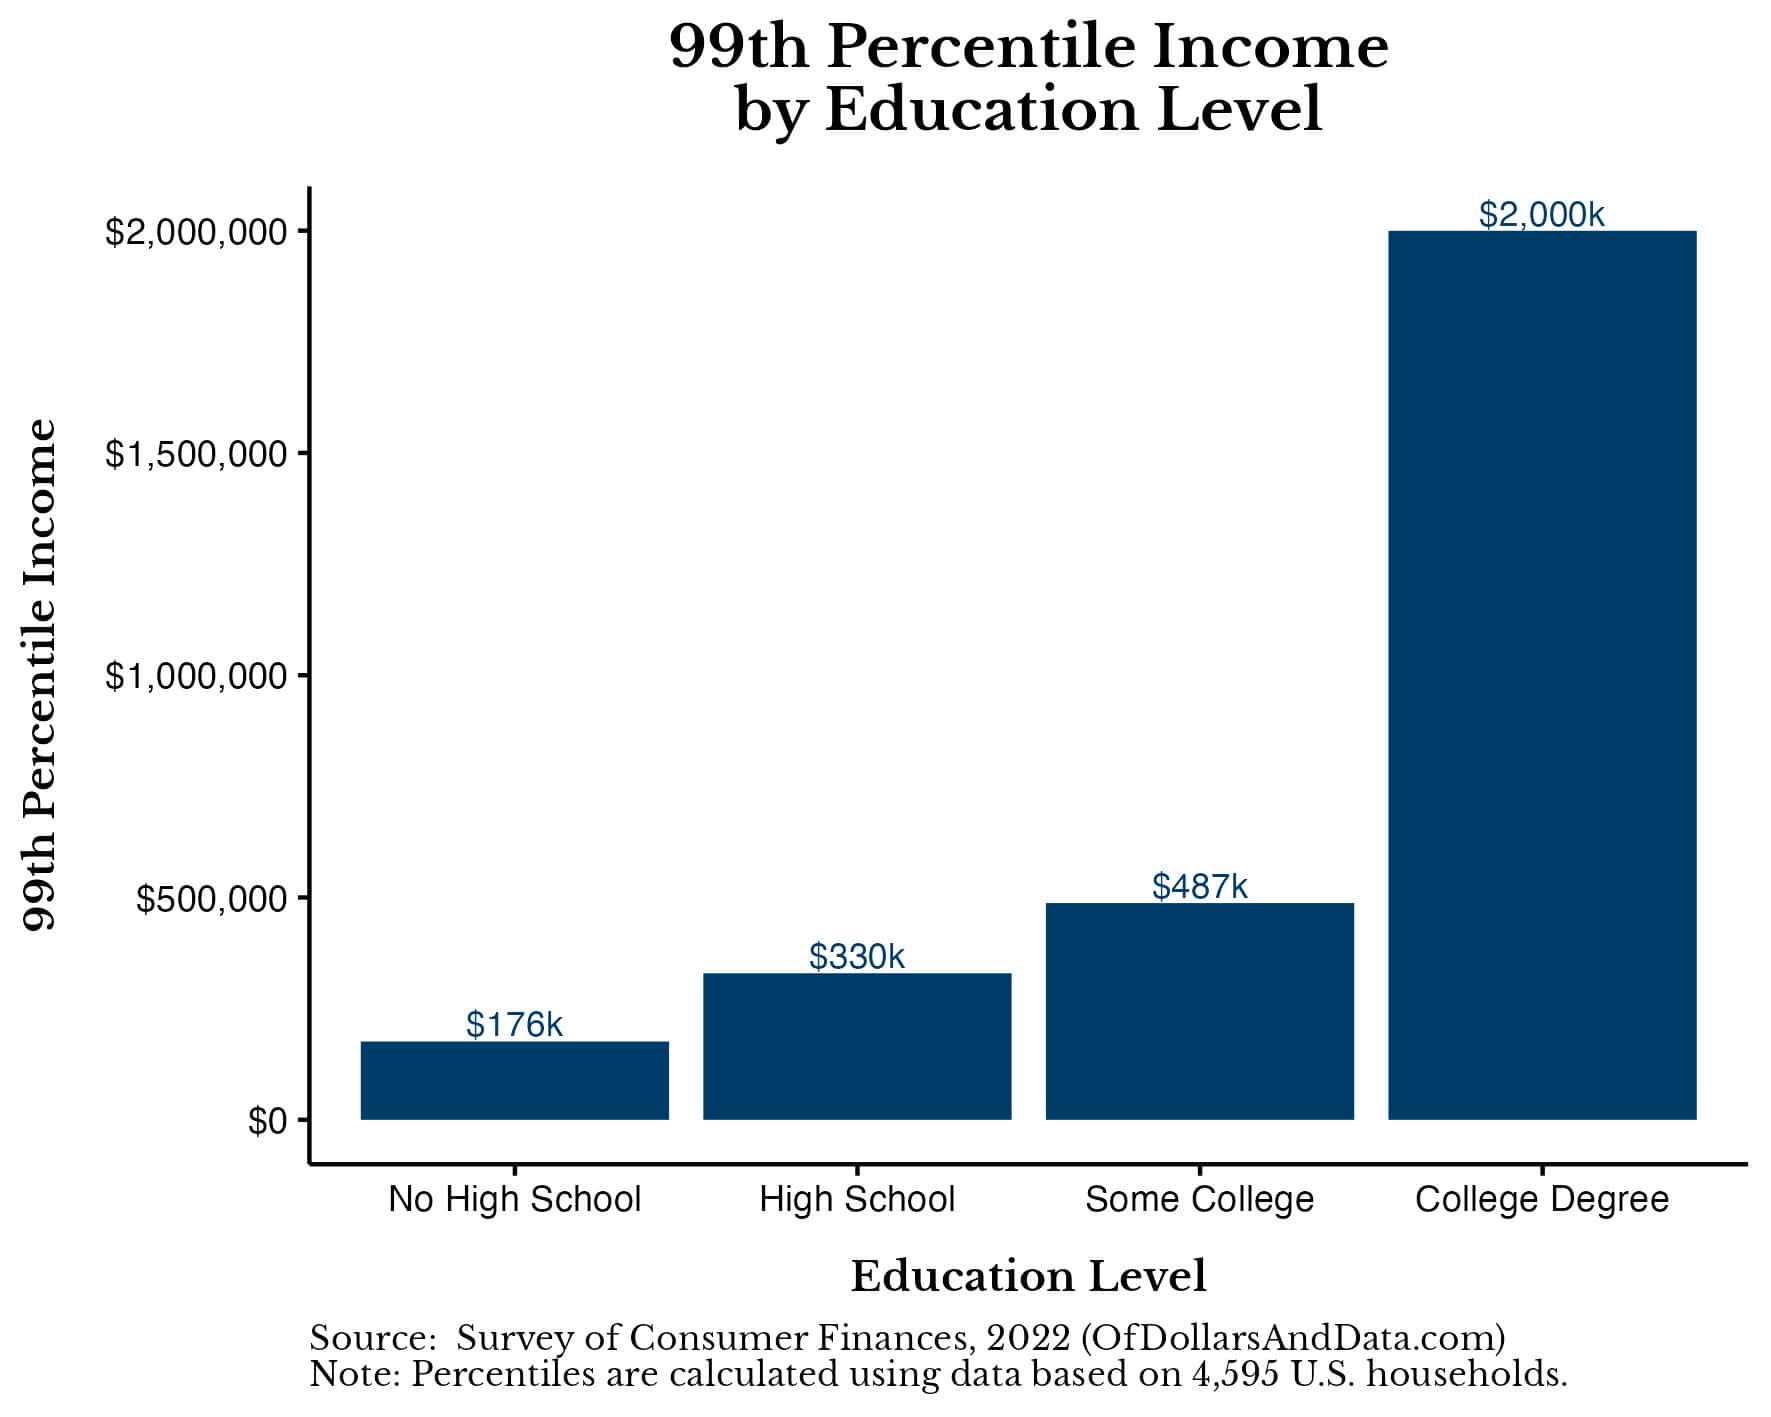
At the 99th percentile, a college-educated household earns over $1.6 million per year more than someone with only a high school education. This difference in income by education level is even greater than the difference in income by age within the top 1% of households. But, after digging a little deeper, I discovered that this wasn’t the full story.
So far we have examined how age and education level affect household income separately. However, when we examine how these two factors impact household income together, a clearer picture emerges.
Why Both Age and Education Level Matter
Given that incomes tend to rise with age and incomes tend to rise with education level, you might also assume that incomes would rise with age within each education level. But you’d be wrong!
Surprisingly, incomes only seem to rise with age within college-educated households. You can see this in the chart below, which shows the top 10% of household incomes broken out by age and education level:
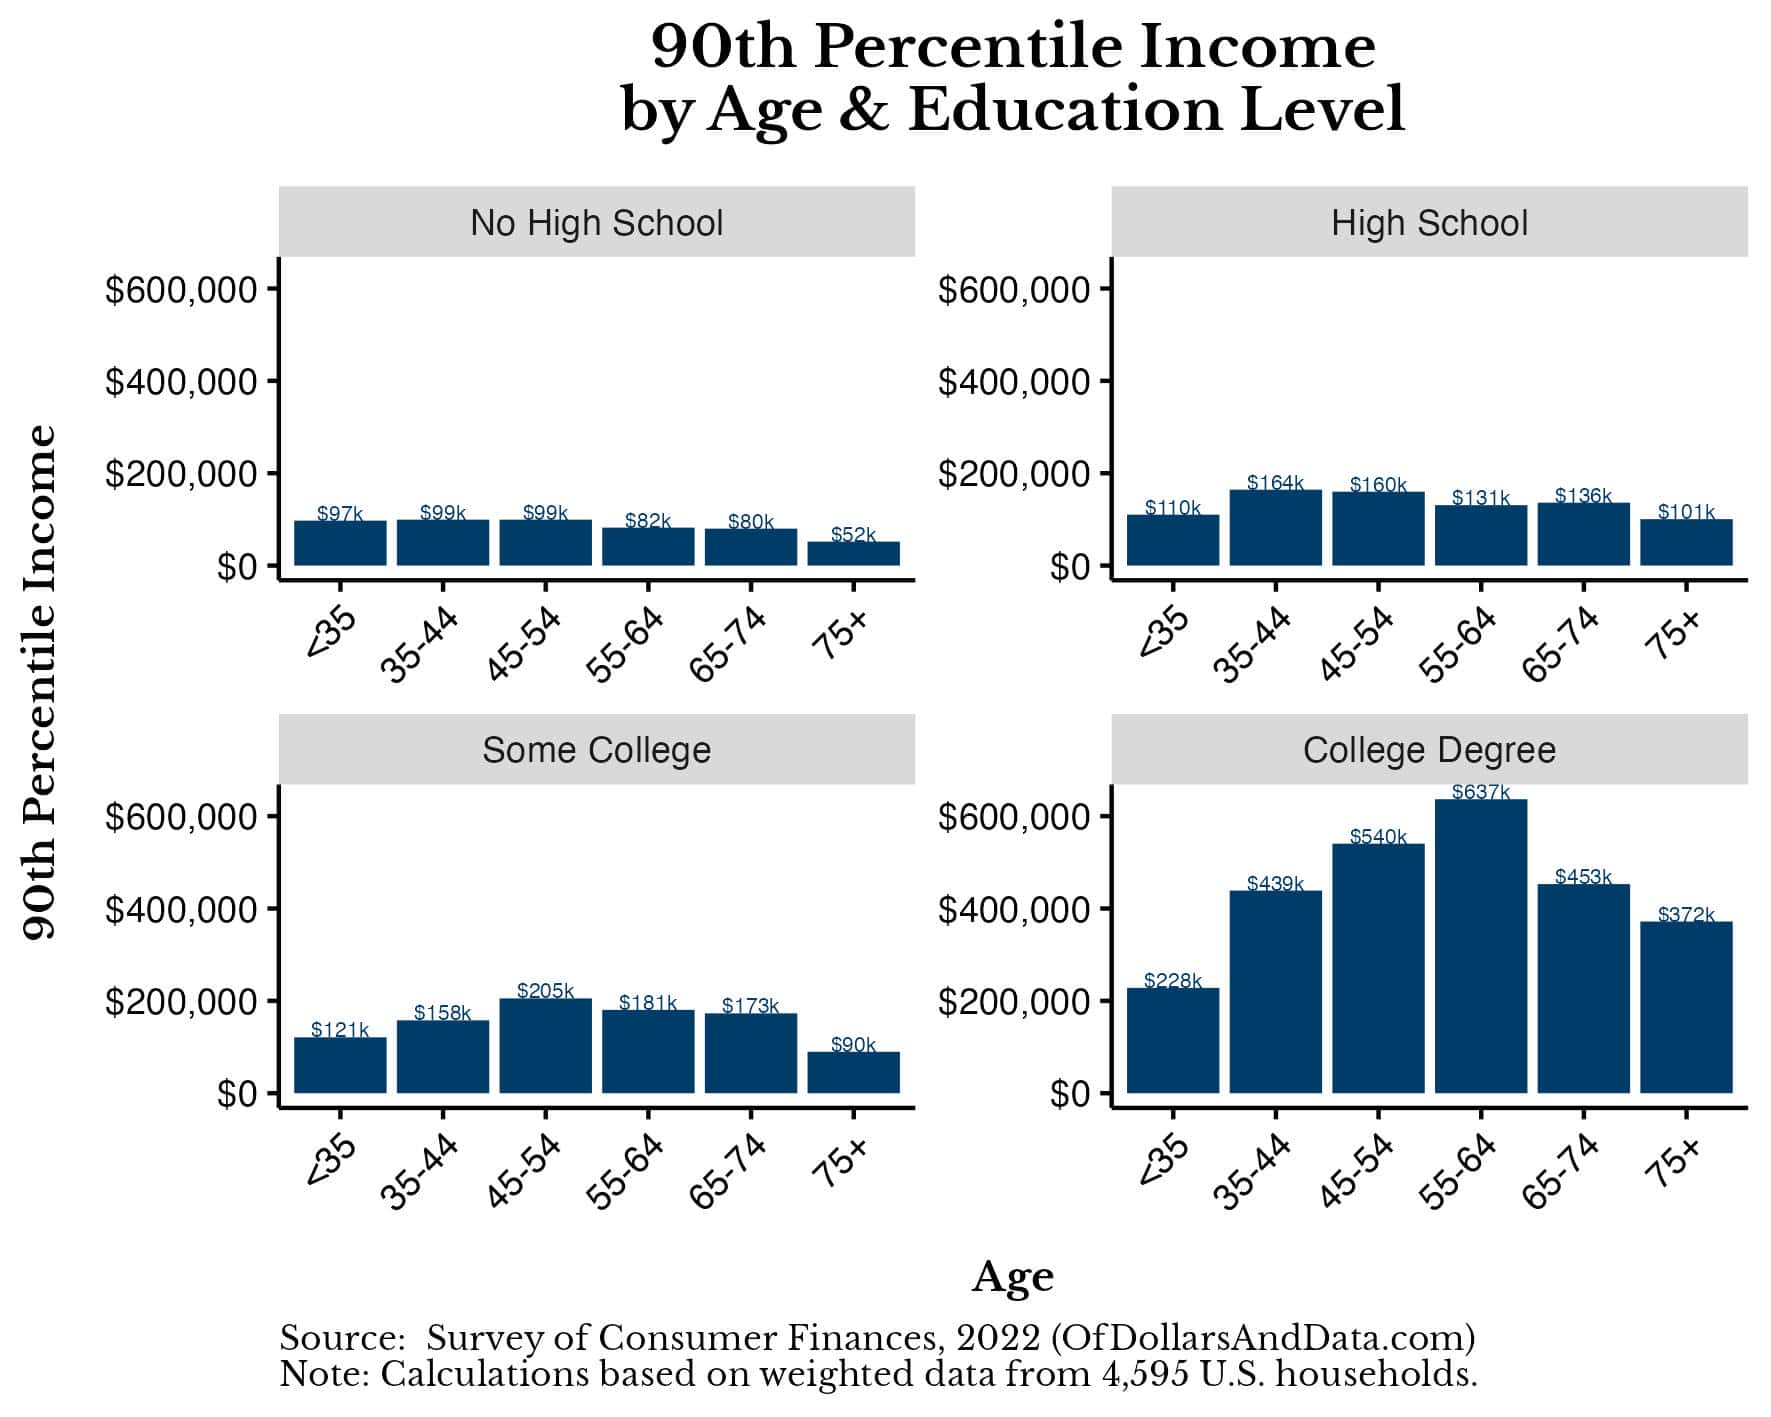
From this chart we can see that the entire relationship between income and age is driven by a subset of the population (i.e. college-educated households). Therefore, our definition of what income is considered rich by age is also biased by this subset of households. This doesn’t imply that we should ignore age altogether, only that we shouldn’t expect older households to have more income than younger households within the same education level.
And this isn’t just an artifact of the highest income households. If we look at the median household income by age and education level, the story is very similar:
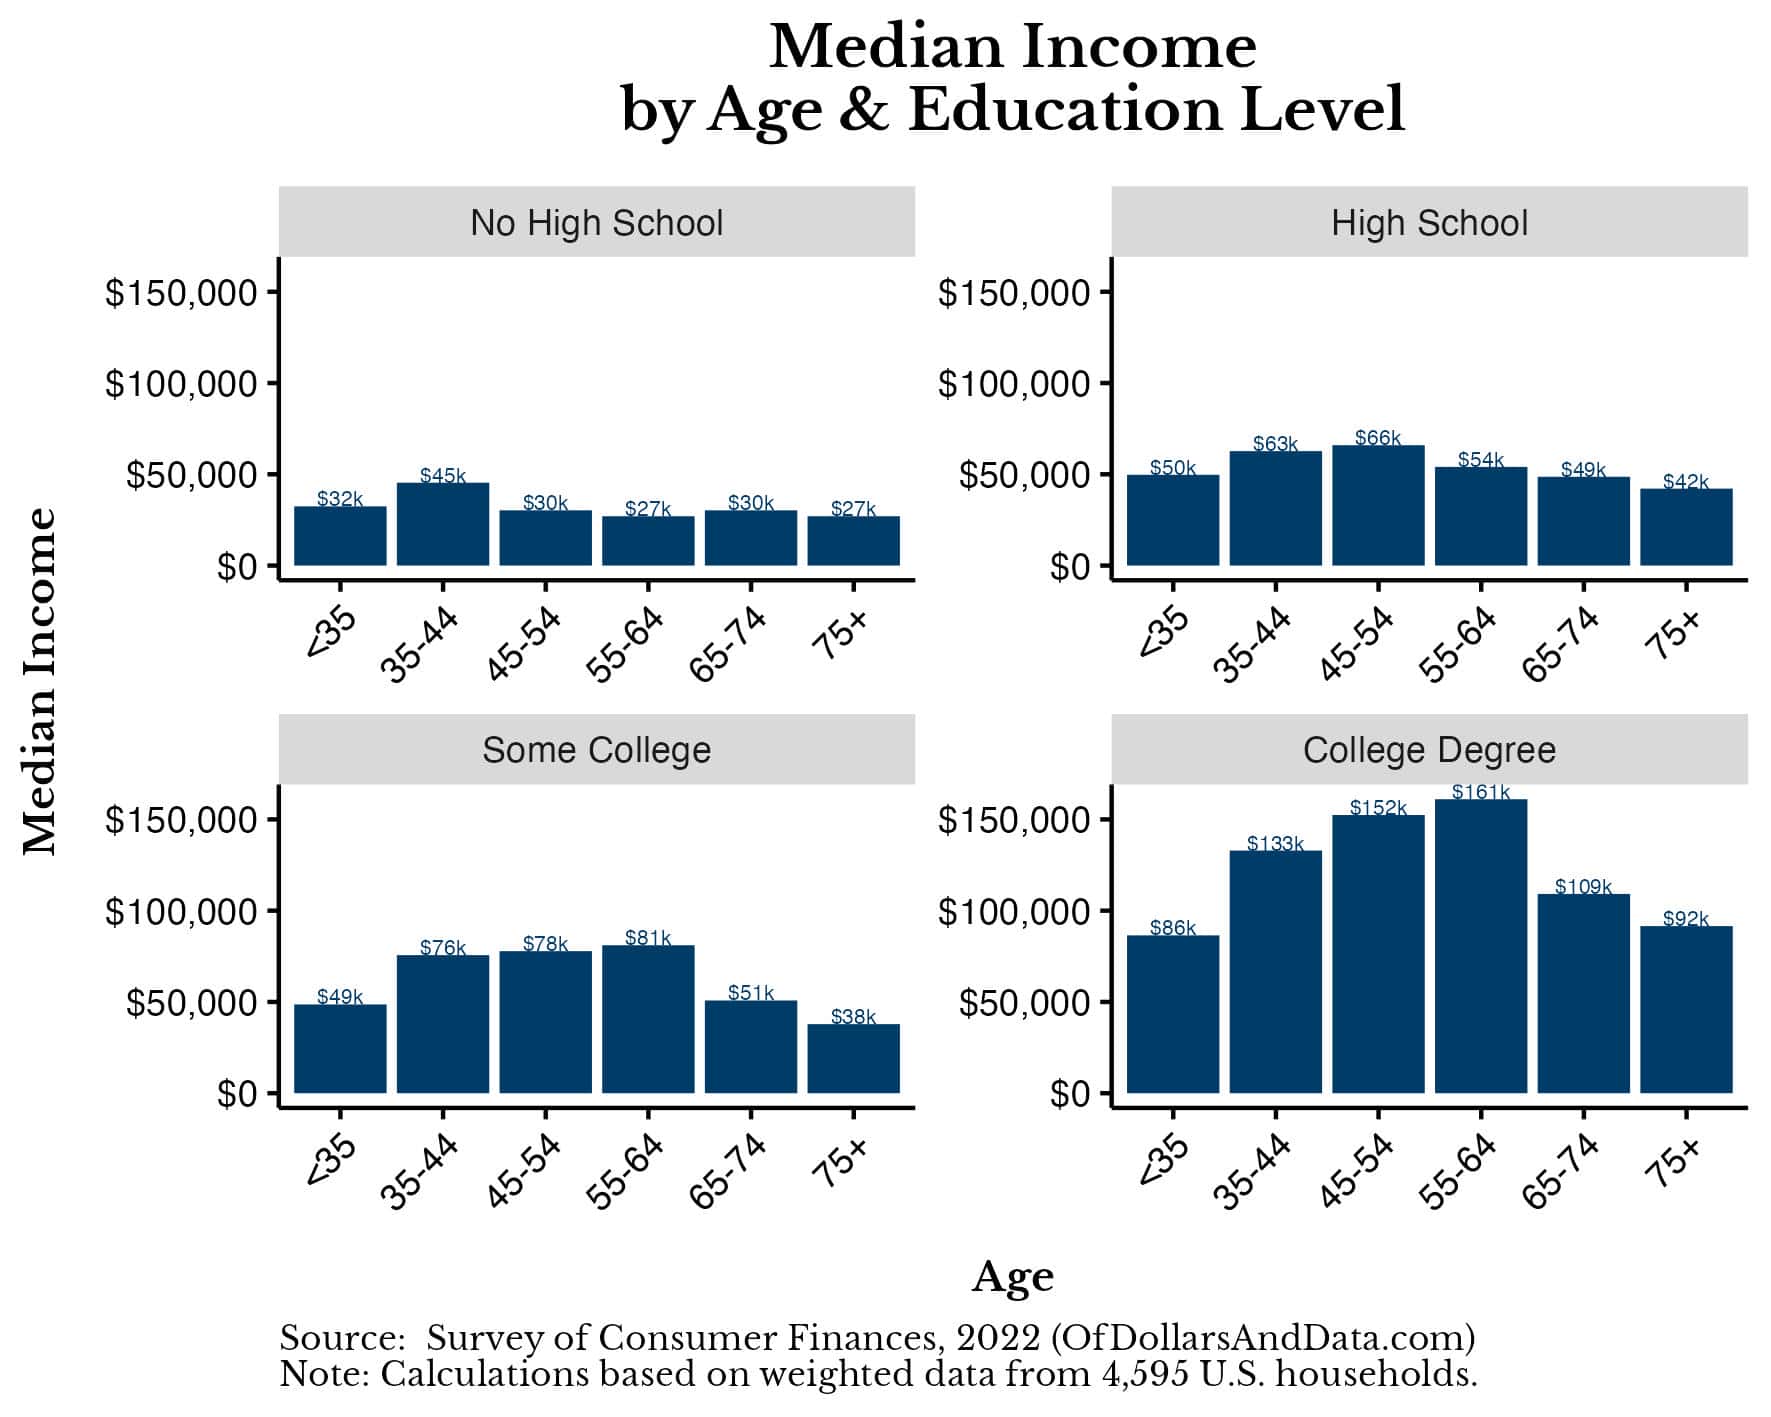
Now that we have looked at the impact of age and education level on income, let’s discuss where you live and why it may not matter for defining who is rich.
Does Where You Live Impact If You are Rich?
When it comes to figuring out how much income you need to be rich, a common response is, “It depends where you live!” After all, someone earning $150,000 in a small town can afford a lot more than someone earning $150,000 in New York City, so they must be richer, right? While this might seem true at first glance, the argument breaks down quite easily.
For example, if you took the median U.S. household and moved them to a third world country, would they be rich? On a relative basis, yes, but on an absolute basis, no. Just because you are the biggest fish in a small pond, doesn’t mean that bigger ponds don’t exist.
But, more importantly, most cost of living comparisons only look at the cost of big, tangible stuff like housing, food, taxes, etc. These things are easy to measure and, therefore, easy to compare. However, they don’t tend to compare things that are less tangible like convenience, our time, or future income opportunities. If they did, then the differences in cost of living would seem less extreme.
For example, if you live in a small town and want to see a Broadway show, you would need to have a car, gasoline, and car insurance. On top of that, you would need to spend a few extra hours driving to and from the venue. Someone living in a big city could simply walk or take public transit to get the same experience as you without all the extra expense or hassle.
You might argue, “But Nick, I don’t care about having access to Broadway shows! I don’t care about not needing a car.” That is completely fine and gets at a much bigger point about what it means to be rich.
Why Being Rich is More Than a Number
So far I have tried to quantify what income level you need to be rich. I’ve tried to give you numbers that you could use to compare yourself to other people. However, in my many years of writing about money, I’ve come to realize something—being rich is more than a number. Being rich is a feeling.
Because even if the numbers say that you are doing well, if you don’t feel rich, then it doesn’t matter. You could be making $10M a year, but if you feel like you need to make $20M, then you will feel poorer than someone making $100,000 who only feels like they need to make $50,000.
We all live our lives relative to our expectations. This is true in our relationships, in our careers, and in our finances. So, if we want to feel rich, we only have two options—earn more or expect less. The choice is yours. Because, ultimately, your income doesn’t determine how rich you are, your desires do.
Thank you for reading!
If you liked this post, consider signing up for my newsletter.
This is post 331. Any code I have related to this post can be found here with the same numbering: https://github.com/nmaggiulli/of-dollars-and-data

