I assumed that by this point in my financial blogging career that I would be done with the topic of market timing forever. Between the many in-depth articles I have read and my own work on the subject (see here, here, and here), I hoped that the issue would no longer be up for debate. But, somehow, pushback still comes in private DMs and conversations I have with readers and friends.
This puzzled me to no end. Why is hoarding cash to “buy dips” such a seductive idea despite the overwhelming evidence against its success? I must be missing something.
And I was missing something. After digging through the data again, I noticed what these cash hoarders were intuitively feeling. They were feeling like they could get a better price. And on most days, they were right.
For example, if you randomly picked a trading day for the Dow Jones Industrial Average since 1970, there is a 95% chance that the market would close lower on some other trading day in the future. This means that only 1 out of every 20 trading days (i.e. ~1 a month) closes at a price that will never be seen again. Only 1 in 20 trading days offers an absolute bargain.
To visualize this, I plotted the Dow (in black) and its absolute lowest future price (“low watermark”) since 1970 (note that the y-axis is a log scale):
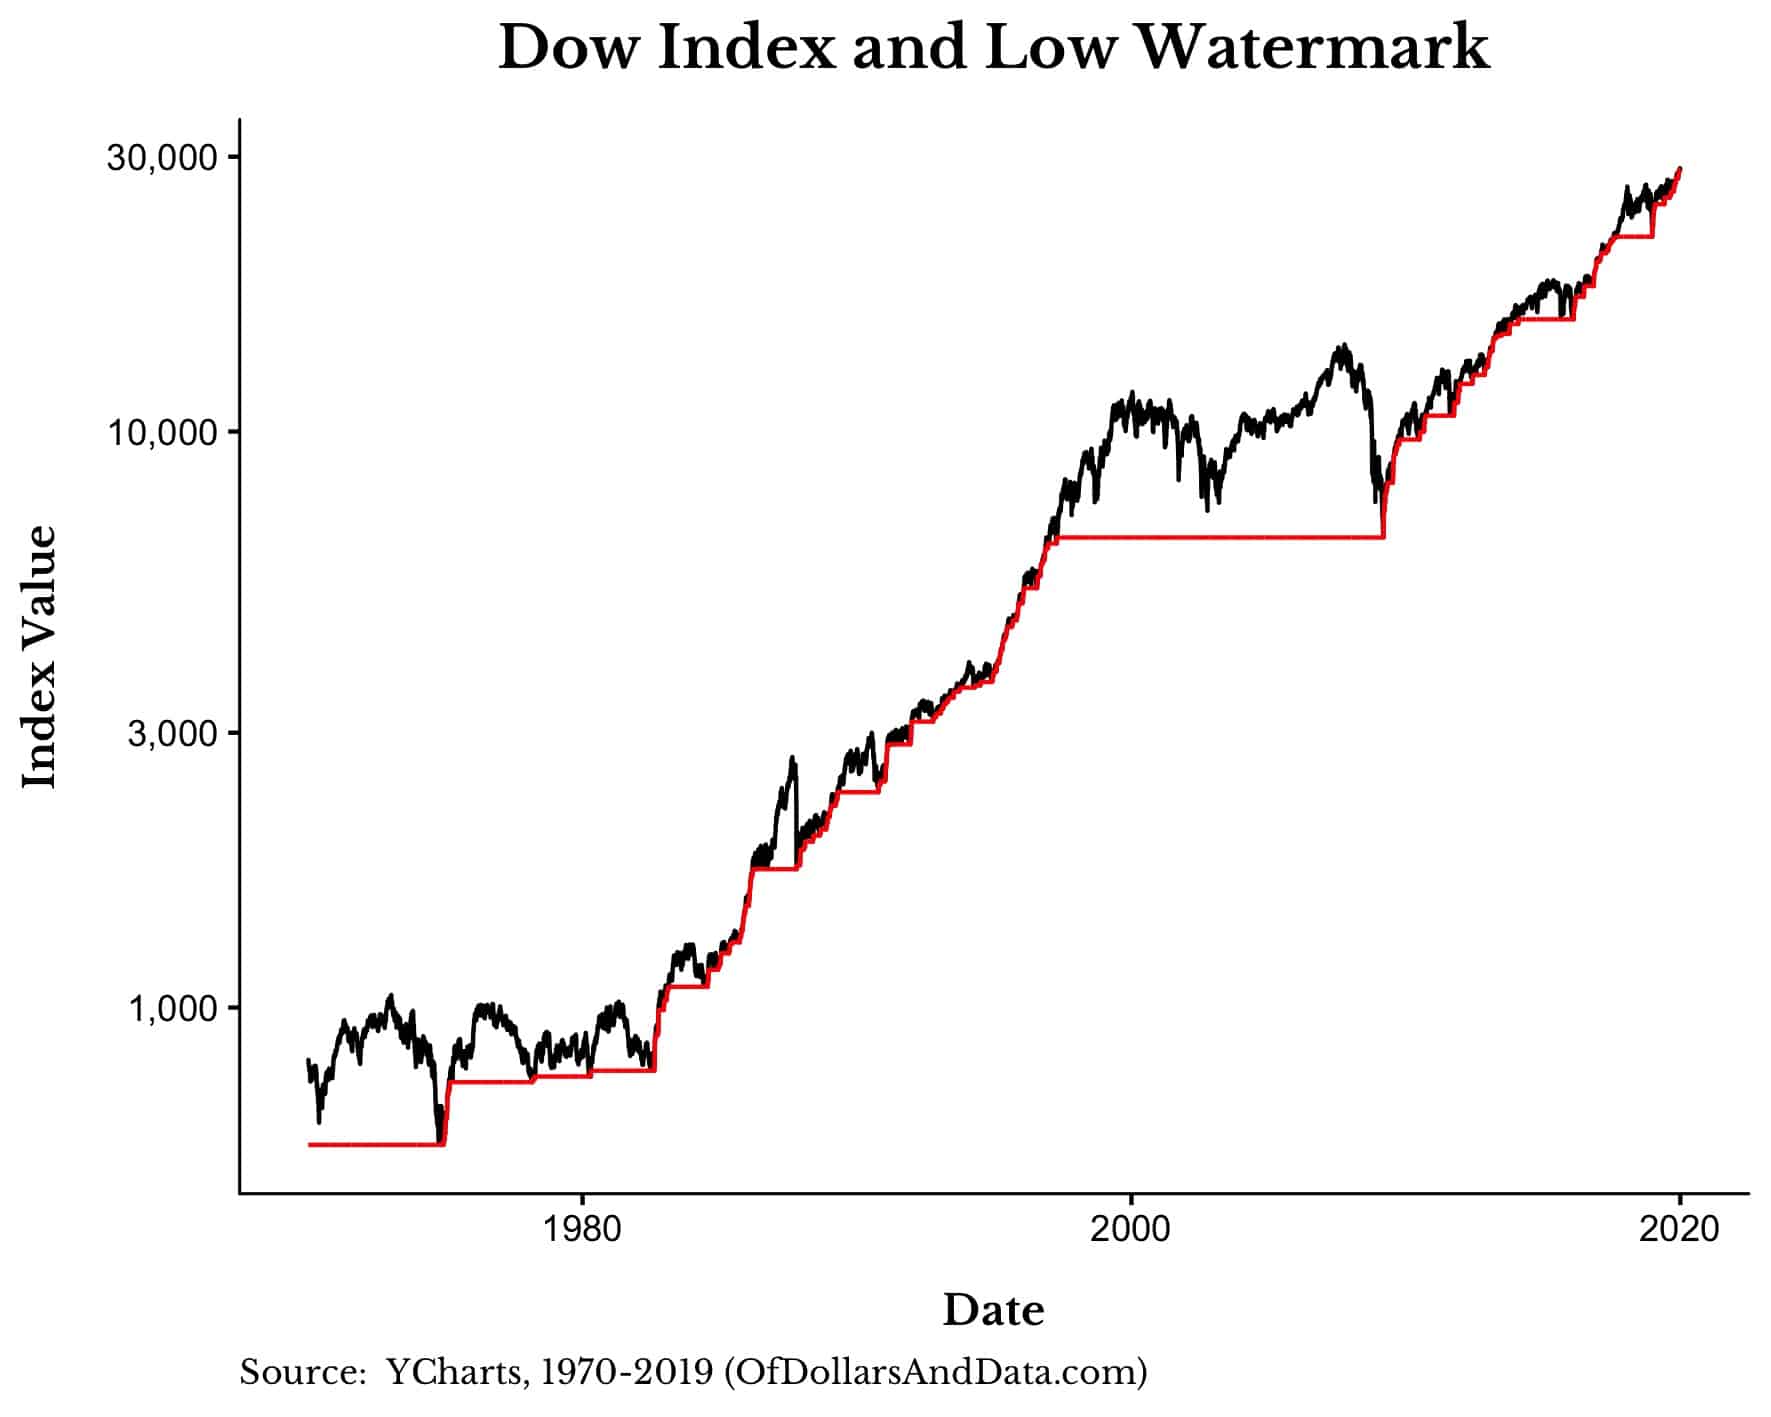
The red line above (“low watermark”) represents the lowest future price that the index will reach from that point going forward.
For example, from April 15, 1997 to March 9, 2009, the low watermark is 6,547. This number represents the bottom reached on March 9, 2009 during the Great Financial Crisis. Any person who bought the Dow after April 15, 1997 but before March 9, 2009 technically could have gotten a better price if they had just waited until March 9, 2009 (assuming they knew the future). Applying this logic to every point in time and you can recreate the red line above.
Lastly, we know that the red line is flat 95% of the time because (as I just said) 95% of trading days will see a lower closing price in the future.
Why is this line important for market timing? Because every time the red line moves vertically, it represents a point at which someone could have gotten the absolute lowest price possible.
How long do you usually have to wait before you would reach the absolute lowest price for any given trading day? The median amount of time before hitting an absolute low is 184 trading days (~9 months), but the average is 508 trading days (~2 years). A few large declines (i.e. 1974 crash, 2008 GFC) skew this average significantly. But this isn’t even the most important question to ask.
The most important question you can ask is: how much better off would you be if you could buy at these absolute bottoms? If you only bought the Dow at the lowest possible price and saved up cash in between purchases, how much would this outperform buying the same amount every month (i.e. dollar-cost averaging/DCA)?
The answer: Buying only at the absolute bottoms from 1970-2019 would outperform DCA by about 22% in total, or 0.4% (40 basis points) annually.
To visualize when the “Absolute Bottom Buying” strategy makes purchases I have taken the above plot and added a blue dot every time this strategy buys into the Dow. In between the blue dots (i.e. the flat red lines), the strategy saves up its excess cash:
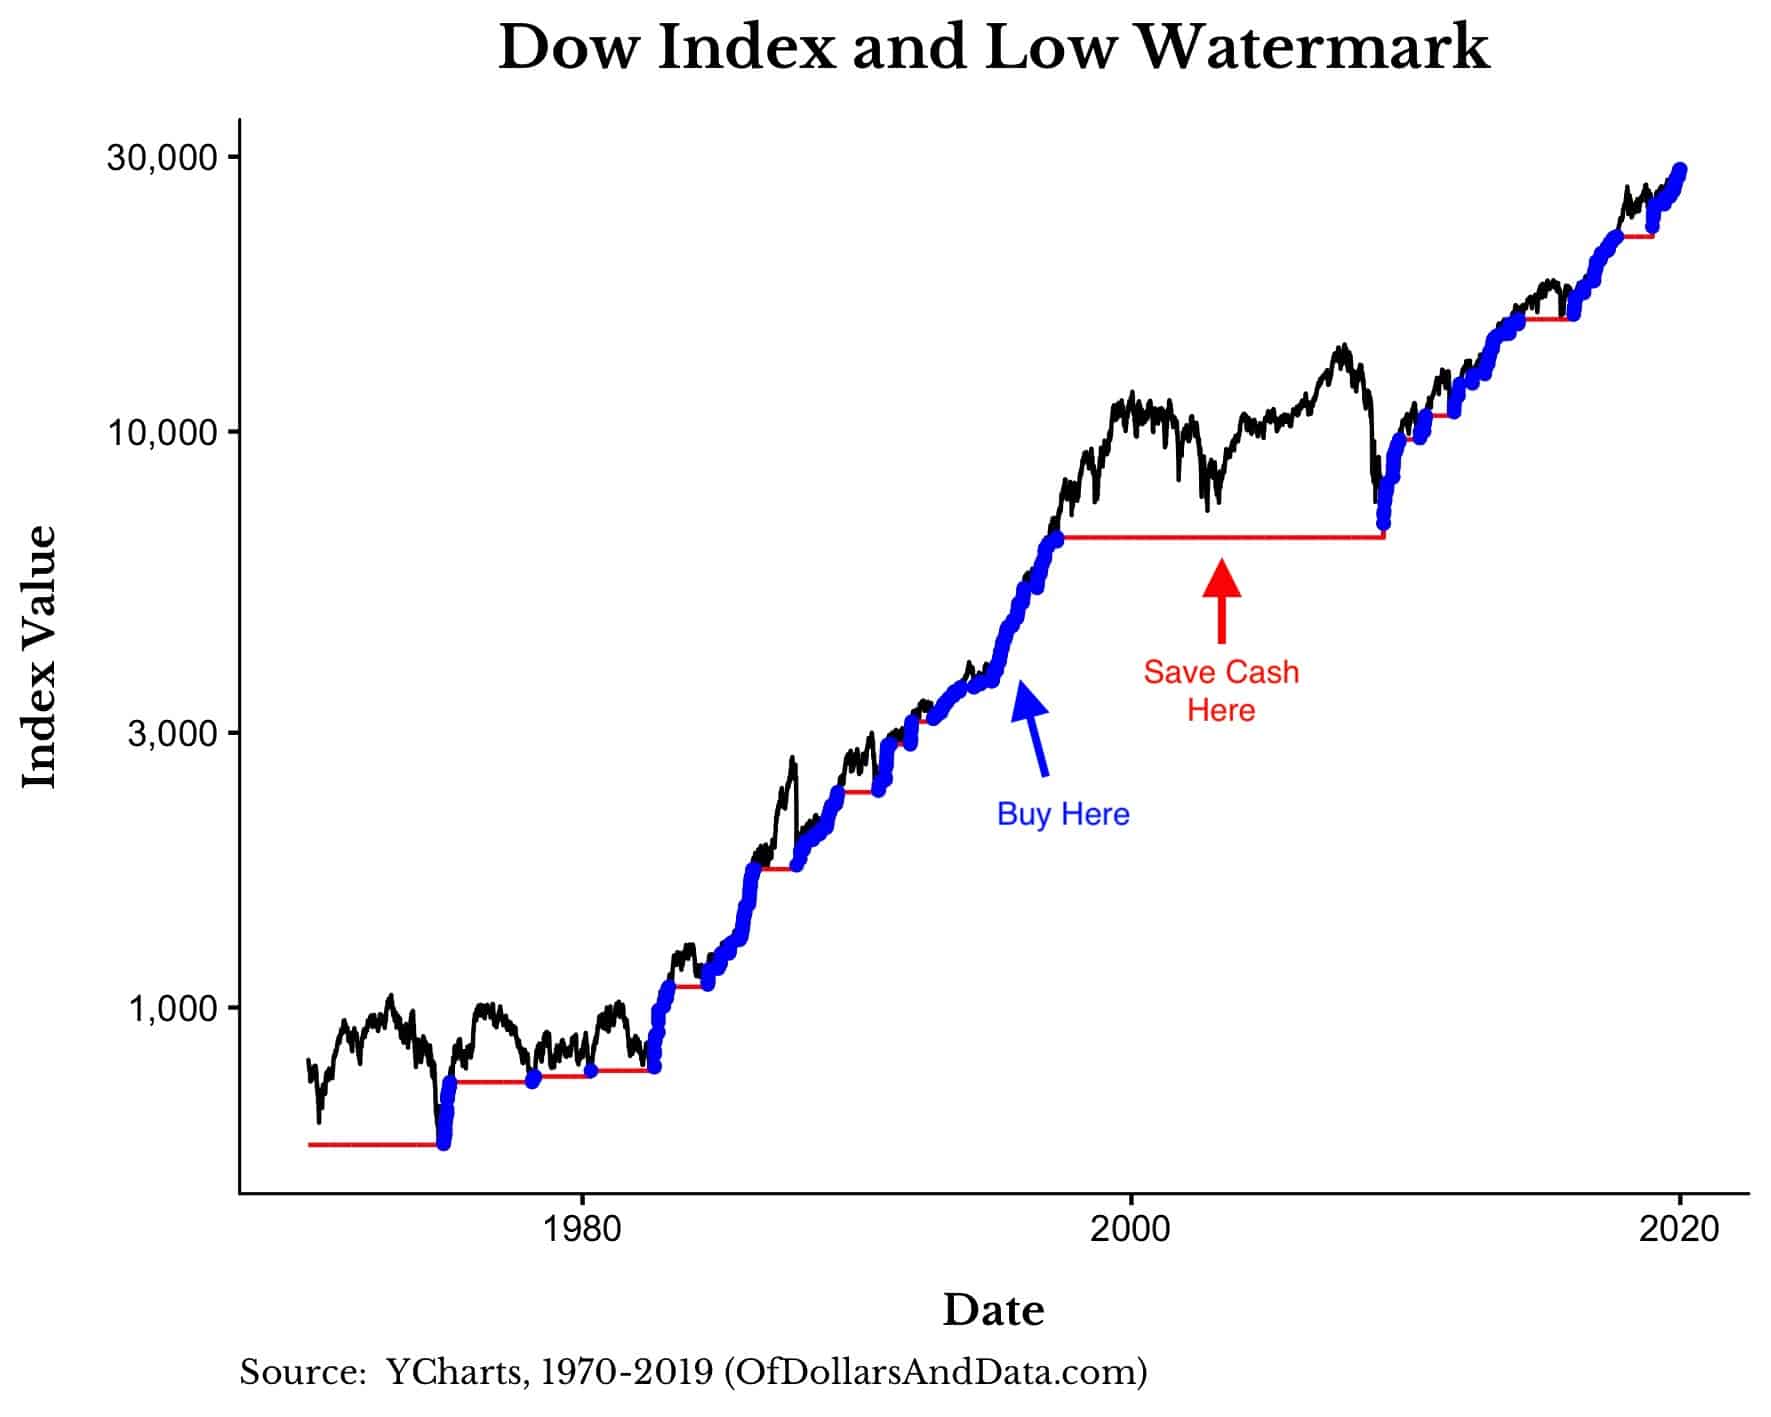
As you can see, this strategy only buys when the market is in some sort of an uptrend and accumulates cash in between (since it “knows” that a lower future price is coming).
But, despite having information about future prices, the “Absolute-Bottom” buying strategy only outperforms by an unimpressive 22% (or 0.4% annually) from 1970-2019 (Note: Both strategies invest the same $12,623 (or $1 per trading day) over the time period shown):
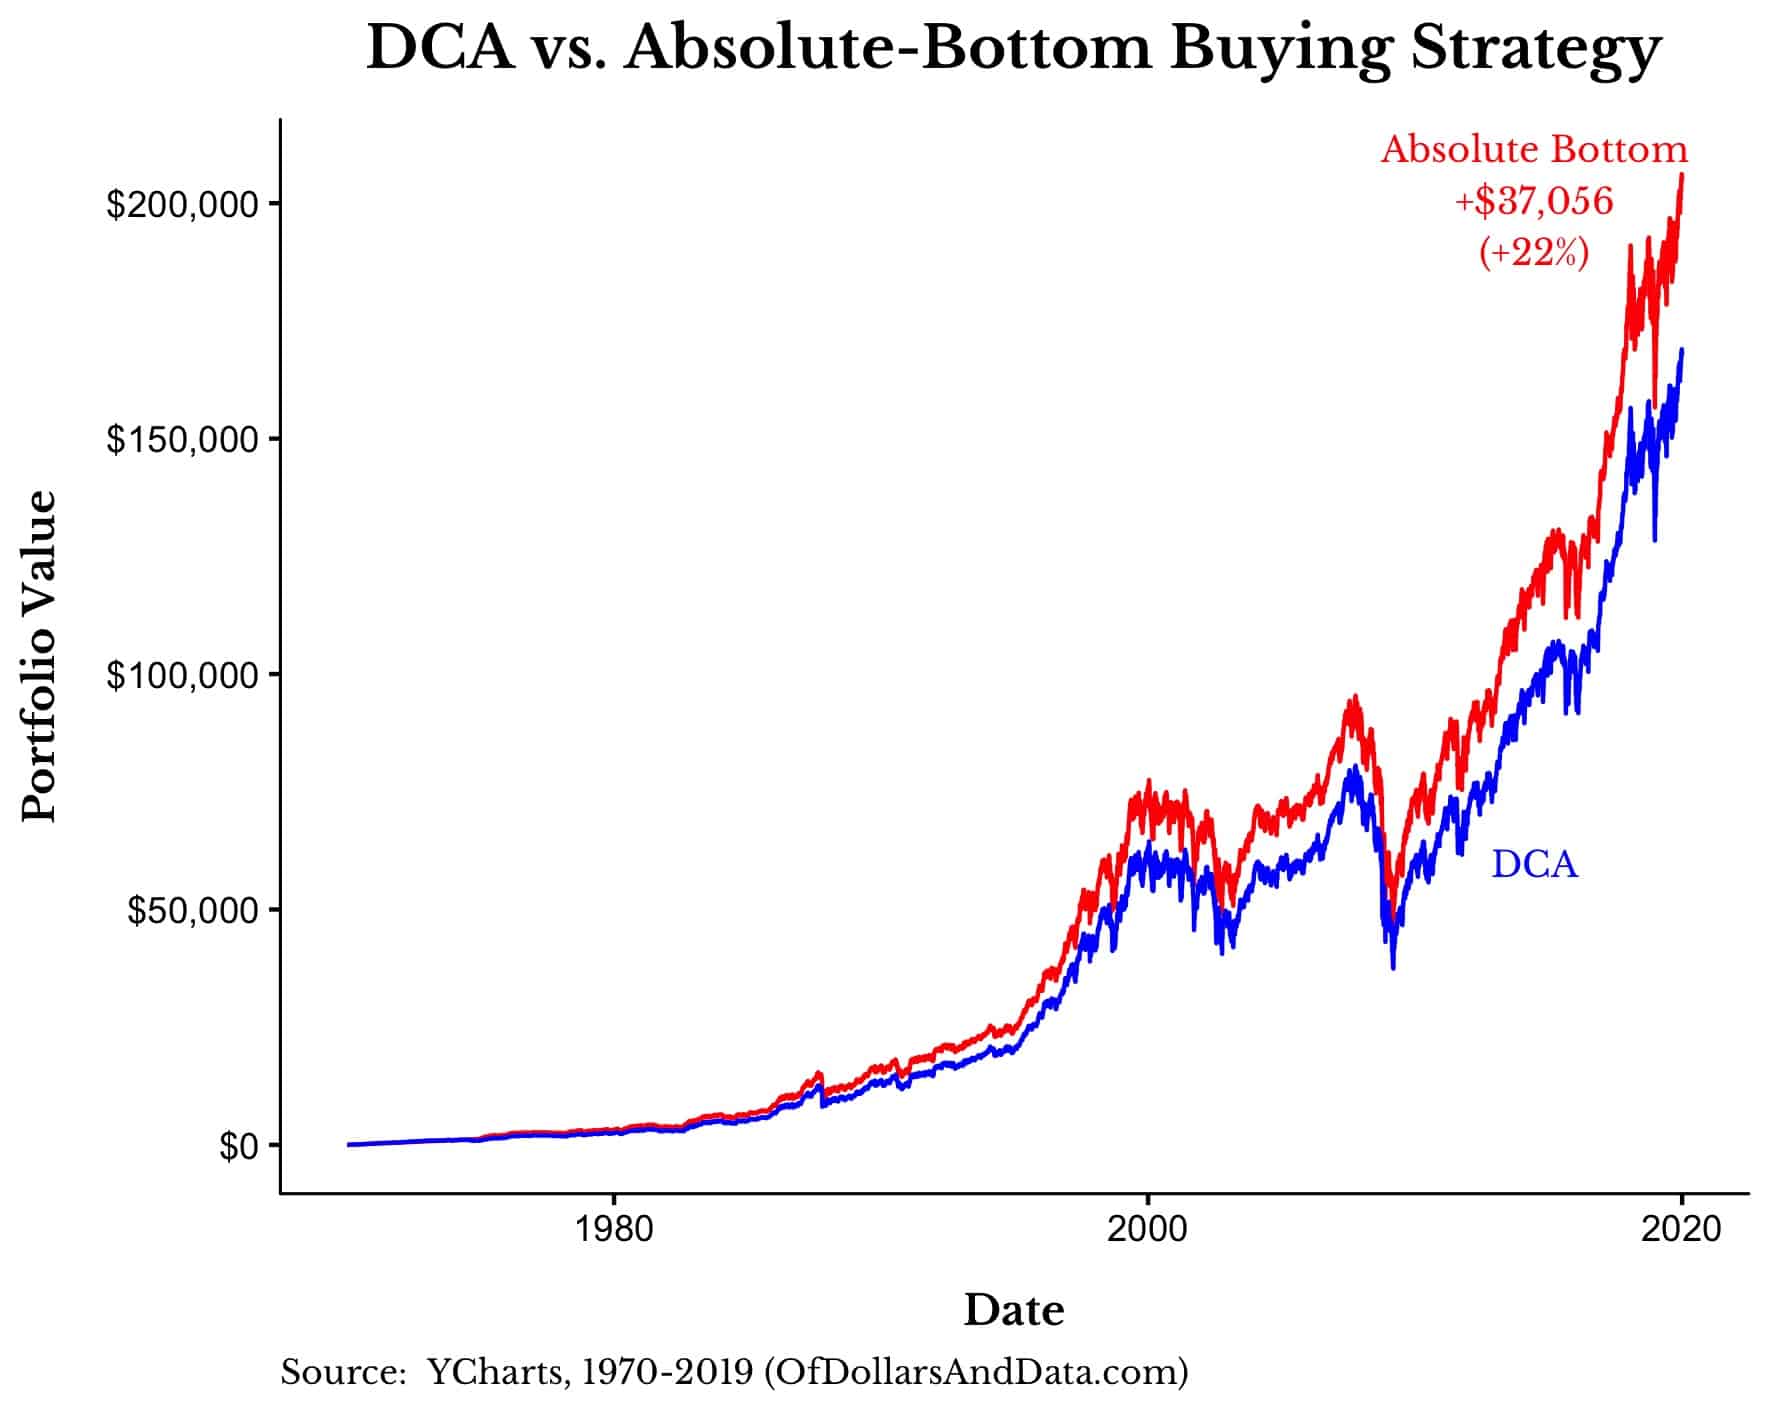
Why is this so unimpressive? Because I would expect a strategy that literally knows the future to outperform by more than 40 basis points (0.4%) a year! The fact that it doesn’t just goes to show how silly the pursuit of market timing can be.
What does this mean for you? It means that you shouldn’t worry about getting the absolute lowest price when making equity purchases. In fact, you are very likely (95% of the time) not going to get the best price when you buy into the market.
But the good news is that this won’t matter all that much in the long run. Why? Because, for markets with a long-term positive trend, the timing decisions you make with your excess cash won’t be that important.
To illustrate this we only need to look at the average purchase prices for the Absolute-Bottom Buying strategy versus DCA over time:
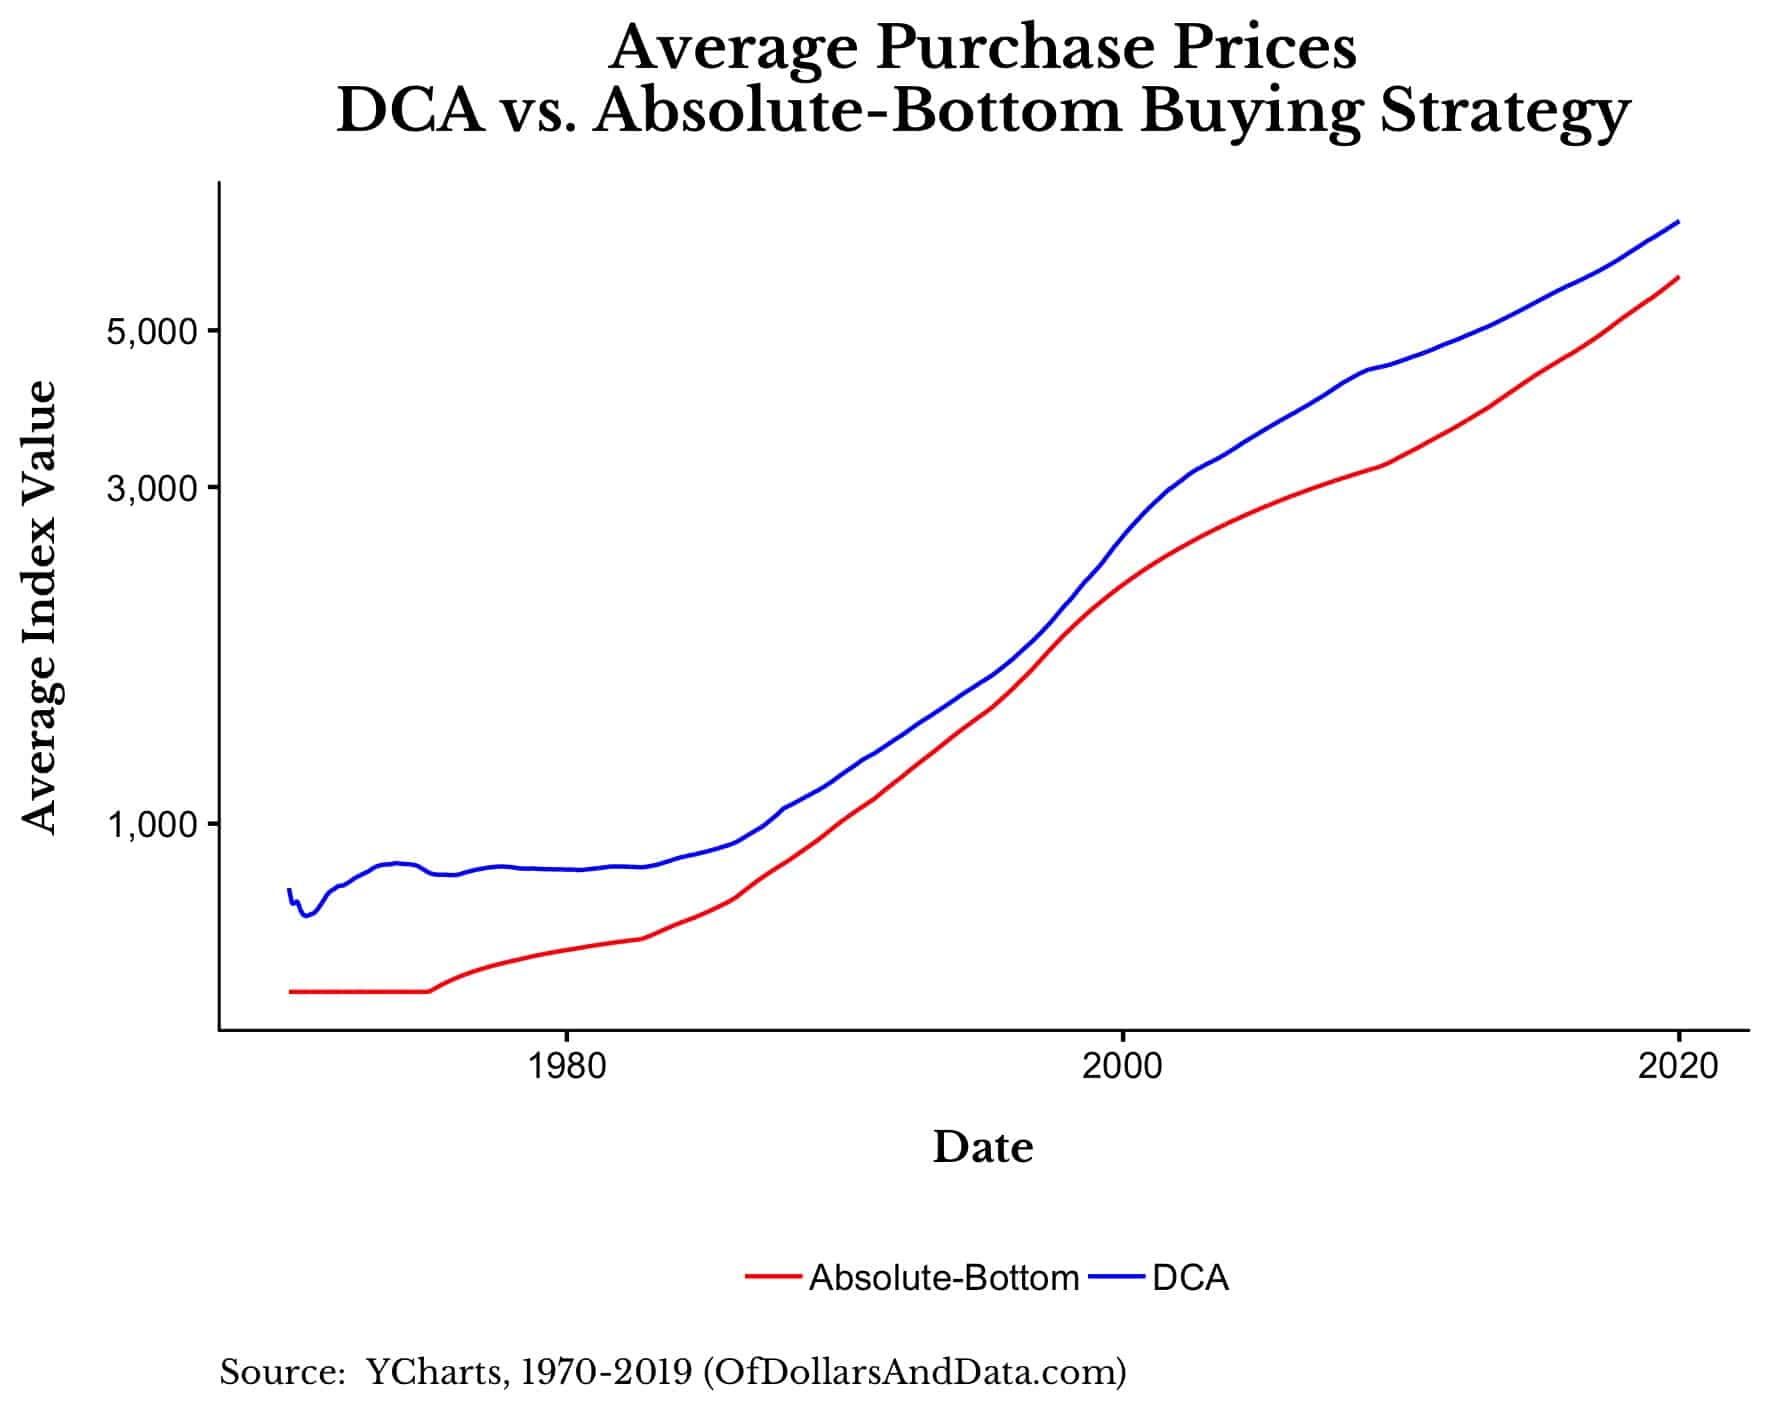
As you can see, DCA purchases at higher average prices compared to the Absolute-Bottom strategy. More importantly though, the divergences between the average prices are largest during bear markets (i.e. 1974, 2008), but start to converge during bull markets.
This tells us that timing decisions only have a significant impact once in a while (i.e. during big bear markets), so we shouldn’t spend any time worrying about them. Because you will likely lose more by waiting in cash than what you would gain if you did successfully time the market. Choose wisely.
The Time Has Come
It was nearly a year ago that I wrote, “This is the last article you will ever need to read on market timing,” yet here I am writing on that very topic. The journey has been worthwhile though. Over that time period I was able to illustrate why buying the dip doesn’t work, why a lump sum is superior to DCA, and even what conditions are required for successful market timing.
All of that work led me to this post, where I explain why attempting to perfectly time your purchases isn’t worth the effort and risks involved.
If at this point you still want to hold excess cash for “buying opportunities,” then I don’t know what else to tell you. Best of luck and thank you for reading!
If you liked this post, consider signing up for my newsletter.
This is post 160. Any code I have related to this post can be found here with the same numbering: https://github.com/nmaggiulli/of-dollars-and-data

