One of the biggest problems in personal finance is deciding when to invest a sum of money. Whether you have $100 or $1 million to invest, the question is:
Should you invest all that money over time (dollar cost averaging) or now (lump sum)?
Despite writing on this topic previously, I received follow-up questions that I never answered like, “What about risk?” or “Did you consider valuations?” and so forth.
So, to answer these questions and much more, I wrote this guide. It’s everything you need to know on dollar cost averaging vs lump sum investing. Let’s begin.
What is Lump Sum and What is Dollar Cost Averaging?
To clear up any confusion about terminology, I have provided definitions for both lump sum investing and dollar cost averaging below. Note that I will frequently refer to these as LS and DCA, respectively, throughout this article:
- Lump Sum (LS): The act of investing all of your available money at once. The amount of money being invested is not important, only that the entire amount is invested immediately.
- Dollar Cost Averaging (DCA): The act of investing all of your available money over time. How you decide to invest these funds over time is up to you. However, the typical approach is equal-sized payments over a specific time period (i.e. one payment a month for 12 months).
[Author’s Note: The term “dollar cost averaging” is also used when referring to someone buying into the market periodically, such as every 2 weeks through a 401(k) plan.
While I have used this definition of dollar cost averaging previously (see this post), this is not the dollar cost averaging I am referring to in this post.
When you buy periodically into the market (i.e. through your 401(k) every 2 weeks) you are actually making small lump sum investment every time you buy. This is true because you are investing all of your available money immediately. You are NOT letting cash sit on the sidelines like you would be for the DCA strategy discussed in this post.]
Visually, we can see the difference between investing $12,000 through LS vs. DCA over a period of 12 months:
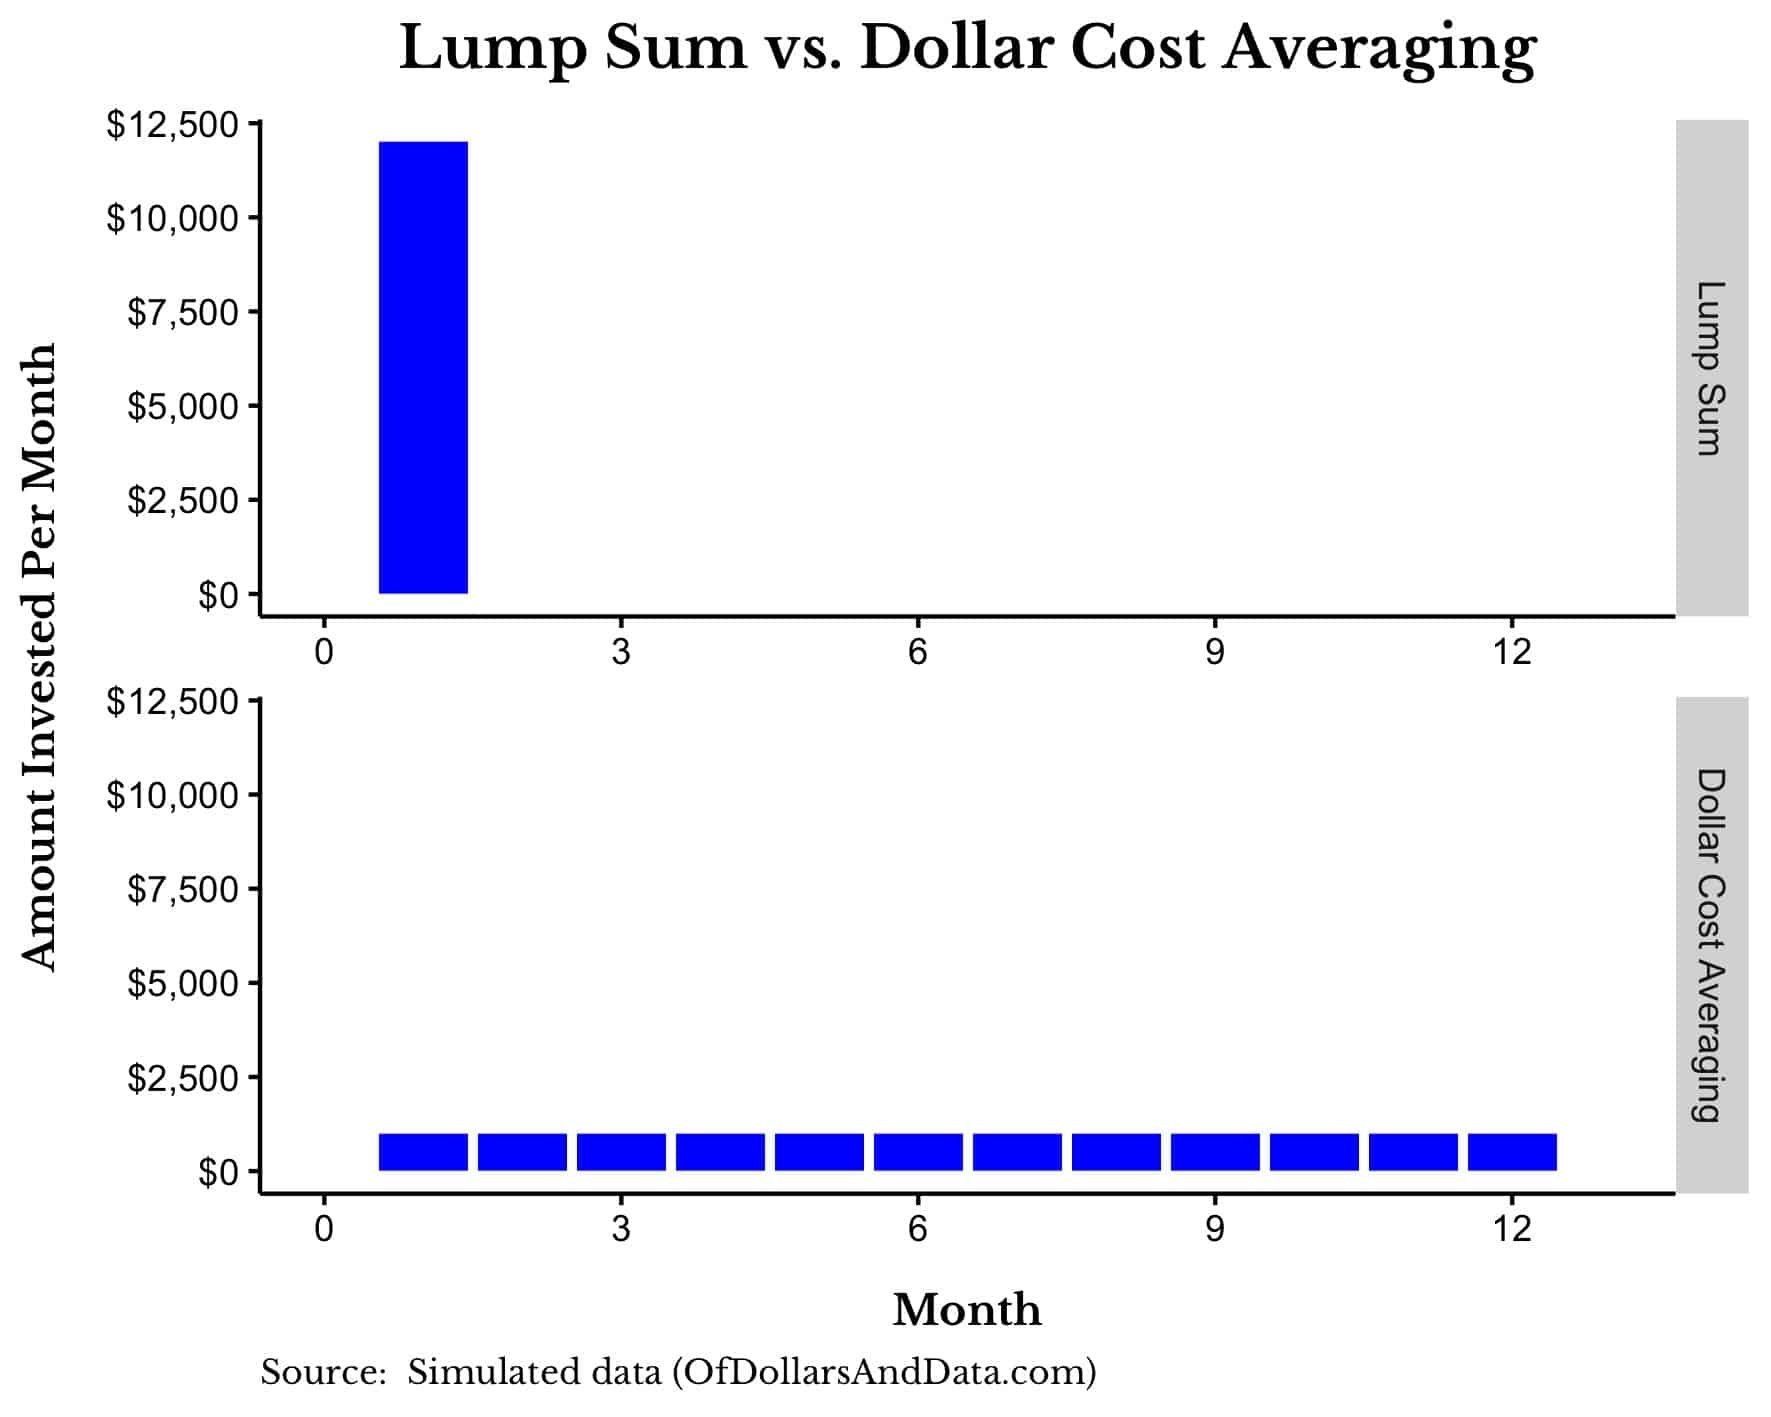
With LS you invest the $12,000 (all your funds) in the first month, but with DCA you only invest $1,000 in the first month and hold the remaining $11,000 in cash to be invested in equal-sized payments of $1,000 over the next 11 months.
Why Dollar Cost Averaging Loses (A Thought Experiment)
Now that we are on the same page regarding definitions, I am going to give you the punchline now: Dollar cost averaging will underperform lump sum investing for most asset classes most of the time.
We can use a somewhat absurd thought experiment to demonstrate this:
Imagine you have been gifted with $1 million and you want to try to preserve as much of its purchasing power over the next 100 years. However, you can only undertake one of two possible investment strategies. You must either:
- Invest all your cash now, or
- Invest 1% of your cash each year for the next 100 years
Which would you prefer?
If you assume that the assets you are investing in will increase in value over time (otherwise why invest right?), then it should be clear that buying now will be better than averaging in over 100 years. Waiting a century to get invested will not be kind to your purchasing power.
We can take this same logic and generalize it downward to periods much smaller than 100 years. Because if you wouldn’t wait 100 years to get invested, then you shouldn’t wait 100 months or even 100 weeks either.
The longer you wait, the worse off you will be, on average. The data I will present later in this post will illustrate this clearly. It’s like the saying goes:
The best time to start was yesterday. The next best time is today.
If you grasp this concept, then the rest of this post will flow much more easily.
How Much Does Dollar Cost Underperform By?
The size of the DCA’s underperformance will vary over time, by asset class and by how long you take to average into your market of choice. For now, we will assume a 24 month (2 year) buying window for DCA.
If you want to average in over a shorter buying window (i.e. DCA over 12 months), assume that the underperformance will be less severe than what is shown here, and if you want to average in over a longer buying window (i.e. DCA over 36 months), assume that the underperformance will be more severe than what is shown here.
To start, we will look at how a 24-month DCA performs compared to a Lump Sum investment in the S&P 500. If we look since 1997, DCA underperforms in 80.6% of starting months and by 10%, on average, by the end of its 24-month buying window:
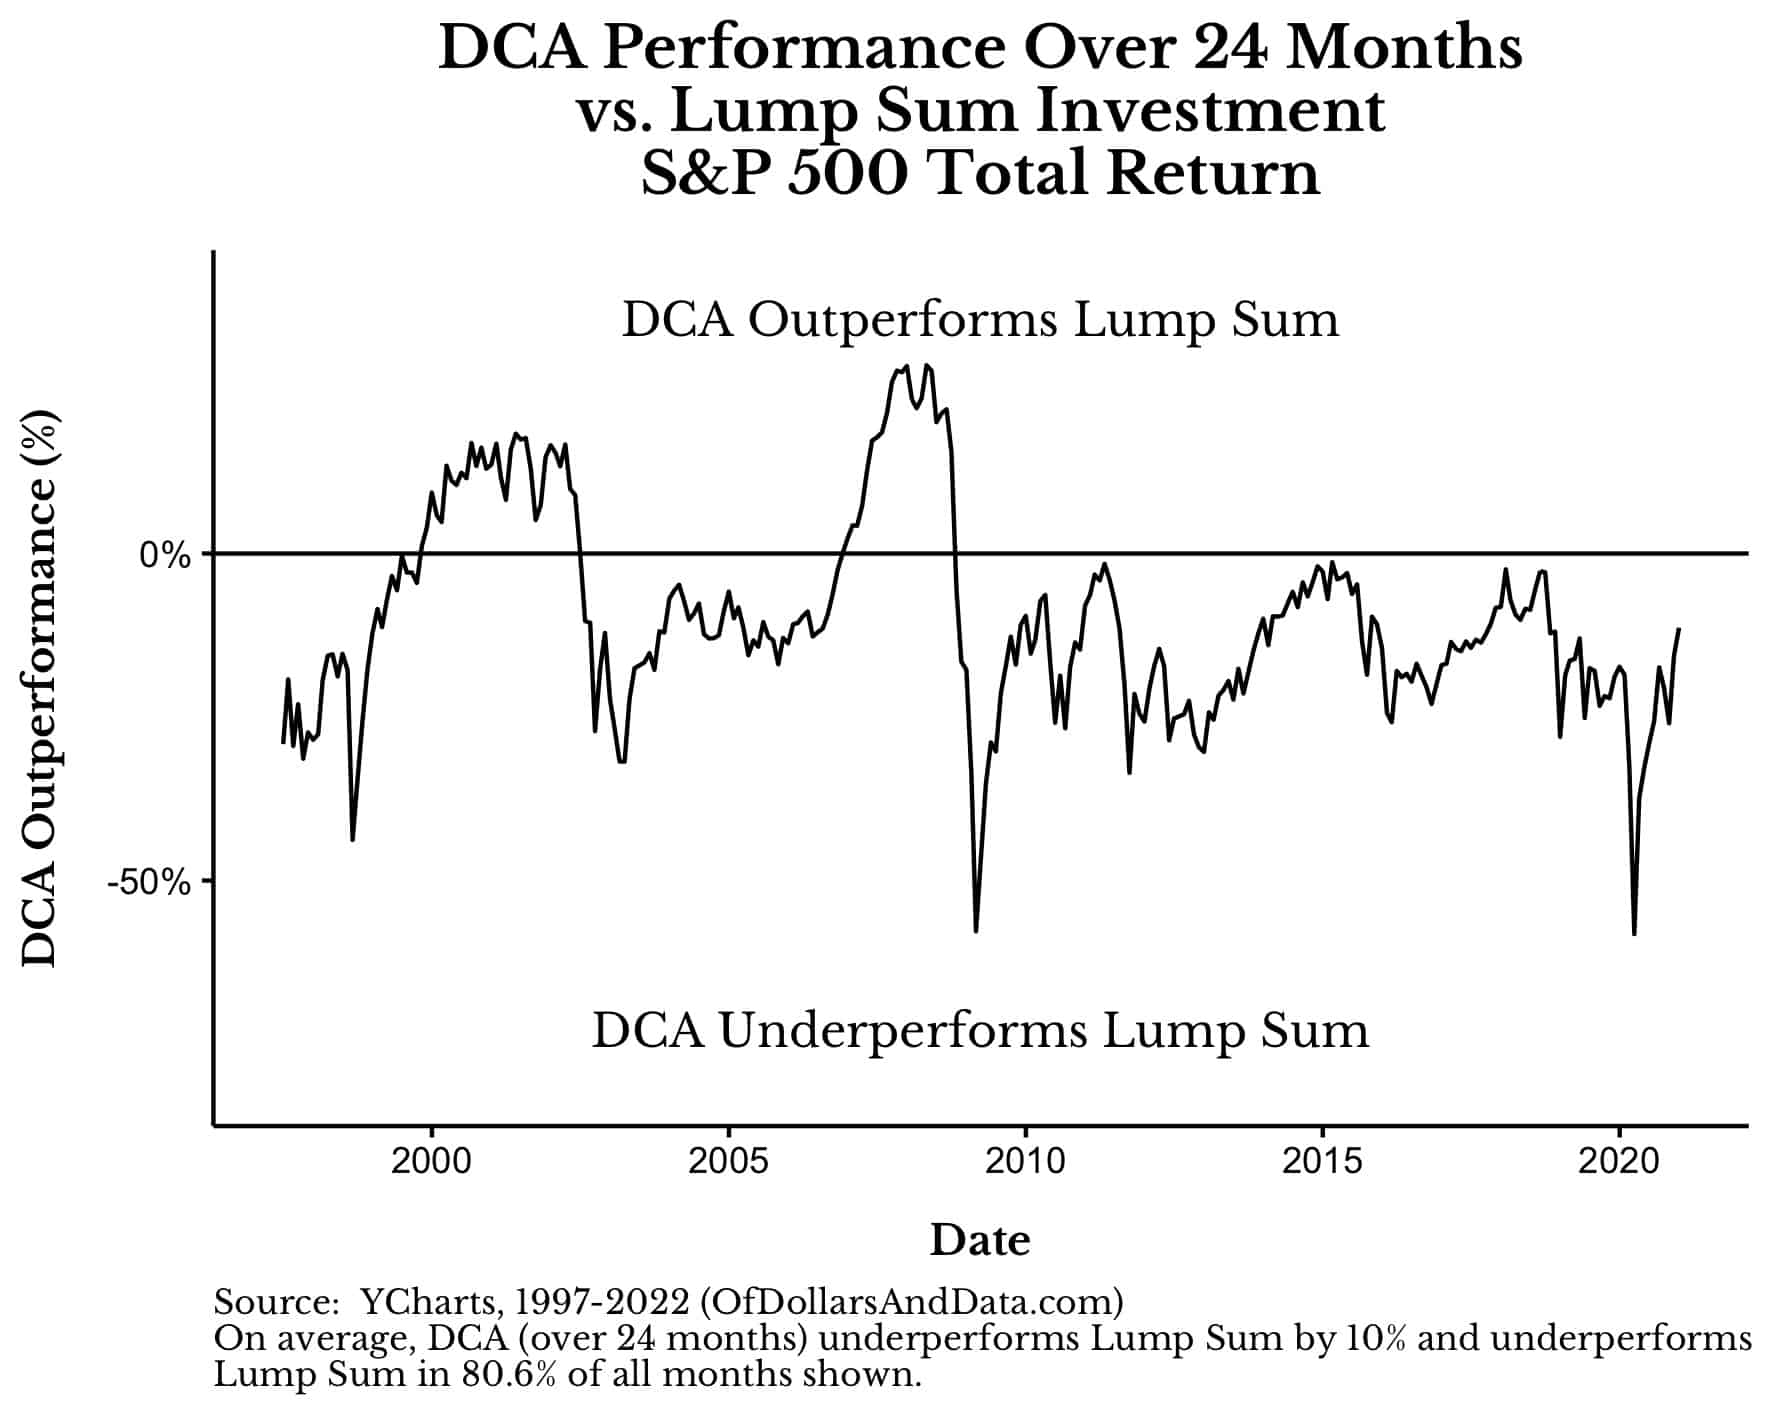
To create this chart we take what the growth of the DCA portfolio would have done over a 24-month period minus the growth of the Lump Sum portfolio over that same time period.
For example, if you had started buying into the market in January 2005 over the next 24 months, the DCA strategy would have underperformed a similar Lump Sum investment in January 2005 by about 10%. This is why in January 2005 in the plot above, the black line is at -10%.
When the black line is below 0%, these are periods where DCA underperforms LS, and when it is above 0%, these are periods where DCA outperforms LS.
We can extend this analysis back to 1960 (using the Shiller data) and we would see similar results:
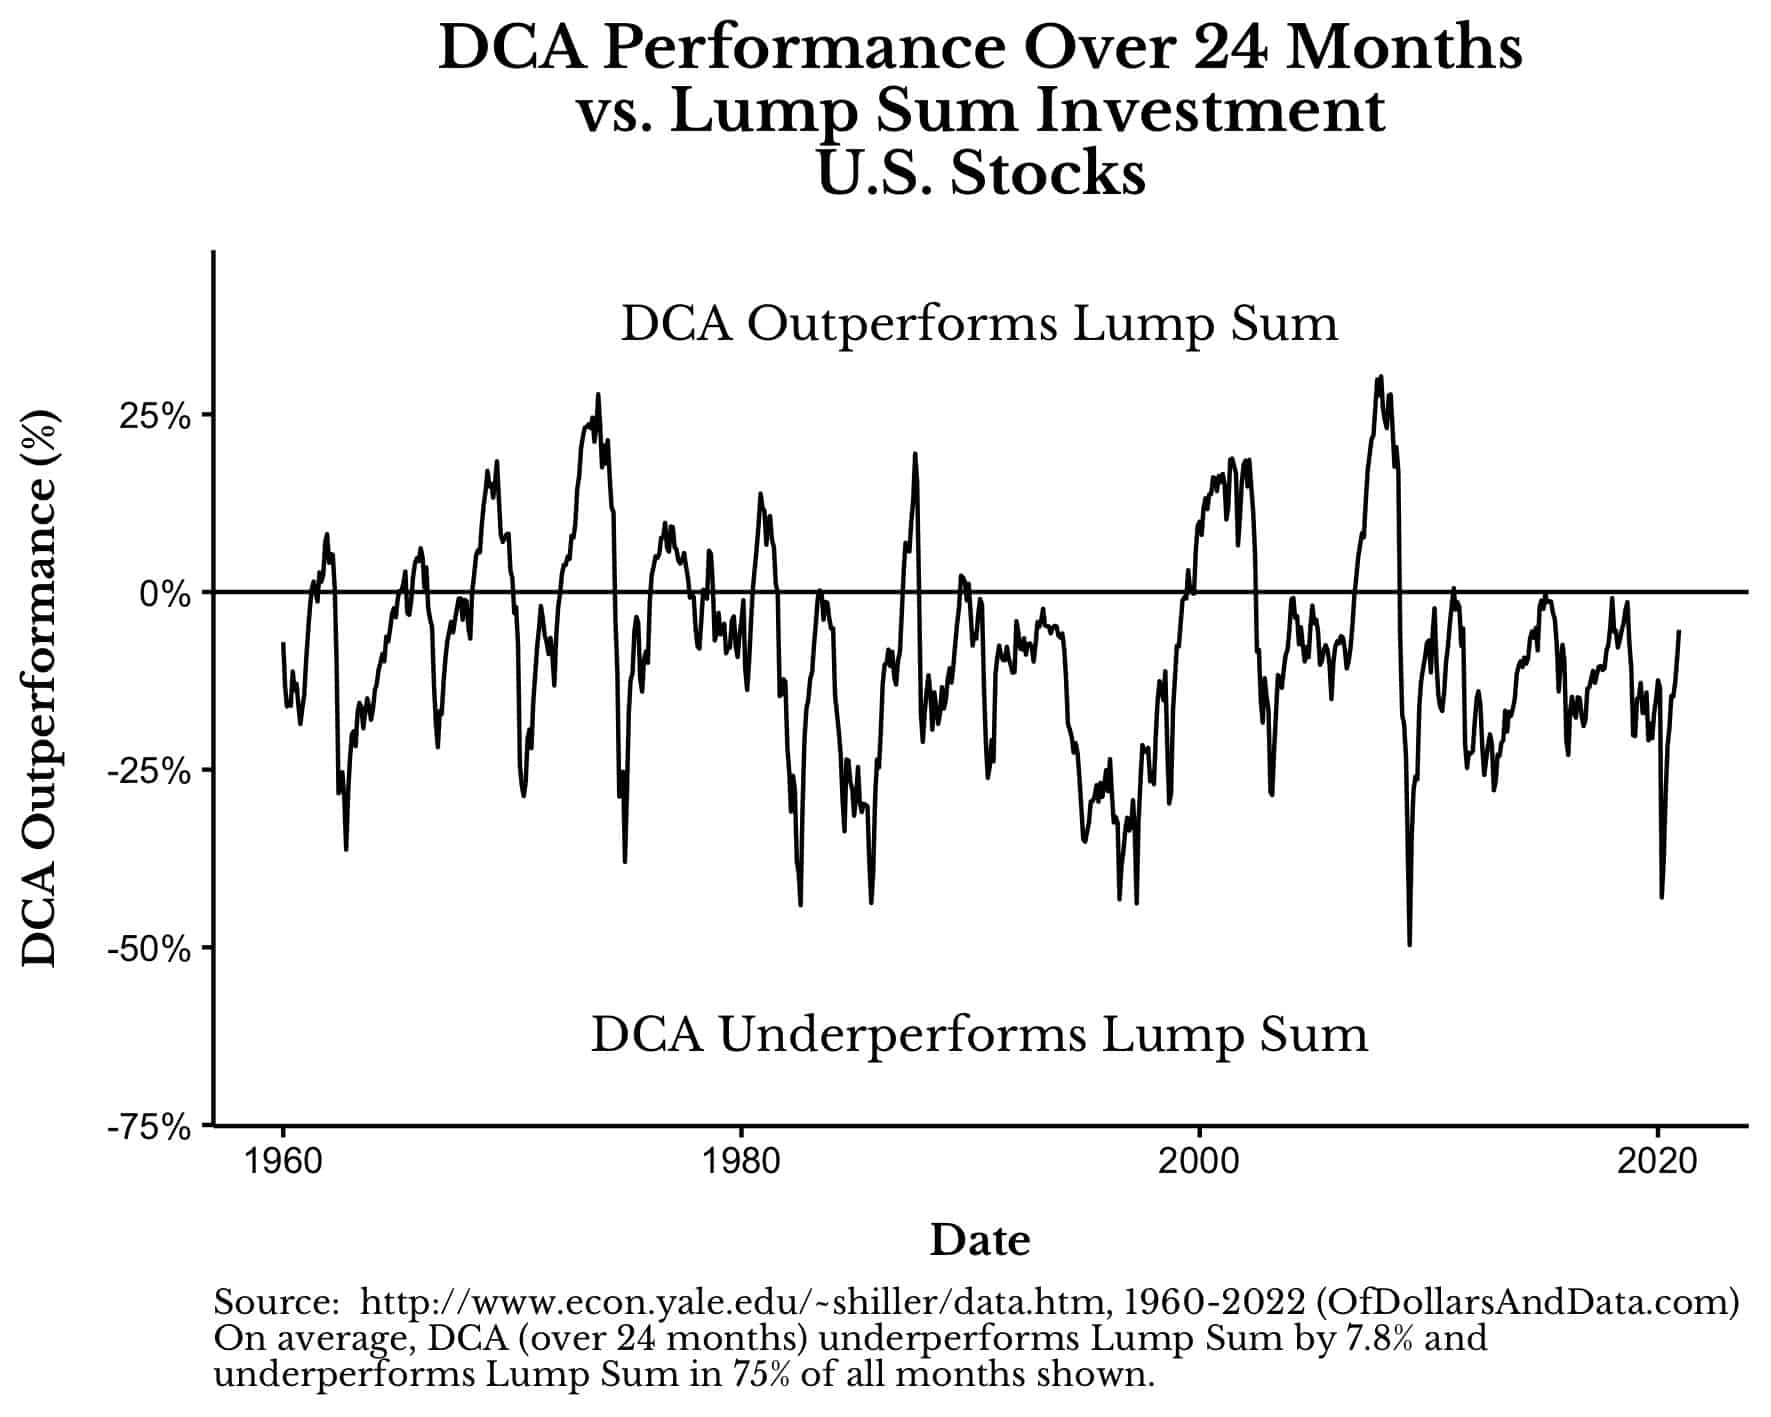
The only times when DCA beats LS is when the market crashes (i.e. 1974, 2000, 2008, etc.). This is true because DCA buys into a falling market, and, thus, gets a lower average price than a lump sum investment would.
Going back to the thought experiment from the previous section, when assets rise LS outperforms DCA, but when assets fall, DCA outperforms LS. Since most assets rise most of the time, this is why DCA underperforms LS.
Does Lump Sum Outperform for Other Assets Too?
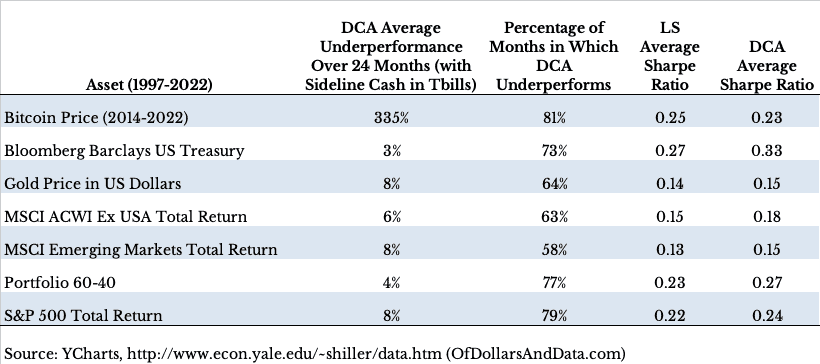
Rather than bury you in chart after chart showing Lump Sum’s superior return performance over DCA across a range of different asset classes, I created this summary table to demonstrate this over the period from 1997-2022:
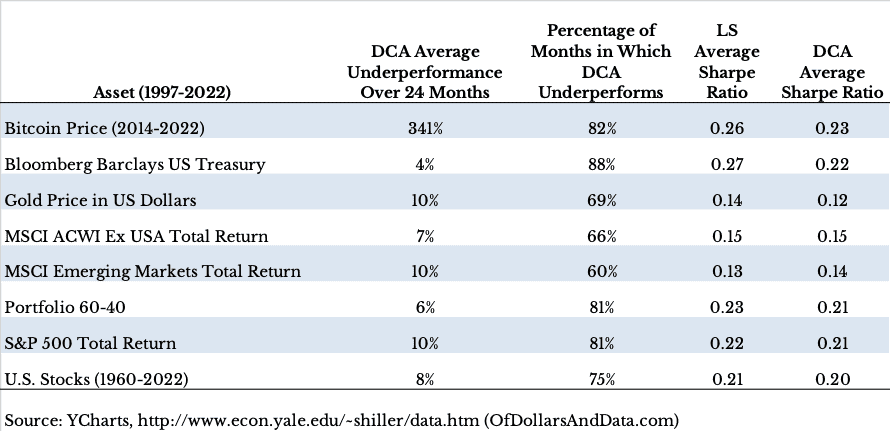
As you can see, DCA underperformed LS by 4% or more on average over 24 months in every single asset class tested and across the vast majority of starting months. So, if you picked a random month to start averaging into an asset, you are very likely to underperform a similar LS investment and by a decent amount too.
Additionally, on a risk-adjusted basis, DCA underperformed LS for all assets except the ACWI and Emerging Markets, as evidenced by the lower DCA Sharpe Ratios.
We will dive into risk more in the next section, but think about how this table emphasizes the main point from our earlier thought experiment. If an asset class is going to rise over the long run (and most asset classes have historically) you should buy before that rise occurs (LS) instead of while that rise is occurring (DCA).
This is most evident with Bitcoin where DCA has underperformed LS by a whopping 341% on average over 24 months due to Bitcoin’s meteoric price increases in recent years:
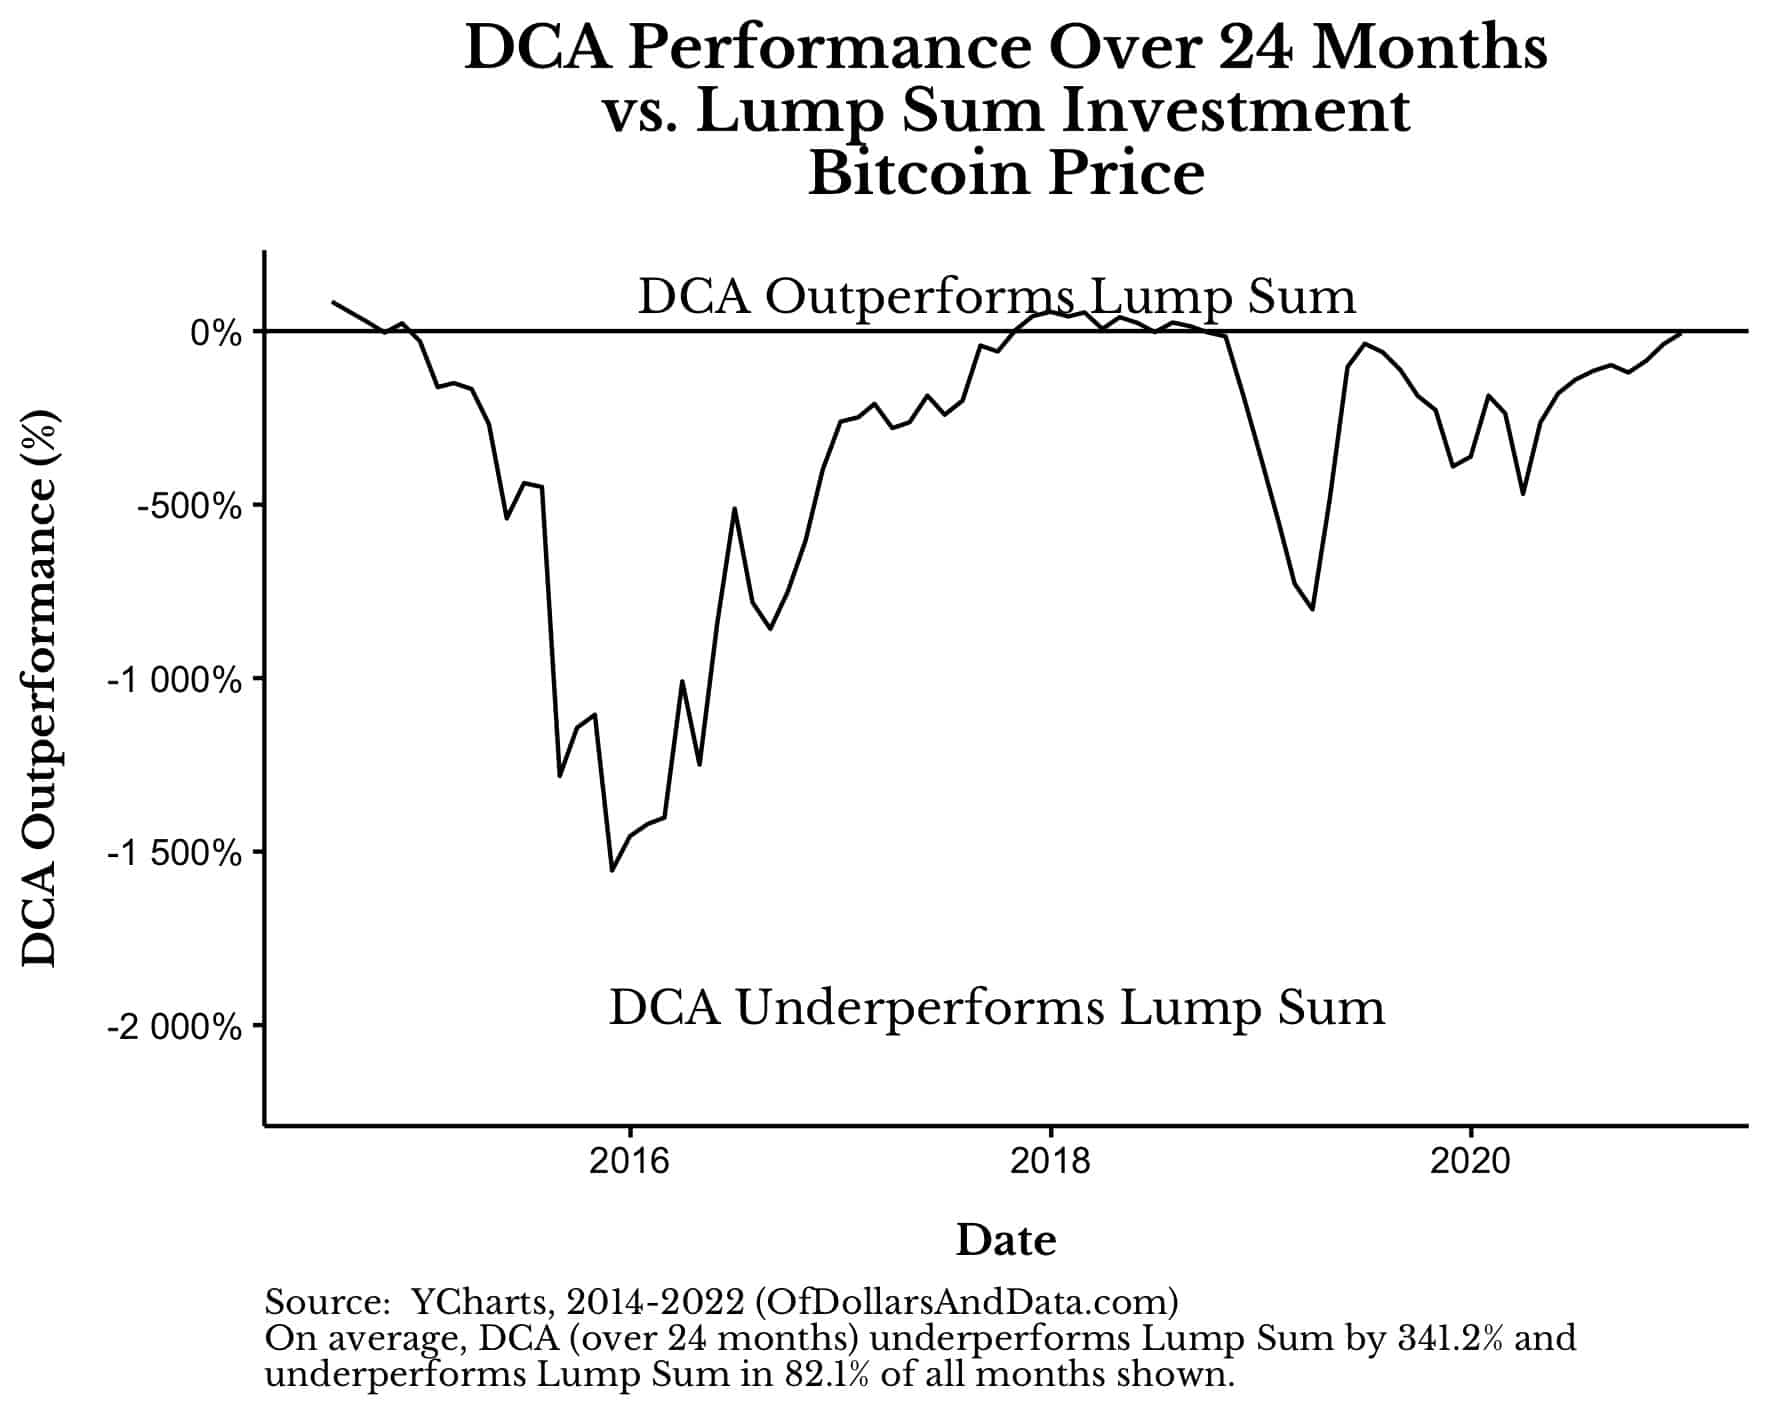
Of course, you might argue that Bitcoin doesn’t have a long-term positive trend from this point forward, in which case you shouldn’t be investing in that asset class at all.
What About the Risk of a Lump Sum Investment?
I know what some of you are thinking. Outperformance is nice and all, but most investors don’t just care about performance. They care about risk too. So, isn’t it riskier to do LS over DCA?
The answer to this is a resounding “Yes!” as this chart comparing the standard deviations of these two strategies into U.S. Stocks from 1960-2022 illustrates:
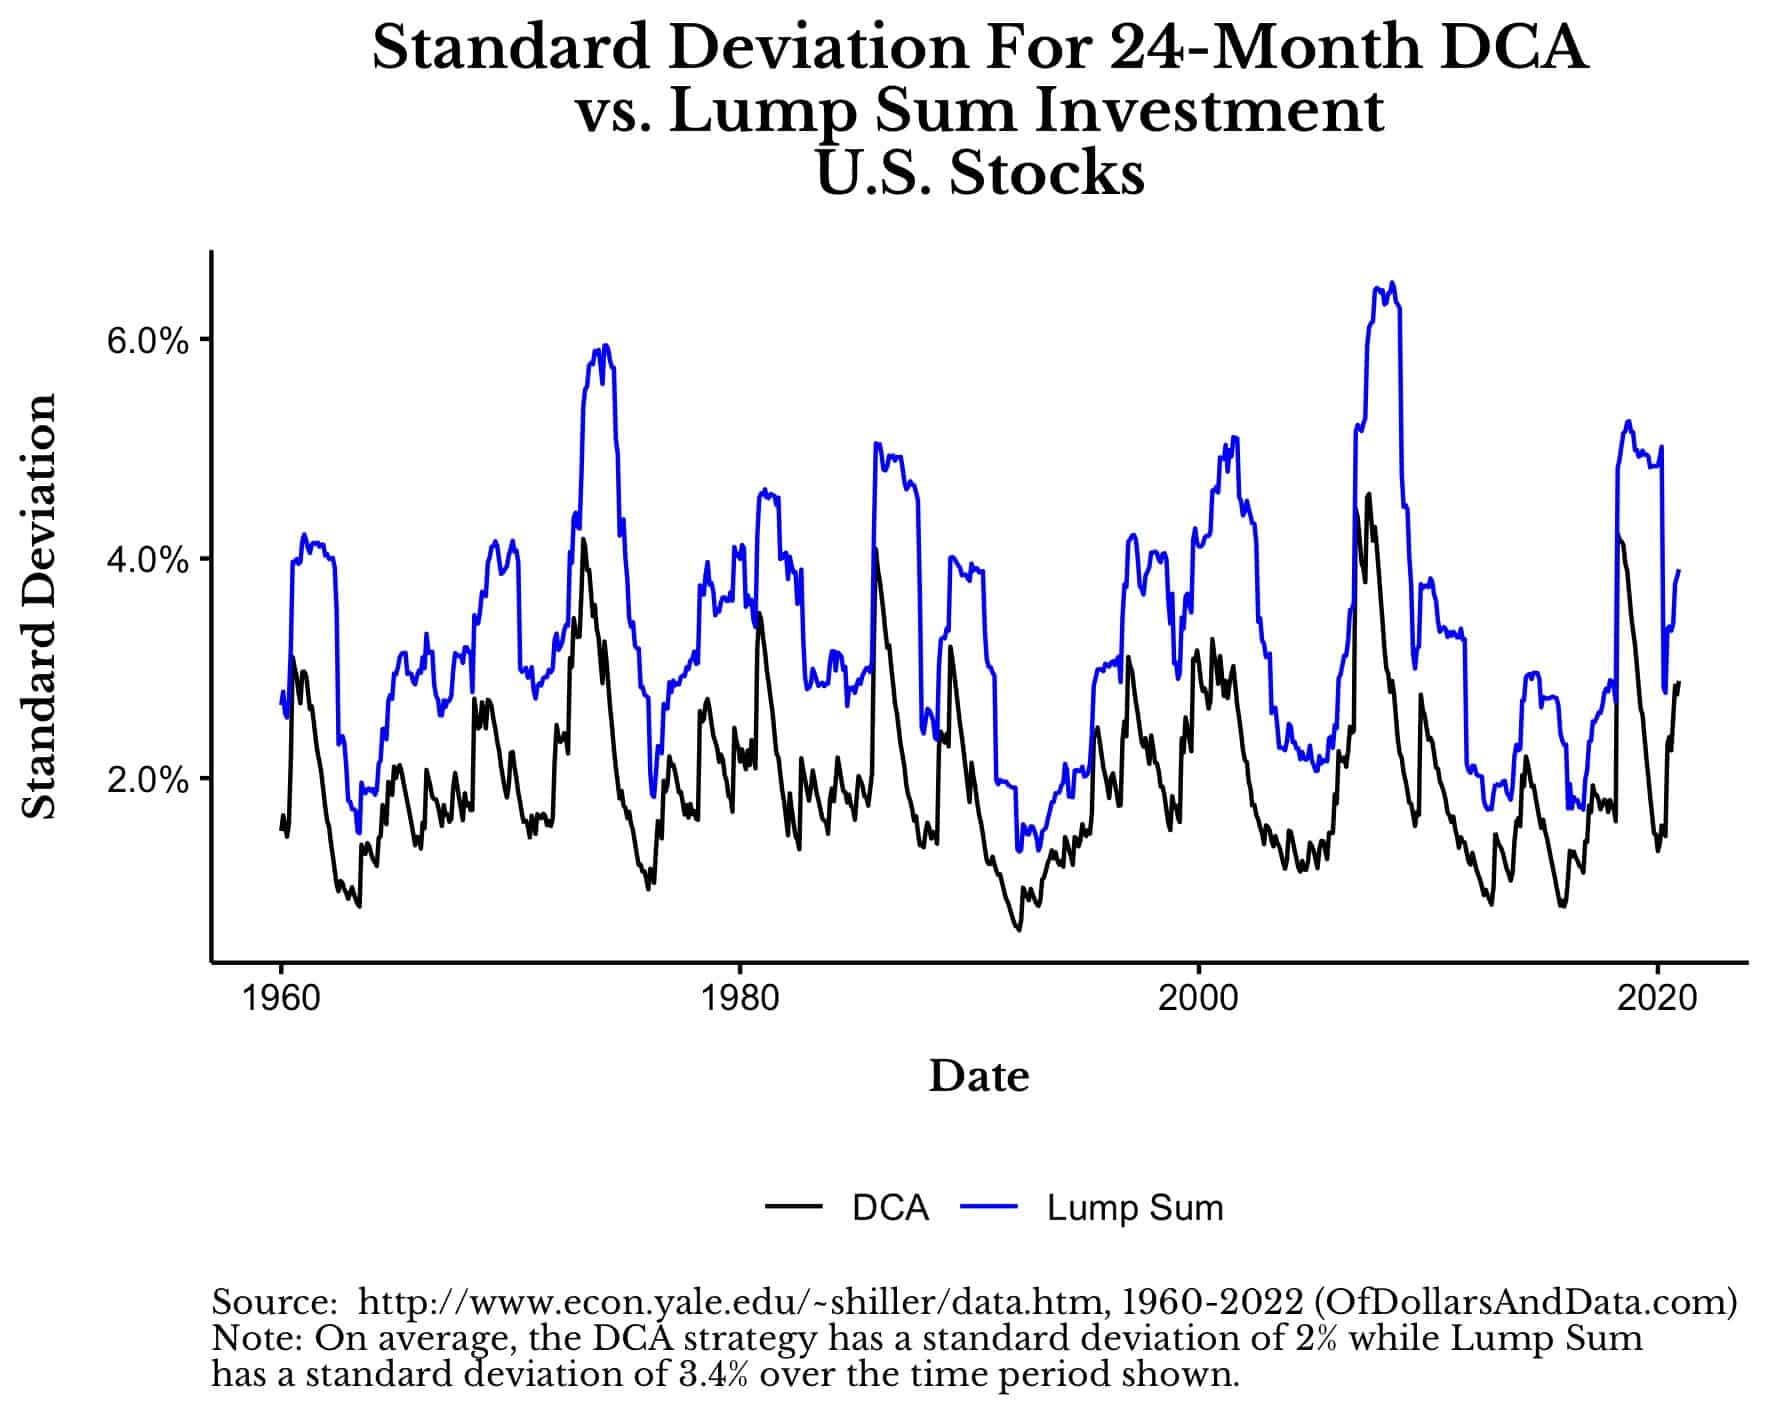
As you can see, the standard deviation of LS is much higher than DCA in every period tested (this is also true for other asset classes). This is true because LS invests right away and gets full asset class exposure, unlike DCA which is always partially in cash throughout the buying period.
However, as I have addressed in a previous post, LS can still outperform DCA while using a similar or lower risk portfolio.
For example, if you were to LS into a 60/40 (U.S. stock/bond) portfolio you would outperform DCA into a 100% stock portfolio in most periods from 1997 to 2022:
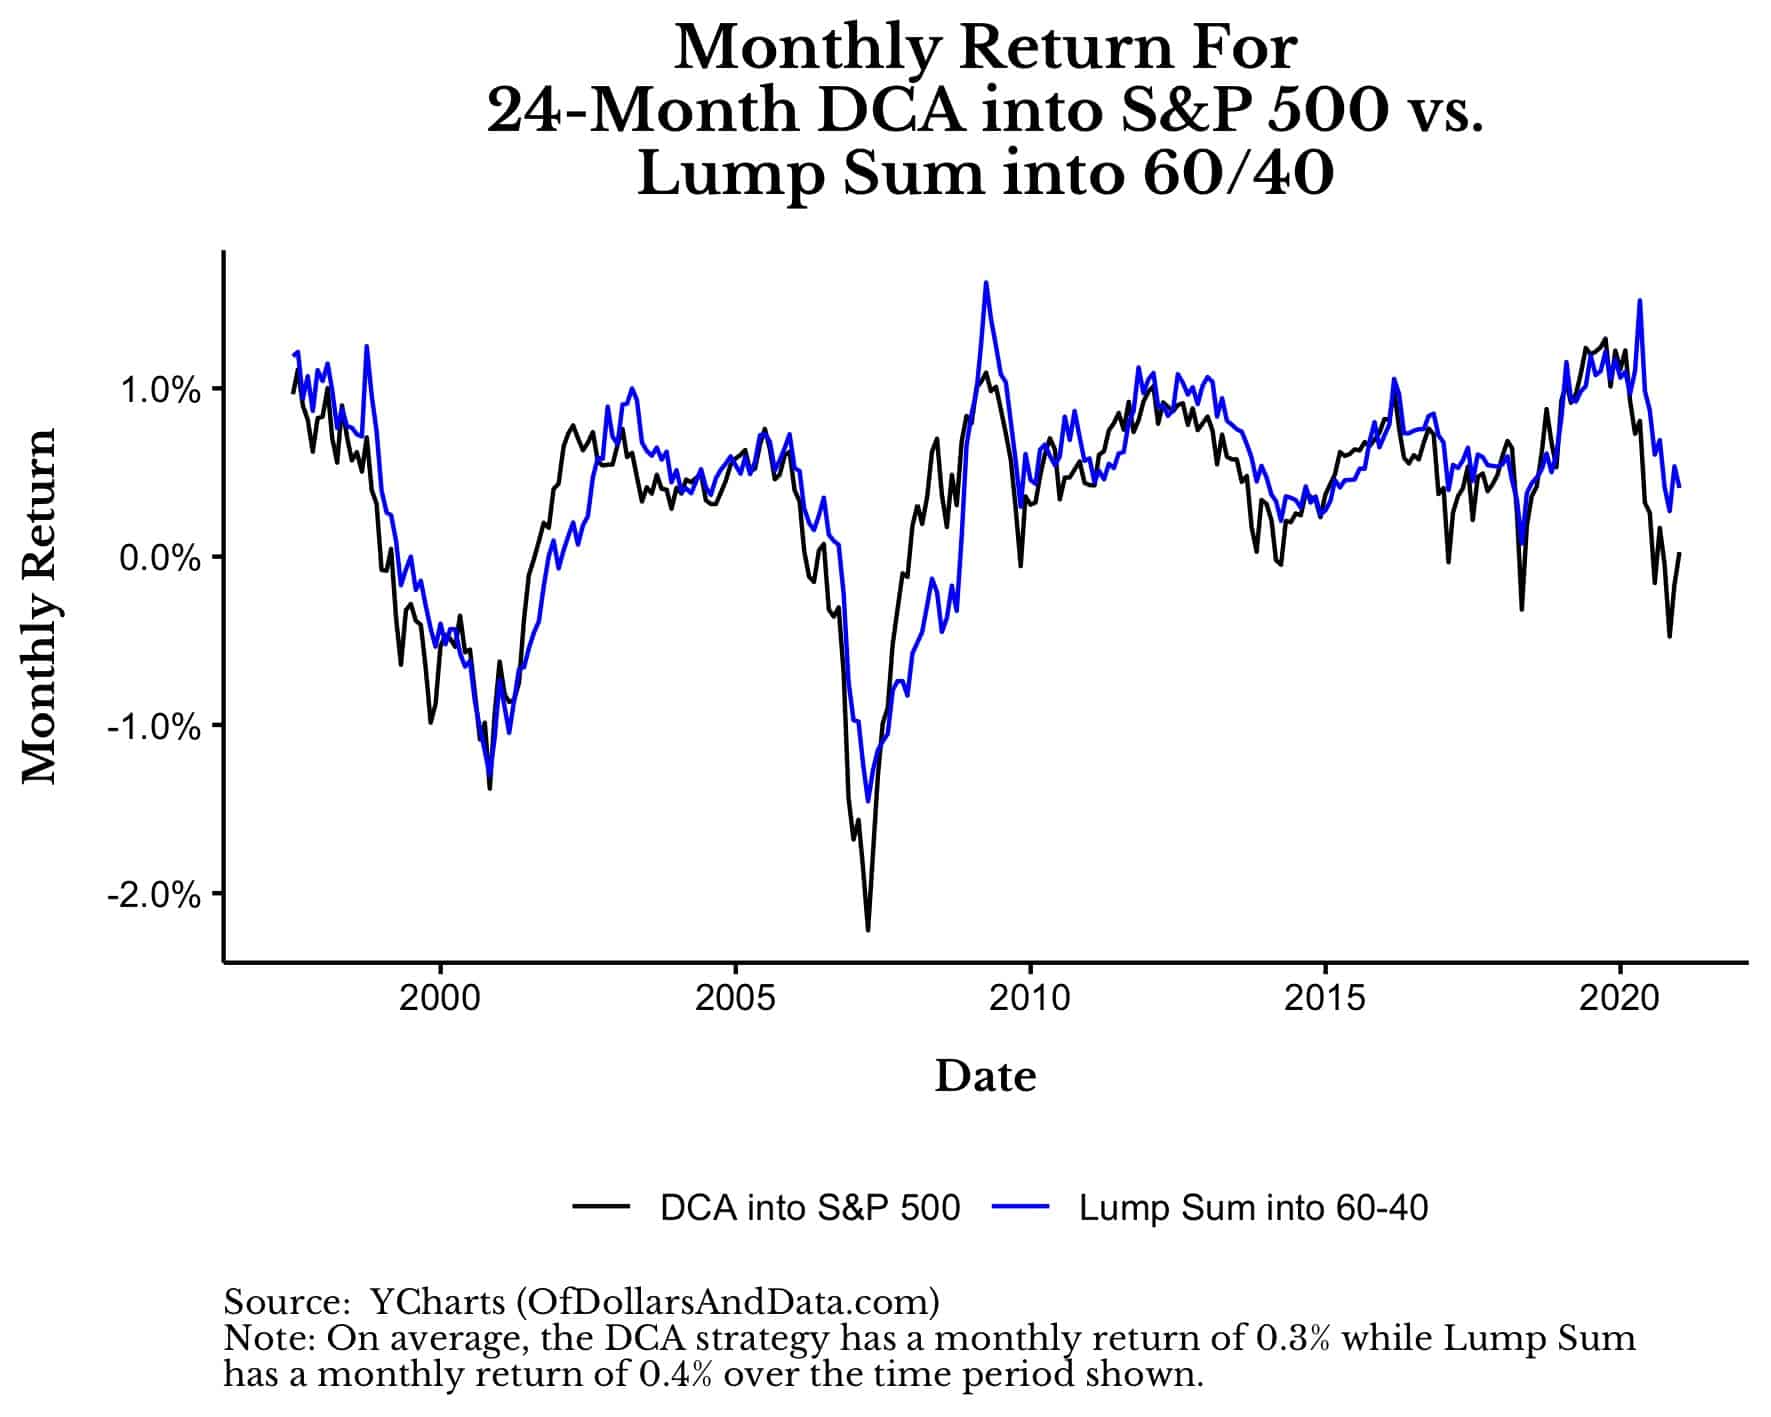
More importantly though, you would take roughly the same level of risk while doing so:
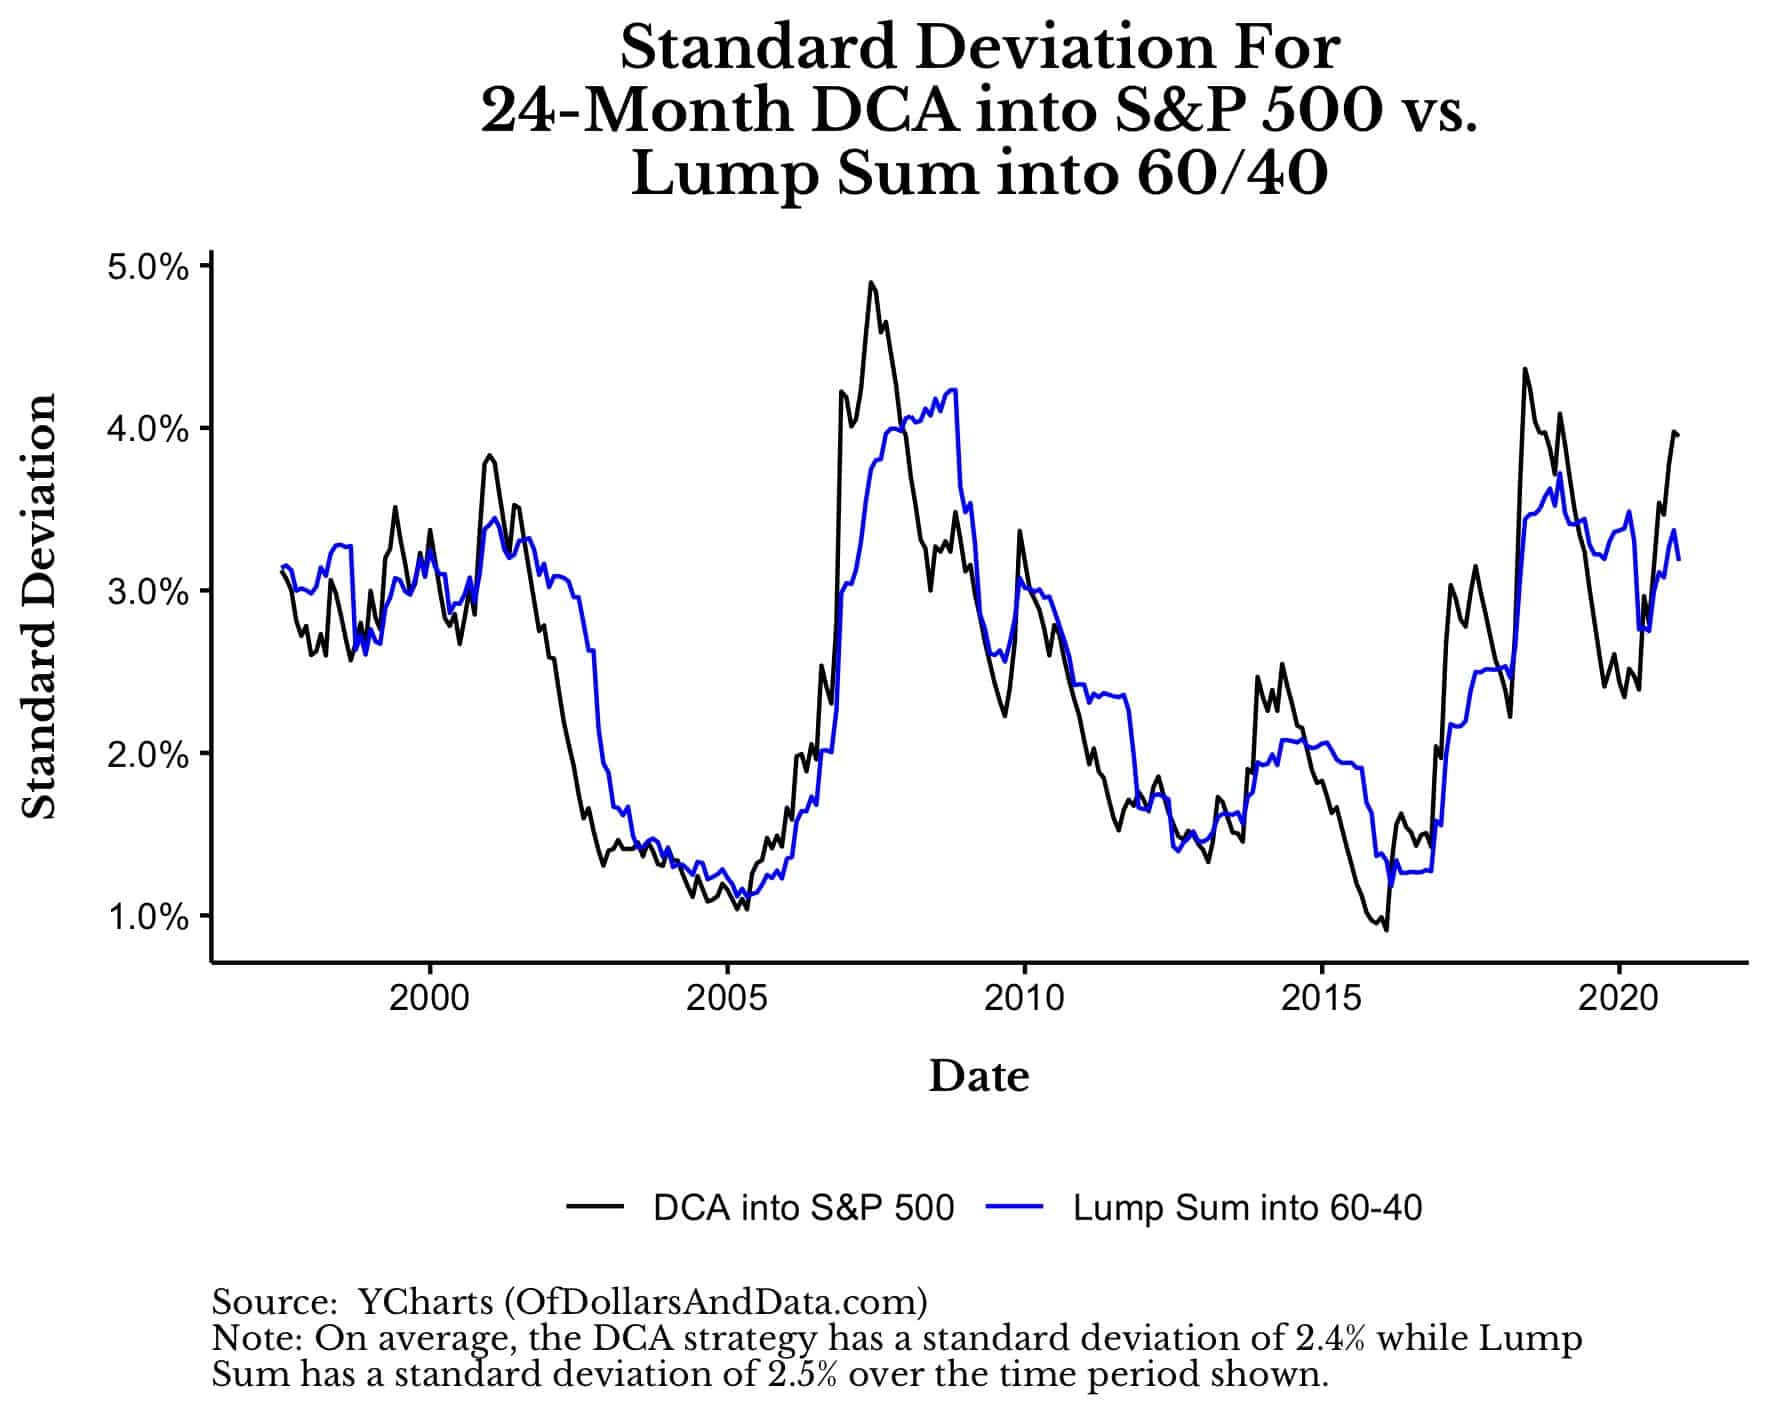
Think about what this means. A Lump Sum investment into a 60/40 (stock/bond) portfolio has the same level of risk as Dollar Cost Averaging into the S&P 500 over 24 months, yet the Lump Sum investment is more likely to outperform!
As mentioned in the previous section, for most asset classes across most time periods, LS outperforms even on a risk-adjusted basis. I measured this in the prior section by using the Sharpe ratio, which is roughly equivalent to a portfolio’s return divided by its volatility.
Using this metric, LS has a higher Sharpe ratio than DCA most of the time, so even when we adjust for the lower risk taken by DCA, it still doesn’t earn equivalent risk-adjusted returns when compared to LS.
What About Investing the “Side Cash”?
Every backtest I have shown thus far has assumed that the DCA cash on the sidelines is just that—cash. However, after my prior post on lump sum investing, lots of individuals cried out that this side cash should be invested in Treasury Bills while the DCA strategy gets invested.
There is just one problem with this theory—most investors don’t follow it. They don’t move their money into Treasury Bills while waiting to get invested, they sit in cold, hard cash.
I know this anecdotally from speaking with many advisors at my firm who have had countless conversations with prospective clients who have been in cash for years.
And I also know this from the AAII asset allocation survey which shows that, over the last 20 years, the average individual allocation to cash is 22.4%! And if we go back further in time, the cash allocation is even higher.
So though I disagree that the DCA “side cash” should be invested in Treasury Bills due to the evidence suggesting otherwise, I will oblige this request in order to be thorough.
So, what changes when the sideline DCA cash earns T-Bill returns? Under these conditions, DCA still underperforms LS across all assets classes tested, but generally not on a risk-adjusted basis:
As you can see, compared to when the DCA sideline cash was not invested, DCA’s underperformance has shrunk slightly from 6%-10% to 4%-8%, on average.
More importantly though, the average Sharpe ratio of DCA is now generally higher than the Sharpe ratio for LS for nearly all but one of the asset classes tested (hint: Bitcoin).
So, if you are a disciplined investor who can DCA into a falling market while keeping your sideline cash invested in Treasury Bills (or an equivalent T-Bill index), than you might just be better off than doing a Lump Sum investment.
However, if you don’t know how you would react to a falling market, or you don’t have the discipline to move your cash to Treasury Bills, then please reconsider following a DCA strategy.
Do Valuations Matter?
Last, but not least, we have valuations. A common response I hear when recommending LS over DCA is, “In normal times this makes sense, but not at these extreme valuations!”
So, when valuations are elevated, does this imply we should re-consider DCA?
Not really, but let me explain.
Below I have re-plotted the DCA outperformance chart for U.S. Stocks from 1960 to 2022, but color coded the line based on the Shiller cyclically-adjusted price-to-earnings (CAPE) ratio quartile [Note: the redder the line, the higher the CAPE/valuation]:
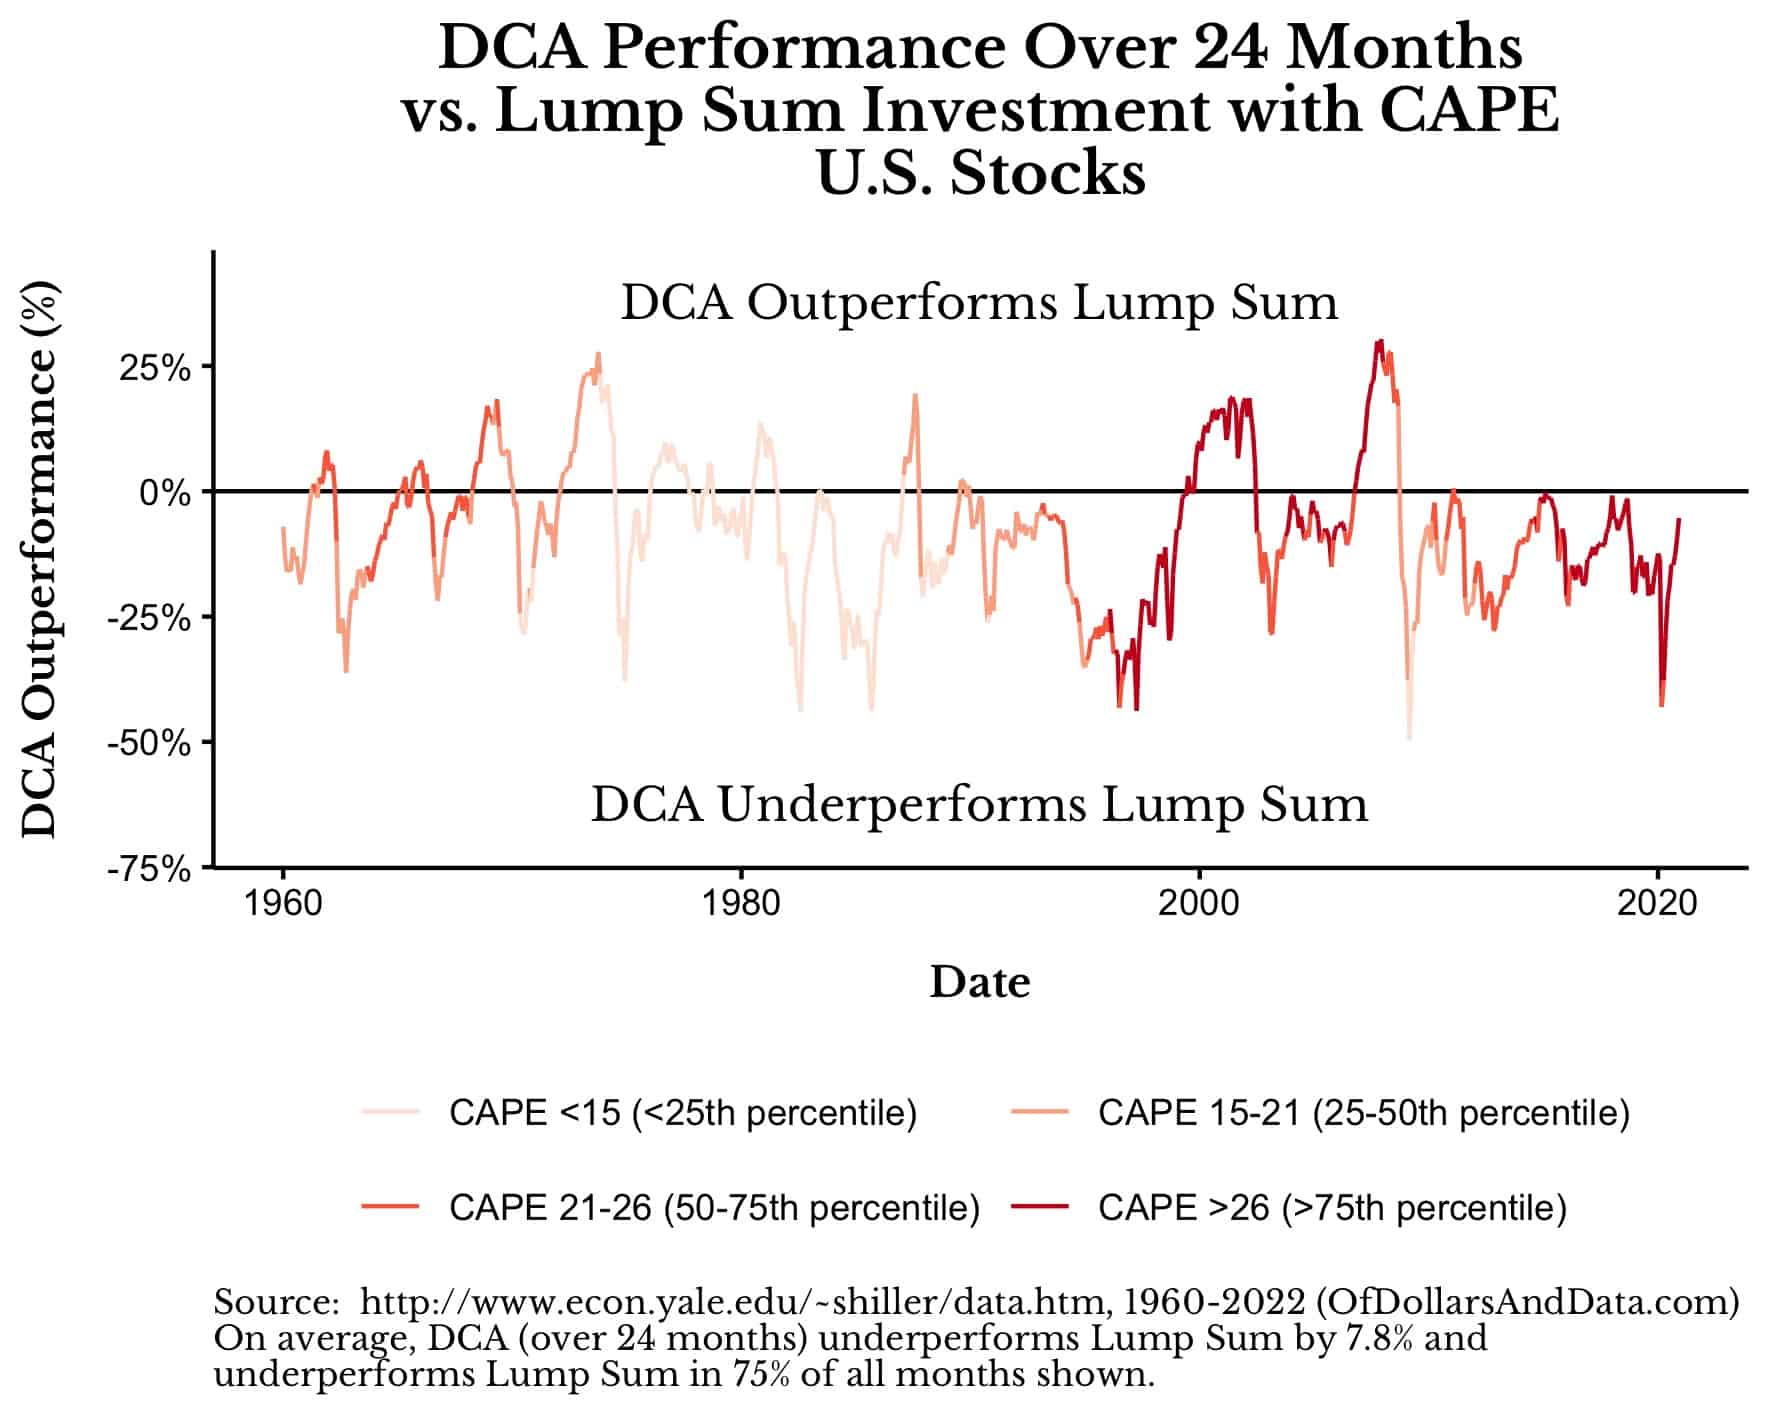
As you can see, many of the times when DCA outperforms LS, CAPE at the 75th percentile or higher (i.e. CAPE >25). However, if we break the performance out by CAPE Percentile we see that DCA always underperforms LS even on a risk-adjusted basis:
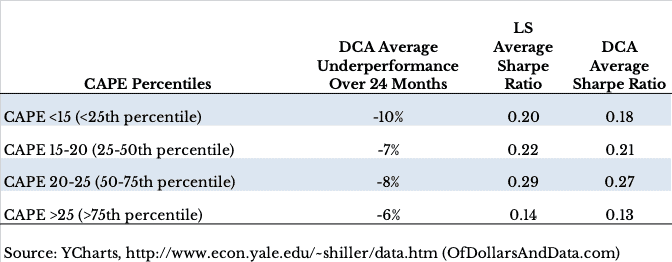
The size of DCA’s underperformance does shrink as valuations get more extreme, but, unfortunately, as we try to analyze the periods with the highest valuations, we run into sample size problems.
For example, if we only consider when CAPE > 30 (about the level it was at the end of 2019), DCA outperformed LS by 5% on average over the next 24 months. However, the only time when CAPE was >30 before modern times was the DotCom Bubble!
Shiller’s CAPE once again broke 30 in July 2017, and the S&P 500 is up over 85% (with dividends) since then. Of course no one knows whether the CAPE will return to its much lower historical average, but if you want to “wait this one out” you may find yourself waiting a long time.
For example, the first time CAPE passed 30 was in June 1997. However, the DotCom Bubble prices didn’t reach June 1997 levels again until July 2002 (over 5 years later)! So if you think that the market is overvalued now and due for a major pullback, you may need to wait years, if ever, before you are vindicated.
I am not saying that valuations don’t matter, but maybe they matter less than they used to or maybe we don’t have enough data to say at what level they should matter.
This is why when I am asked whether we should consider DCA over LS based on valuations, I say, “Not really.” Because, most of history, DCA has underperformed LS regardless of valuation. Of course, there may be exceptional periods that will break this rule, but only time will tell.
The Bottom Line (What the Data Shows)
For those of you that skim articles and skipped past the detailed sections above, here’s the punchline:
When deciding between dollar cost averaging vs lump sum, it is almost always better to lump sum (invest it now), even on a risk-adjusted basis.
This is true across asset classes, time periods, and nearly all valuation regimes. Generally, the longer you wait to deploy your capital, the worst off you will be.
I say “generally” because the only time when you are better off by doing DCA is when averaging into a falling market. However, it is precisely when the market is falling that you will be the least enthusiastic to keep buying. It is difficult to fight off these emotions, which is why the times when it is best to DCA, most investors won’t be able to stick to the strategy.
If you are still worried about investing your lump sum today, the problem may be that you’re investing in a portfolio that is too risky for your liking. Consider placing this money in a more conservative portfolio now and move on with life.
Happy investing and thank you for reading!
If you liked this post, consider signing up for my newsletter or checking out my prior work in e-book form.
This is post 164. Any code I have related to this post can be found here with the same numbering: https://github.com/nmaggiulli/of-dollars-and-data

