With 2023 drawing to a close and the U.S. stocks up over 20% year-to-date, many investors are wondering whether this year’s market momentum will continue into next year. Of course, we can’t know the future, but market history has been a great guide in recent years.
For example, following the large decline we experienced last year in 2022, I argued that 2023 should be an up year based on history:
So where does this leave us? If big down years tend to be followed by big recoveries, but yield curve inversions tend to be followed by almost anything, is 2023 more likely to be an up year or a down year?
The answer is—an up year. Why? Because, historically, most years are up years for U.S. stocks. In fact, in roughly seven out ten years since 1900, U.S. stocks have generated a positive real return.
The distribution of U.S. stock returns following a big down year also supported this conclusion. As you can see in the chart below, U.S. stocks tend to have larger positive returns following a big down year (>20% decline) when compared with all other years:
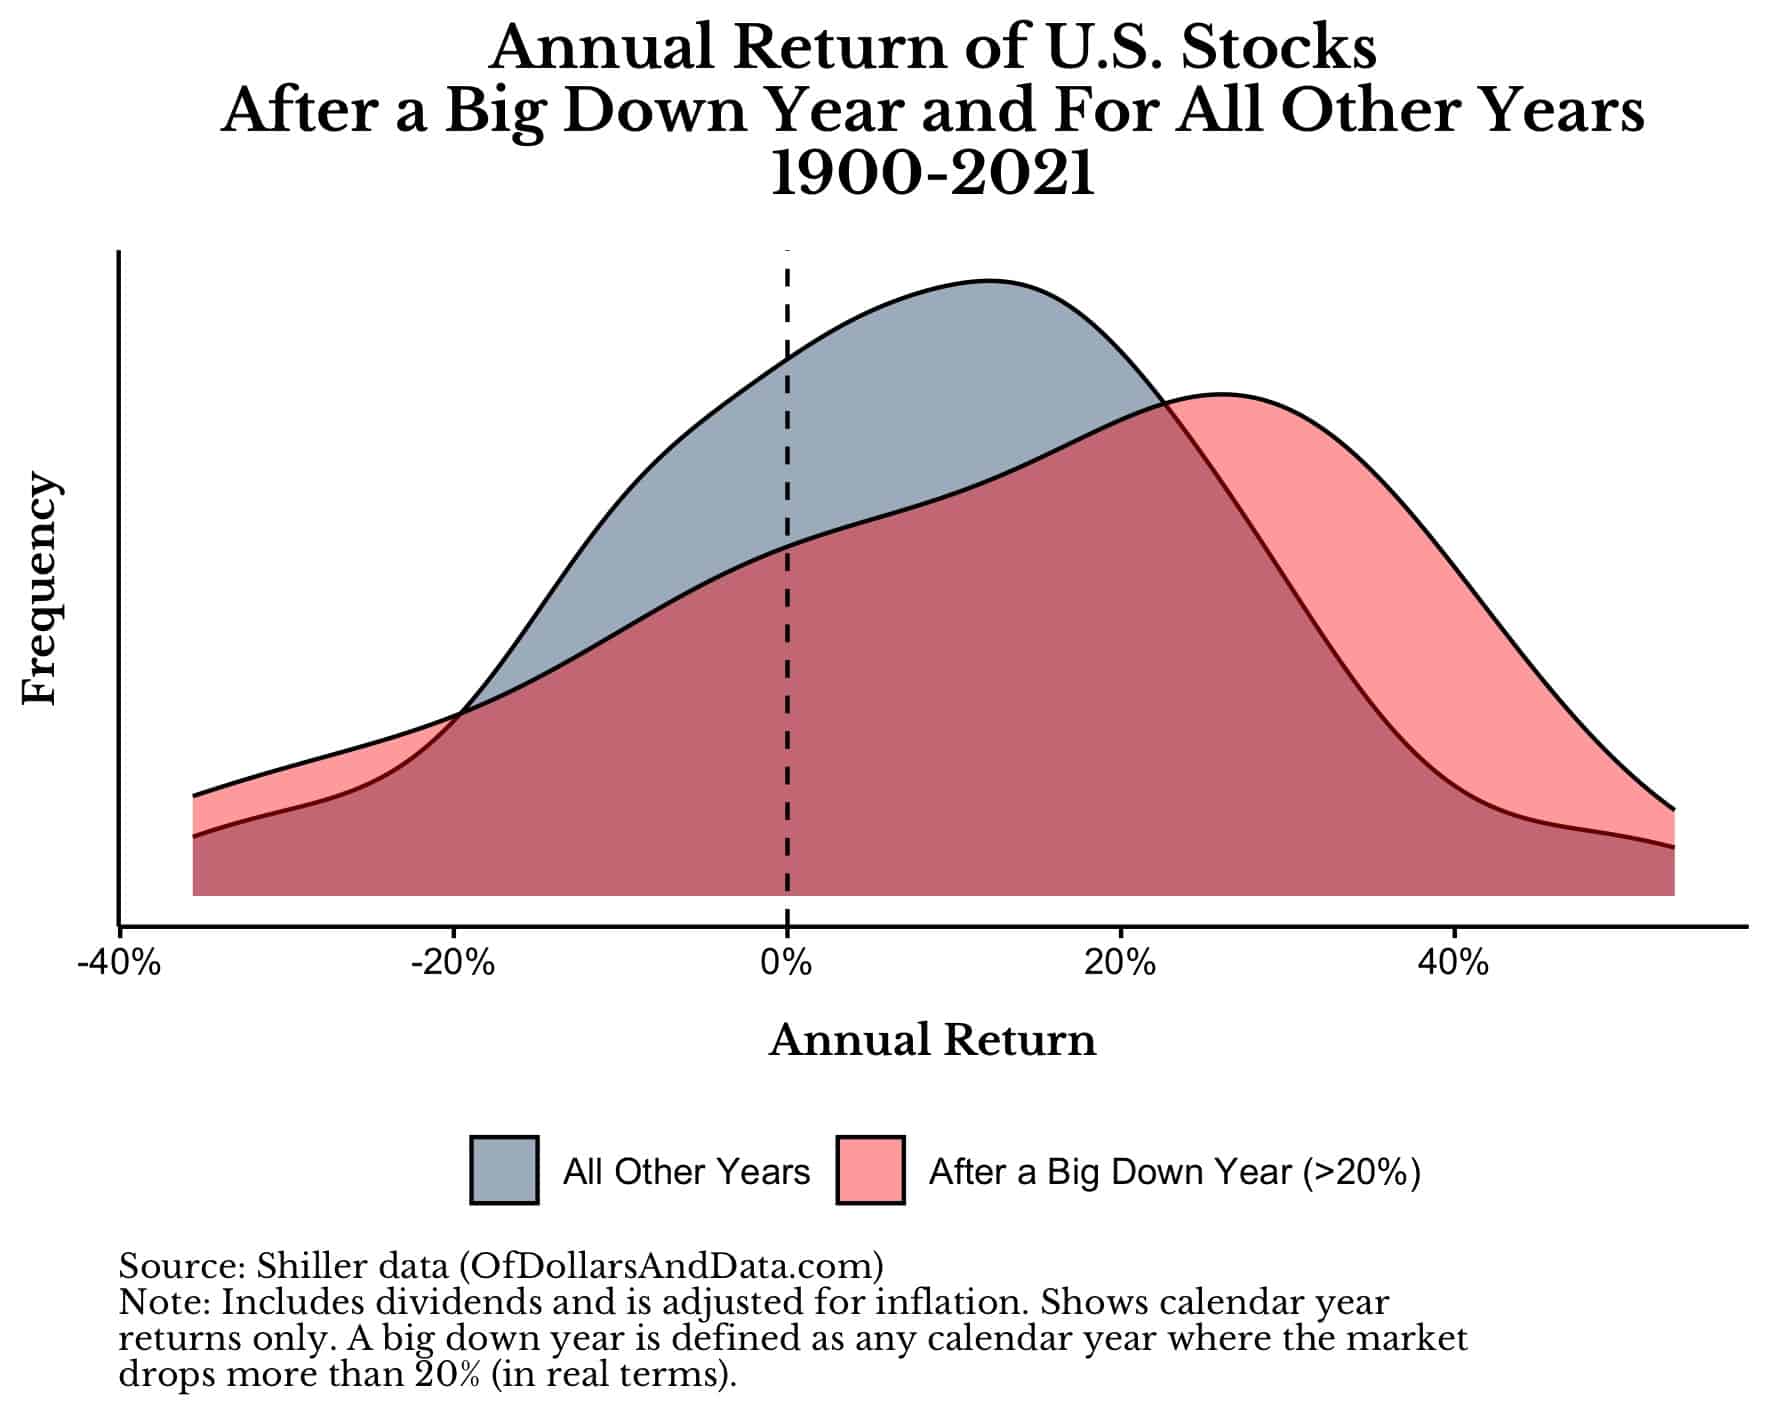
Of course, the return distribution after a big down year also contained more negative returns as well (the larger mass on the left side), but the positive returns were more likely.
Lo and behold, in 2023 we saw an annual return that basically matched the peak of the “After a Big Down Year” return distribution (i.e. in the 20%-30% range). It’s as if using history as a guide can actually work. If we were to use this same approach to figure out what 2024 might have in store for us, what would we conclude?
History suggests—another up year.
I know I sound like a broken record, but this is where the data is leaning. For example, if you look at the distribution of returns in the year following a big up year, you would see that those returns are generally higher than the returns in all other years:
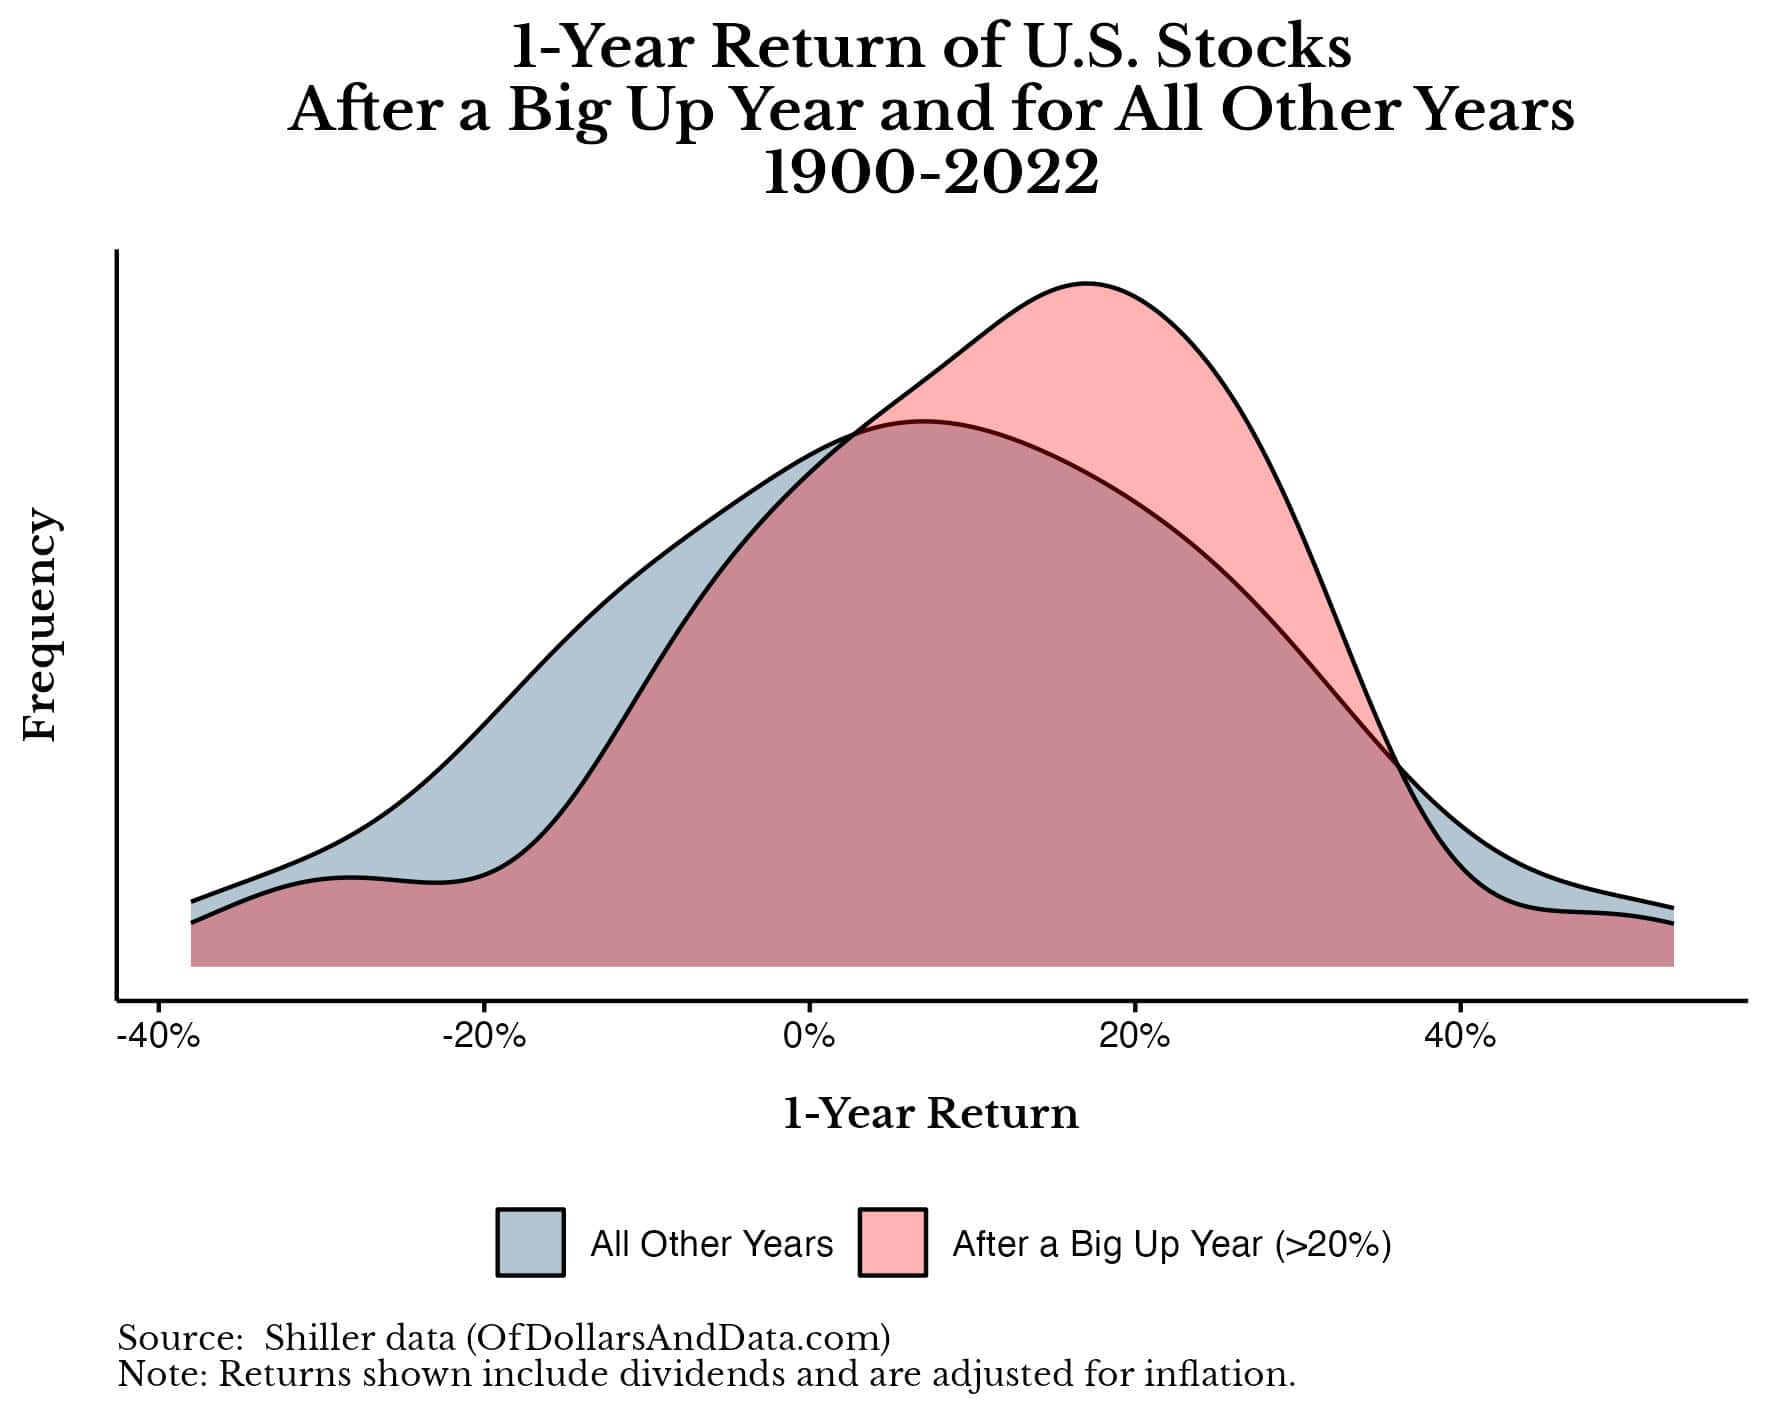
In particular, the average 1-year return following a big up year is 11% compared with just 7% in all other years. Though this difference is not statistically significant at the 5% level, it suggests that market momentum isn’t a complete fluke. I’ve demonstrated this previously when discussing why it’s okay to buy at all time highs.
Unfortunately, these kind of upward trends don’t last forever. If we were to plot the return distributions over the next five years following a big up year (against all other years), we would see that any sort of short-term momentum seems to have faded away:
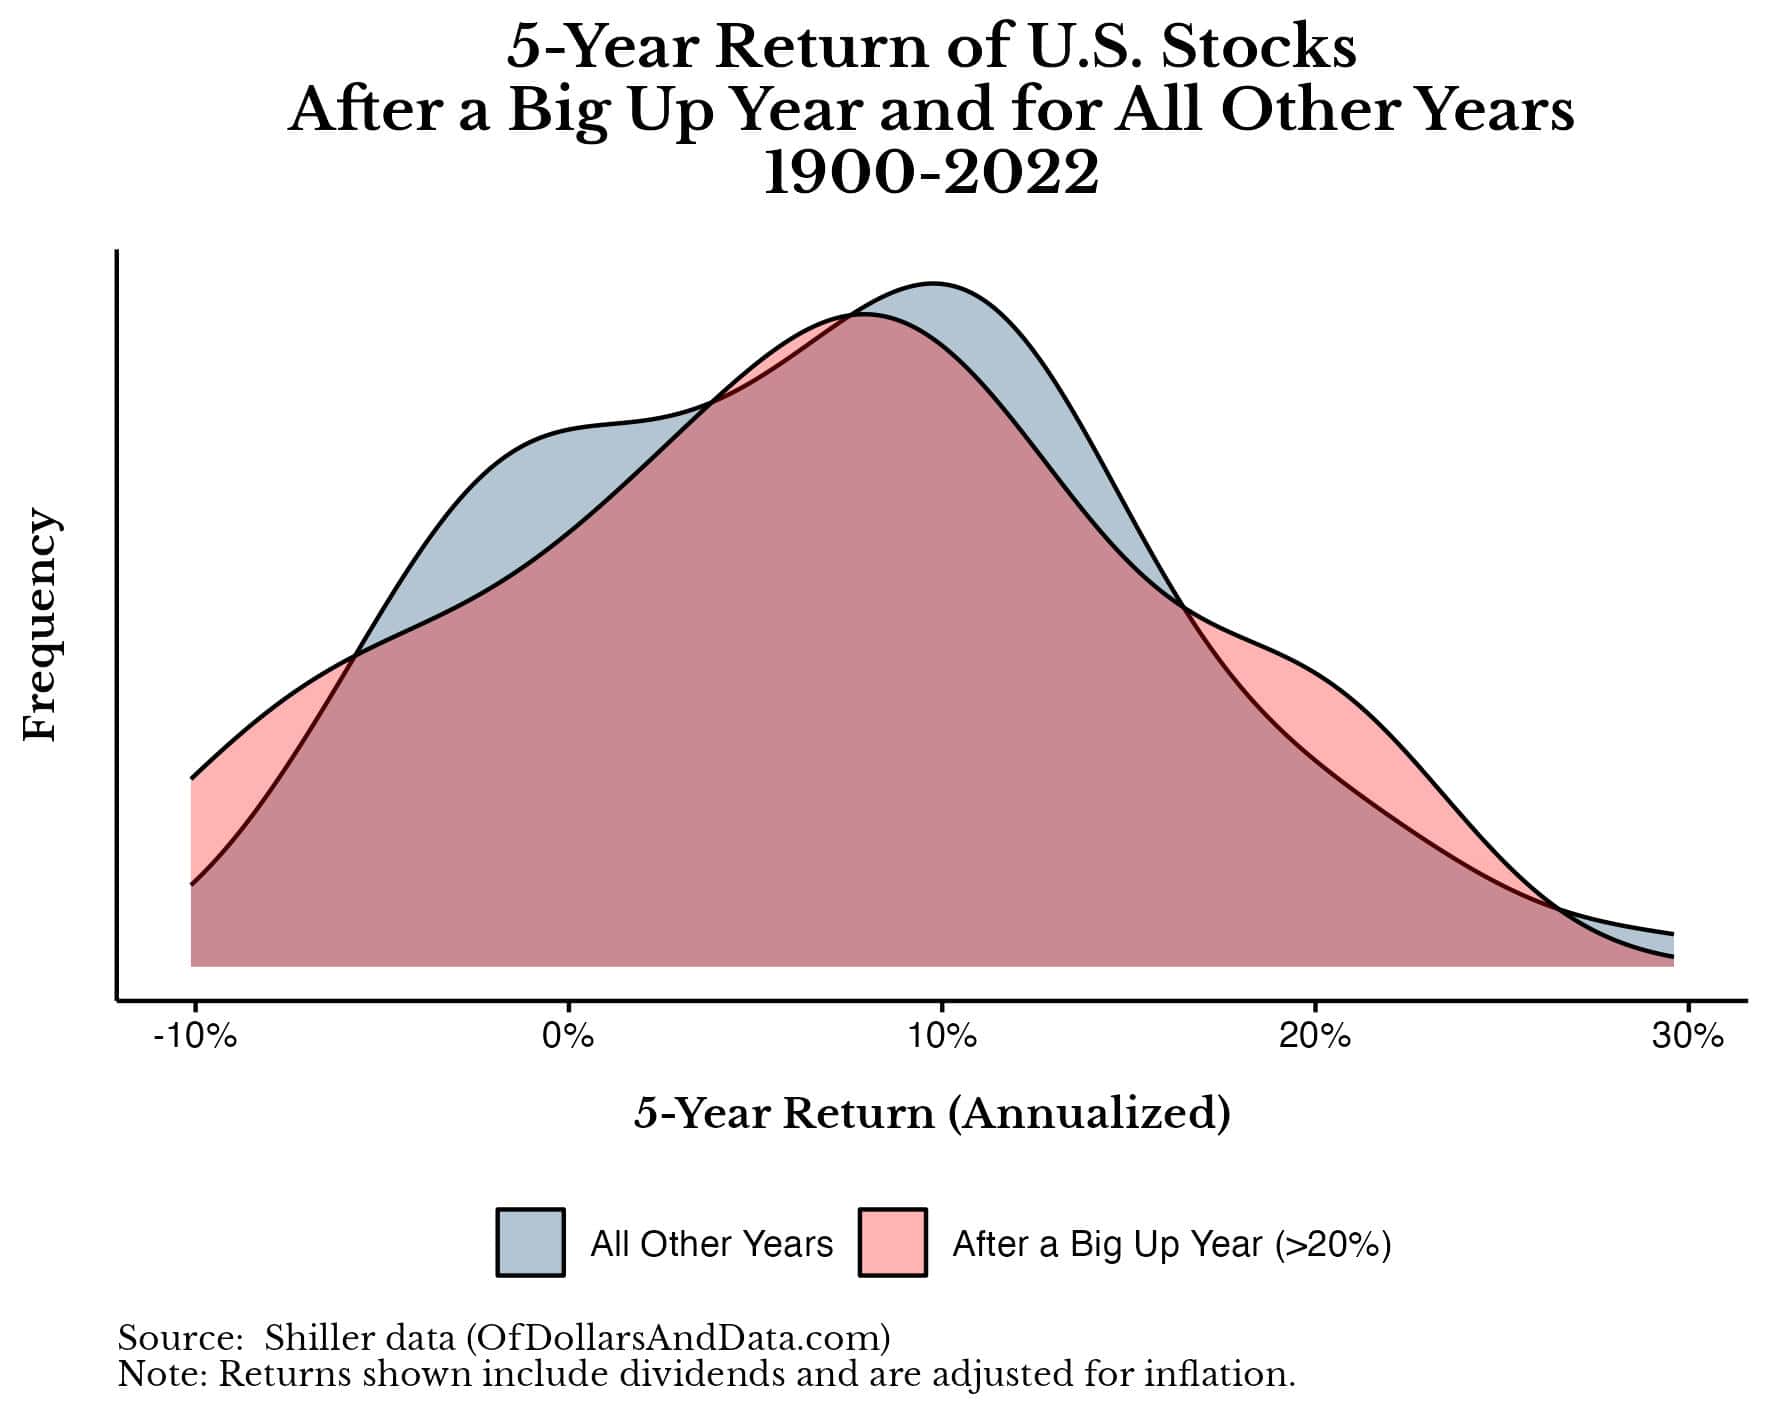
As you can see, the distribution of 5-year returns following a big up year are nearly identical to the 5-year returns among all other years. These plots suggests that while up years tend to follow up years (over a 1-year period), this momentum eventually fades away.
This is my expectation for 2024 (and beyond). Markets will move upward until some catalyst knocks them off track. In 2008, this catalyst was defaulting mortgages that led to a financial crisis. In 2020, it was the COVID-19 pandemic. And, in 2022, it was investors waking up to the high valuations of 2021.
What will cause the next market decline? I have no clue. It could be a geopolitical event, a climate catastrophe, or another supply chain crisis. But, whatever it is, it will be unpredictable ahead of time. If it weren’t, then the market would already be pricing it in.
The good news is that markets tend to recover from these declines and continue growing. However, this isn’t true for all markets all of the time. But, it’s been true on a global scale for the last century. That’s what truly matters.
I know that some investors will read my prediction for 2024 and conclude that I am simple-minded or naive. “Of course he thinks 2024 will be an up year. He thinks every year will be an up year.”
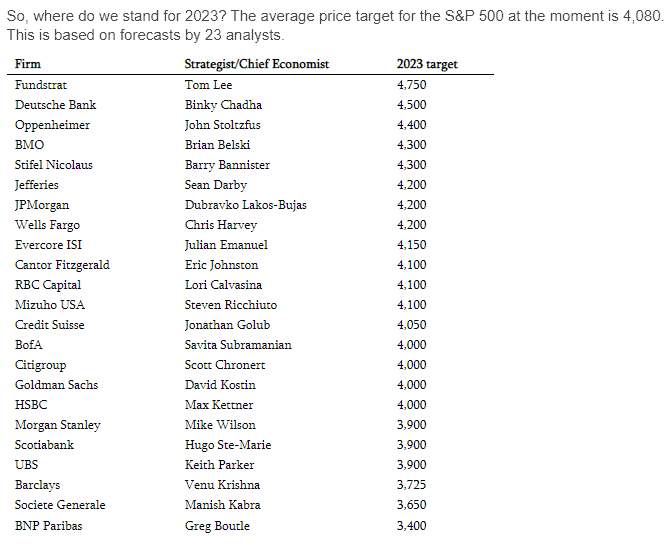
That’s not exactly true, but my approach of using the base rate of history is far better than what most analysts do when they try to predict the future. In fact, they would get far better results by being constantly bullish than doing what they are doing now. This is what noted permabull, Tom Lee, did last year and he ended up having the most accurate price target for the S&P 500 in 2023 among 23 different analysts:
The problem with using history as your guide (and being mostly bullish) is that it never makes you sound smart or sophisticated. But sounding smart and being right are two different things. Unfortunately, some people would rather look like mistaken geniuses than correct simpletons.
Their problem is failing to realize that the naive, unsophisticated approach is the right approach. It’s this meme on repeat:
Nevertheless, there will be those that believe that it can’t be this simple. But, it is.
It’s simple, but not easy. It isn’t easy to watch stocks fall by 7% in a day. It isn’t easy to see rates rise while inflation soars. It isn’t easy to witness people getting rich from magic internet money. Whatever 2024 (and beyond) brings won’t be easy either. But, the strategy to get through it will remain unchanged.
So you can either try to predict the future (and likely fail) or you can take whatever the market throws at you in stride and keep moving forward. The choice is yours.
I made my choice back in 2017. That’s when I first penned the term “Just Keep Buying.” But, it was only an idea back then. I had never actually tested it with my own money. But late 2018 changed that, then 2020 changed that, and 2022 changed it yet again. The strategy didn’t just work in backtests, it worked with real dollars on the line too.
It worked when people called me an idiot in 2020. It worked when they said “this time is different” in 2022. And it worked when they called for a recession (that never materialized) in 2023. And it will work in the future as well.
So will 2024 be an up year? I think so. And if it isn’t, it’s will be just another opportunity to eventually prove the doubters wrong. Happy investing, Happy New Year, and thank you for reading!
If you liked this post, consider signing up for my newsletter.
This is post 378. Any code I have related to this post can be found here with the same numbering: https://github.com/nmaggiulli/of-dollars-and-data

